. 2018 Jun 27;18(1):695.
doi: 10.1186/s12885-018-4609-x.

Gene promoter and exon DNA methylation changes in colon cancer development - mRNA expression and tumor mutation alterations

Affiliations

Gene promoter and exon DNA methylation changes in colon cancer development - mRNA expression and tumor mutation alterations

Béla Molnár et al. BMC Cancer. .

Abstract

Background: DNA mutations occur randomly and sporadically in growth-related genes, mostly on cytosines. Demethylation of cytosines may lead to genetic instability through spontaneous deamination. Aims were whole genome methylation and targeted mutation analysis of colorectal cancer (CRC)-related genes and mRNA expression analysis of TP53 pathway genes.

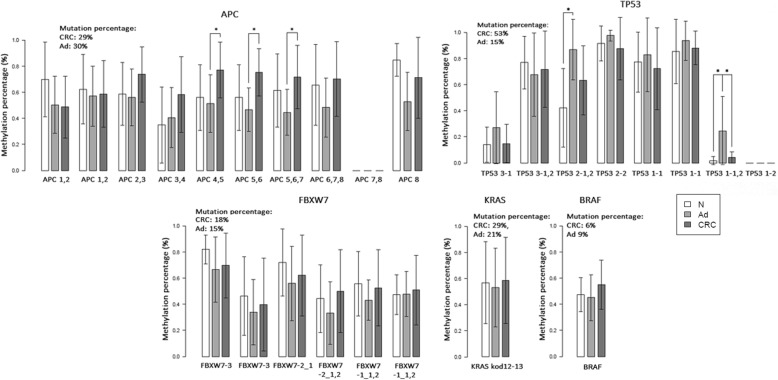
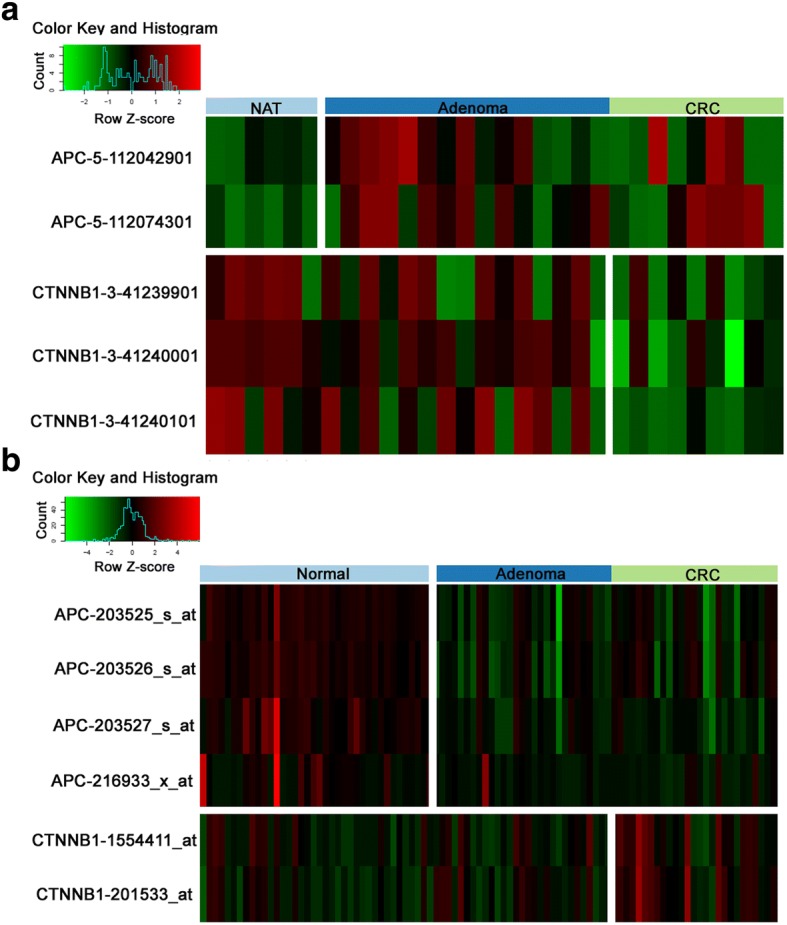
Methods: Long interspersed nuclear element-1 (LINE-1) BS-PCR followed by pyrosequencing was performed for the estimation of global DNA metlyation levels along the colorectal normal-adenoma-carcinoma sequence. Methyl capture sequencing was done on 6 normal adjacent (NAT), 15 adenomatous (AD) and 9 CRC tissues. Overall quantitative methylation analysis, selection of top hyper/hypomethylated genes, methylation analysis on mutation regions and TP53 pathway gene promoters were performed. Mutations of 12 CRC-related genes (APC, BRAF, CTNNB1, EGFR, FBXW7, KRAS, NRAS, MSH6, PIK3CA, SMAD2, SMAD4, TP53) were evaluated. mRNA expression of TP53 pathway genes was also analyzed.

Results: According to the LINE-1 methylation results, overall hypomethylation was observed along the normal-adenoma-carcinoma sequence. Within top50 differential methylated regions (DMRs), in AD-N comparison TP73, NGFR, PDGFRA genes were hypermethylated, FMN1, SLC16A7 genes were hypomethylated. In CRC-N comparison DKK2, SDC2, SOX1 genes showed hypermethylation, while ERBB4, CREB5, CNTN1 genes were hypomethylated. In certain mutation hot spot regions significant DNA methylation alterations were detected. The TP53 gene body was addressed by hypermethylation in adenomas. APC, TP53 and KRAS mutations were found in 30, 15, 21% of adenomas, and in 29, 53, 29% of CRCs, respectively. mRNA expression changes were observed in several TP53 pathway genes showing promoter methylation alterations.

Conclusions: DNA methylation with consecutive phenotypic effect can be observed in a high number of promoter and gene body regions through CRC development.

Keywords: Adenoma; Colorectal cancer; DNA methylation; Methyl capture sequencing; Mutation; TP53 signaling pathway.


Conflict of interest statement

Ethics approval and consent to participate

The study was conducted according to the Helsinki declaration and approved by the local ethics committee and government authorities (Regional and Institutional Committee of Science and Research Ethics (TUKEB) Nr.: 69/2008, 202/2009 and 23,970/2011 Semmelweis University, Budapest, Hungary). All routine colonic biopsy samples from the patients were taken after written informed consent and ethical permission was obtained for participation in the study.

Consent for publication

Not applicable.

Competing interests

The authors declare that they have no competing interests.

Publisher’s Note

Springer Nature remains neutral with regard to jurisdictional claims in published maps and institutional affiliations.

Figures

Fig. 1
Fig. 1
Global DNA methylation alterations of the normal-adenoma-colorectal cancer sequence. a DNA methylation of LINE-1 (long interspersed nuclear element-1) in CRC, adenoma and normal tissue samples. N = normal, Ad = adenoma, CRC = colorectal cancer; b Category distribution of global DNA methylation in CRC, adenoma and NAT samples analyzed by methyl capture sequencing. DNA methylation percentage categories are shown on the X axis, while the numbers of 100 base pair analysis windows are represented on the Y axis. NAT = normal adjacent tissue, AD = adenoma, CRC = colorectal cancer.
Fig. 2
Fig. 2
DNA methylation alterations in mutation hot-spot regions of genes frequently mutated in CRC and adenoma. Methylation percentage values are shown in 100 base pair analysis regions located in mutation hot-spot areas of genes (TP53, APC, KRAS, BRAF and FBXW7) frequently mutated in CRC and adenoma tissue. The frequencies of mutations in CRC and adenoma samples detected in our previous multiplex PCR-based CRC mutation hot-spot sequencing study [27] are also represented. *p < 0.05, CRC = colorectal cancer, Ad = adenoma, N = normal adjacent tissue
Fig. 3
Fig. 3
Inverse promoter DNA methylation and mRNA expression alterations of APC and CTNNB1 genes in CRC and adenoma samples. a Significant DMRs in promoter regions of APC and CTNNB1 genes in CRC and adenoma samples (p < 0.05). Hypermethylation is marked with red, while hypomethylated DMRs are green. The names of the DMRs indicate the official gene symbol_number of the chromosome_start position of the DMR. CRC = colorectal cancer, NAT = normal adjacent tissue. b mRNA expression pattern of APC and CTNNB1 genes in CRC and adenoma (GSE37364 [28]). Overexpression is marked with red, while downregulated genes are green. CRC = colorectal cancer
Fig. 4
Fig. 4
Box plots of DMRs in TP53 pathway gene promoters with the highest DNA methylation differences between CRC and NAT samples. Box plots represent the DNA methylation levels (β-values) of differentially methylated regions (DMRs) in TP53 pathway gene promoters showing the highest DNA methylation differences between CRC and NAT tissue samples. Individual DNA methylation level values are shown by red dots, and the median and standard deviation of the β-values are also demonstrated. The names of the DMRs indicate the official gene symbol_number of the chromosome_start position of the DMR. NAT = normal adjacent tissue, CRC = colorectal cancer, CASP8 = caspase 8, CCNE1 = cyclin E1, EI24 = EI24 autophagy associated transmembrane protein, FAS = Fas cell surface death receptor, IGFBP3 = insulin-like growth factor binding protein 3, TP73 = tumor protein p73

Similar articles

Cited by

References

    1. Ferlay J, Soerjomataram I, Dikshit R, Eser S, Mathers C, Rebelo M, Parkin DM, Forman D, Bray F. Cancer incidence and mortality worldwide: sources, methods and major patterns in GLOBOCAN 2012. Int J Cancer. 2015;136:E359–E386. doi: 10.1002/ijc.29210. - DOI - PubMed
    1. Vogelstein B, Fearon ER, Hamilton SR, Kern SE, Preisinger AC, Leppert M, Nakamura Y, White R, Smits AM, Bos JL. Genetic alterations during colorectal-tumor development. N Engl J Med. 1988;319:525–532. doi: 10.1056/NEJM198809013190901. - DOI - PubMed
    1. Lao VV, Grady WM. Epigenetics and colorectal cancer. Nat Rev Gastroenterol Hepatol. 2011;8:686–700. doi: 10.1038/nrgastro.2011.173. - DOI - PMC - PubMed
    1. Network CGA. Comprehensive molecular characterization of human colon and rectal cancer. Nature. 2012;487:330–337. doi: 10.1038/nature11252. - DOI - PMC - PubMed
    1. Costello JF, Frühwald MC, Smiraglia DJ, Rush LJ, Robertson GP, Gao X, Wright FA, Feramisco JD, Peltomäki P, Lang JC, et al. Aberrant CpG-island methylation has non-random and tumour-type-specific patterns. Nat Genet. 2000;24:132–138. doi: 10.1038/72785. - DOI - PubMed

Substances