

A longitudinal human phantom reliability study of multi-center T1-weighted, DTI, and resting state fMRI data
- PMID: 29945740
- PMCID: PMC6482446
- DOI: 10.1016/j.pscychresns.2018.06.004
A longitudinal human phantom reliability study of multi-center T1-weighted, DTI, and resting state fMRI data
Abstract
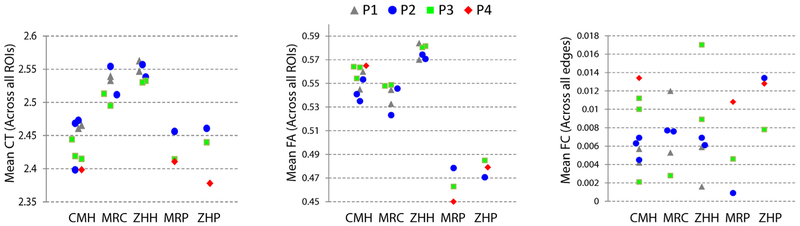
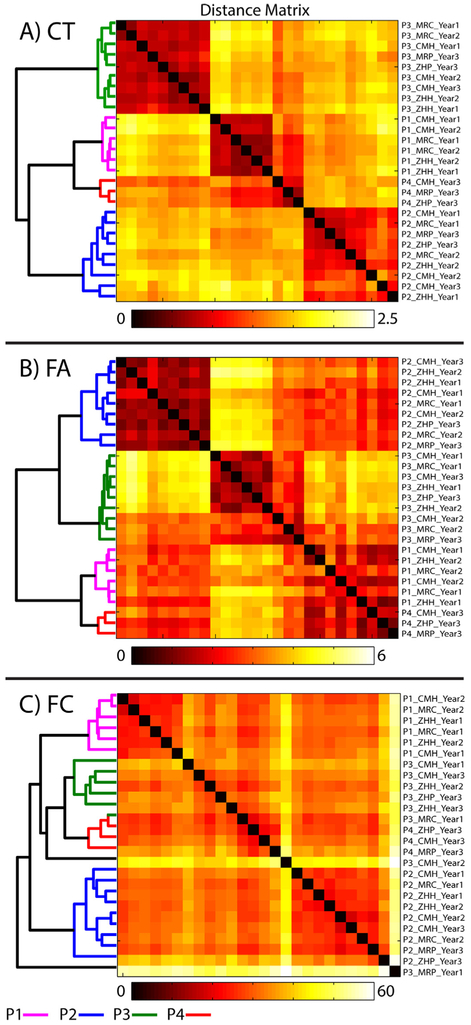
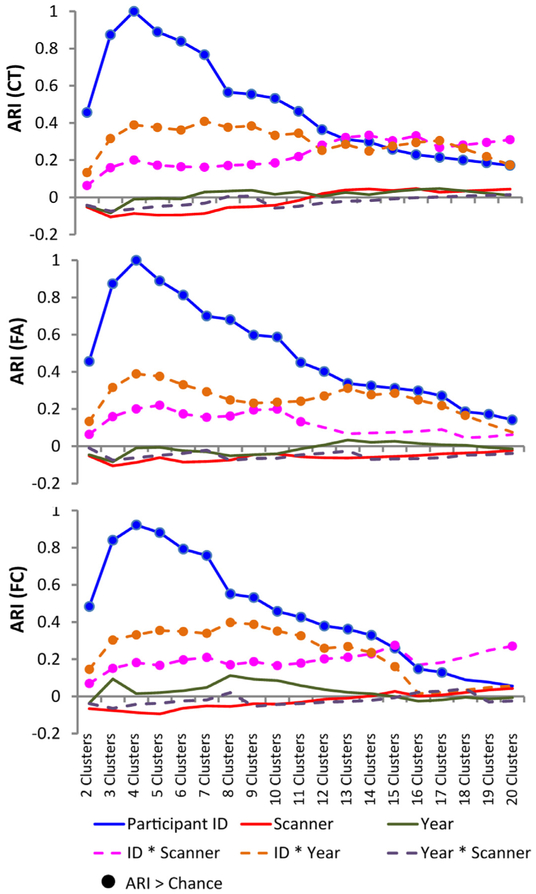
Multi-center MRI studies can enhance power, generalizability, and discovery for clinical neuroimaging research in brain disorders. Here, we sought to establish the utility of a clustering algorithm as an alternative to more traditional intra-class correlation coefficient approaches in a longitudinal multi-center human phantom study. We completed annual reliability scans on 'travelling human phantoms'. Acquisitions across sites were harmonized prospectively. Twenty-seven MRI sessions were available across four participants, scanned on five scanners, across three years. For each scan, three metrics were extracted: cortical thickness (CT), white matter fractional anisotropy (FA), and resting state functional connectivity (FC). For each metric, hierarchical clustering (Ward's method) was performed. The cluster solutions were compared to participant and scanner using the adjusted Rand index (ARI). For all metrics, data clustered by participant rather than by scanner (ARI > 0.8 comparing clusters to participants, ARI < 0.2 comparing clusters to scanners). These results demonstrate that hierarchical clustering can reliably identify structural and functional scans from different participants imaged on different scanners across time. With increasing interest in data-driven approaches in psychiatric and neurologic brain imaging studies, our findings provide a framework for multi-center analytic approaches aiming to identify subgroups of participants based on brain structure or function.
Keywords: Cortical thickness; DTI; Fractional anisotropy; Functional connectivity; Hierarchical clustering; Human phantoms; Multi-site; Scanner reliability; Scanner variability; T1; rsfMRI.
Copyright © 2018. Published by Elsevier B.V.
Figures
References
-
- Baker M, 2016. 1,500 scientists lift the lid on reproducibility. Nature 533, 452–454. - PubMed
-
- Brown GG, Mathalon DH, Stern H, Ford J, Mueller B, Greve DN, McCarthy G, Voyvodic J, Glover G, Diaz M, Yetter E, Ozyurt IB, Jorgensen KW, Wible CG, Turner JA, Thompson WK, Potkin SG, Network, FunctionBiomedicalInformaticsResearch, 2011. Multisite reliability of cognitive BOLD data. Neuroimage 54, 2163–2175. - PMC - PubMed
-
- Cannon TD, Sun F, McEwen SJ, Papademetris X, He G, van Erp TGM, Jacobson A, Bearden CE, Walker E, Hu X, Zhou L, Seidman LJ, Thermenos HW, Cornblatt B, Olvet DM, Perkins D, Belger A, Cadenhead K, Tsuang M, Mirzakhanian H, Addington J, Frayne R, Woods SW, McGlashan TH, Constable RT, Qiu M, Mathalon DH, Thompson P, Toga AW, 2014. Reliability of neuroanatomical measurements in a multisite longitudinal study of youth at risk for psychosis. Hum. Brain Mapp. 35, 2424–2434. - PMC - PubMed
Publication types
MeSH terms
Grants and funding
LinkOut - more resources
Full Text Sources
Other Literature Sources
