. 2018 Jul 18;145(14):dev157149.
doi: 10.1242/dev.157149.

EED, a member of the polycomb group, is required for nephron differentiation and the maintenance of nephron progenitor cells

Affiliations

EED, a member of the polycomb group, is required for nephron differentiation and the maintenance of nephron progenitor cells

Le Zhang et al. Development. .

Abstract

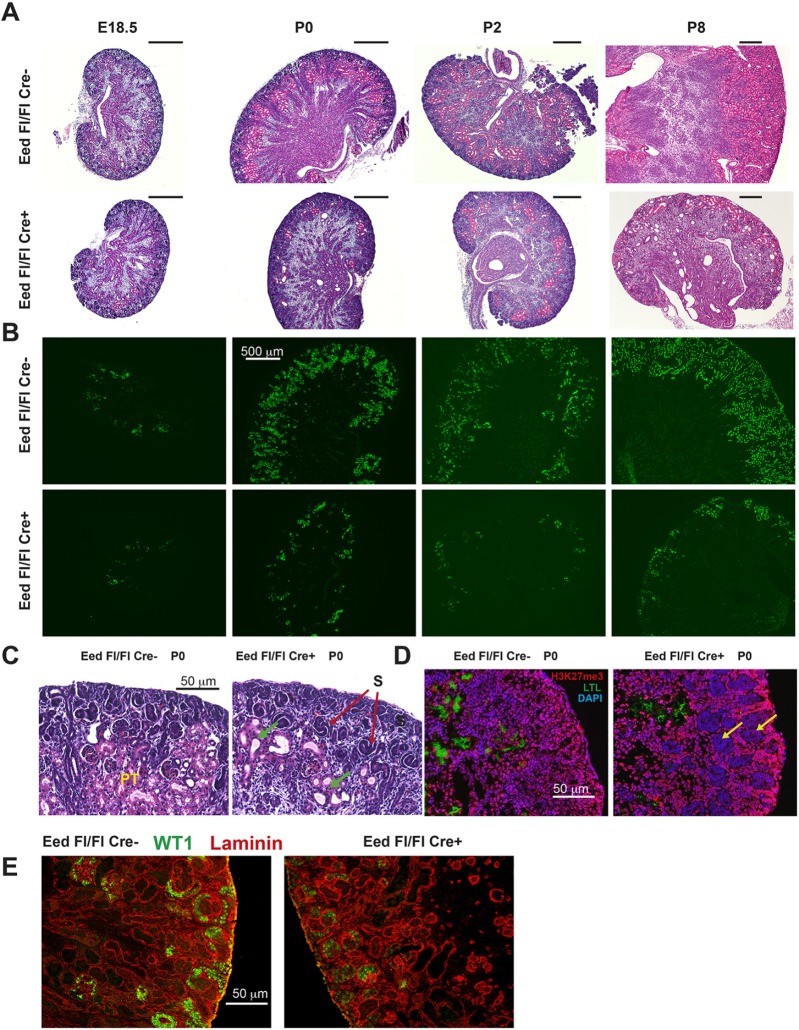
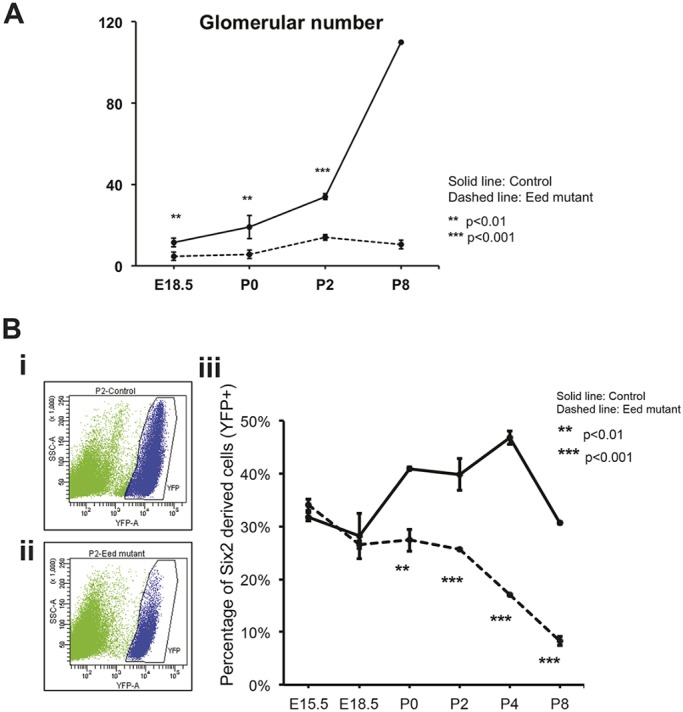
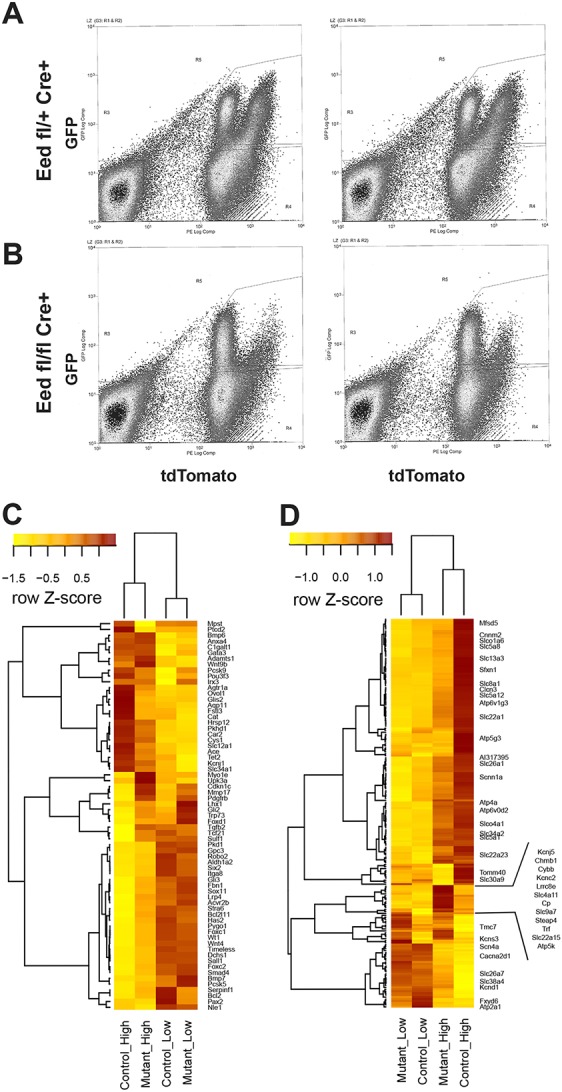
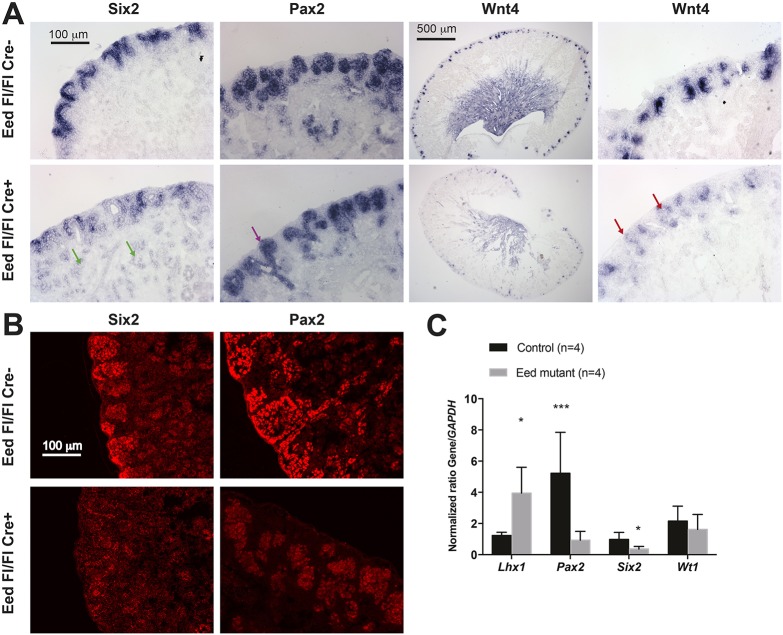
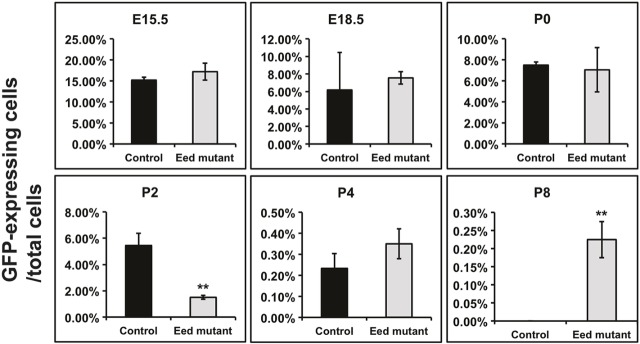
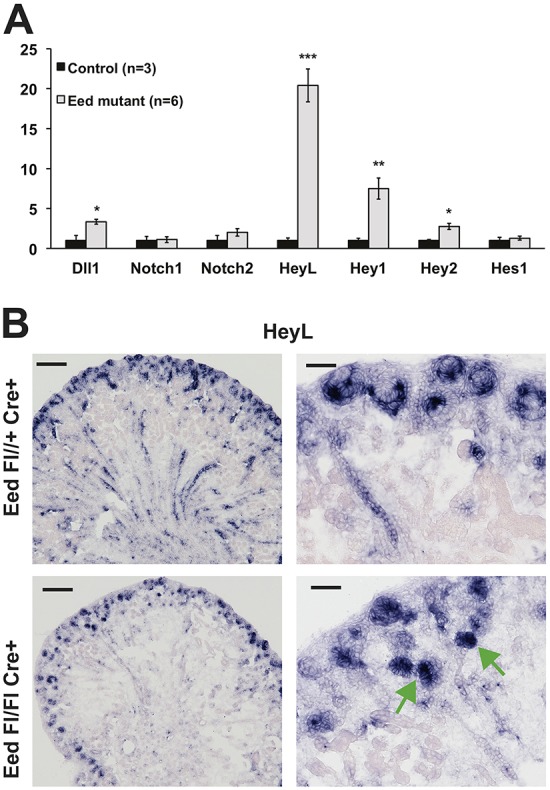
Epigenetic regulation of gene expression has a crucial role allowing for the self-renewal and differentiation of stem and progenitor populations during organogenesis. The mammalian kidney maintains a population of self-renewing stem cells that differentiate to give rise to thousands of nephrons, which are the functional units that carry out filtration to maintain physiological homeostasis. The polycomb repressive complex 2 (PRC2) epigenetically represses gene expression during development by placing the H3K27me3 mark on histone H3 at promoter and enhancer sites, resulting in gene silencing. To understand the role of PRC2 in nephron differentiation, we conditionally inactivated the Eed gene, which encodes a nonredundant component of the PRC2 complex, in nephron progenitor cells. Resultant kidneys were smaller and showed premature loss of progenitor cells. The progenitors in Eed mutant mice that were induced to differentiate did not develop into properly formed nephrons. Lhx1, normally expressed in the renal vesicle, was overexpressed in kidneys of Eed mutant mice. Thus, PRC2 has a crucial role in suppressing the expression of genes that maintain the progenitor state, allowing nephron differentiation to proceed.

Keywords: Epigenetics; Histone methylation; Kidney development; Nephron; Stem cell.


Conflict of interest statement

Competing interestsThe authors declare no competing or financial interests.

Figures

Fig. 1.
Fig. 1.
Histology and characterization of Eed mutant kidneys. (A) Hematoxylin and Eosin stains of E18.5, P0, P2 and P8 kidneys as indicated at the top of each column. Genotypes: top row, Eed fl/fl; bottom row, Six2-TGC, Eed fl/fl. (B) LTL lectin staining at equivalent time points as in (A). Top and bottom row genotypes as in (A). (C) Higher-power histology of P0 kidneys showing S-shaped tubules in Eed mutants (red arrows) and proximal tubules (PT) abundant in controls and largely absent in Eed mutants. Dysgenic tubules are present in Eed mutants (green arrows). (D) H3K27me3 staining (pink) showing areas of absent staining in Eed mutants (yellow arrows). (E) WT1 (green) and laminin (red) immunostaining of P0 kidneys. All images are representative of at least three kidneys analyzed. Scale bars in A: 500 µm.
Fig. 2.
Fig. 2.
Quantification of kidney growth. (A) Glomerular counts at E18.5, P0, P2 and P8 kidneys. See Materials and Methods for details of counting. Data are presented as mean±s.d. **P<0.05, ***P<0.01, Student's t-test. (B) FACS analysis of cells derived from P2 (i) Six2-TGC; Eed fl/+ R26R-EYFP+ kidneys; (ii) Six2-TGC; Eed fl/fl R26R-EYFP+ kidneys. (iii) Cell counts from time points indicated on the x-axis are plotted as YFP-expressing cells as a percentage of the total cells sorted. The YFP+ cells were designated as shown in blue for the P2 time point in (i,ii). P-values in A and Biii refer to differences between controls and mutants at the specific time points. At least four kidneys per time point/genotype were used. Data are presented as mean±s.d. **P<0.01, ***P<0.001, Student's t-test.
Fig. 3.
Fig. 3.
RNA-seq analysis of tdTomato-expressing cells. (A) FACS of kidney cells from Six2-TGC, Eed fl/+, R26R-tdTomato reporter mice. The results from two individual mice are shown, representative of 10 biological replicates. x-axis: tdTomato expression level; y-axis: GFP expression level. (B) FACS of Six2-TGC, Eed fl/fl, R26R-tdTomato reporter mice. (C,D) Heatmaps summarizing the expression of (C) kidney development (GO: 0001822) and (D) ion transport (GO:0006811)-specific gene sets identified as being differential. Expression values are normalized along the rows using Z-score transformation. Only selected genes are labeled in (D) for clarity.
Fig. 4.
Fig. 4.
Gene expression analysis of Eed mutant kidneys. (A) In situ hybridization analysis of P0 kidneys. Top row: Eed fl/fl; bottom row: Six2-TGC, Eed fl/fl. The probe used is noted at the top of each column. Wnt4 is shown as both a low-power image and a higher-power image, whereas all others are at higher power. Green arrows indicate ectopic Six2 expression; purple arrow indicates Pax2-expressing ureteric bud without differentiating nephron structures; and red arrows indicate ectopic Wnt4 expression in the usual location of the cap mesenchyme adjacent to ureteric bud. The images are representative of three kidneys for each genotype. (B) Immunostaining of SIX2 and PAX2 in P2 kidneys. Top row: Six2-TGC, Eed fl/+; bottom row: Six2-TGC, Eed fl/fl. The images are representative of three kidneys for each genotype. (C) qPCR analysis of gene expression. *P<0.05, ***P<0.01.
Fig. 5.
Fig. 5.
FACS analysis of Six2-expressing cells. The percentage of eGFP-expressing cells as a proportion of total cells is shown. Control: Six2-TGC, Eed fl/+, R26R-EYFP +/−; and Eed mutant: Six2-TGC, Eed fl/fl, R26R-EYFP +/−. The scales of the y-axis vary at different time points. Data are presented as mean±s.d. **P<0.01, Student's t-test. Time points without asterisks were not significantly different. N=at least three for each time point and/or genotype.
Fig. 6.
Fig. 6.
Notch signaling in Eed mutant kidneys. (A) qPCR analysis of gene expression of eYFP-FACS-sorted cells from Control: Six2-TGC, Eed fl/+, R26R-EYFP +/−; and Eed mutant: Six2-TGC, Eed fl/fl, R26R-EYFP +/−. N=3 controls and 6 mutants. Controls for each gene w set at ‘1’. Data are presented as mean±s.d. *P<0.05, **P<0.01, ***P<0.001, Student's t-test. All results were first normalized to GAPDH. (B) HeyL in situ hybridization (middle panels), merged images (right panels). HeyL is not present in tubules of maturing nephrons but is present in dysgenic tubules of Eed mutant (green arrows, lower right panel). Scale bars: 500 µm, left panels; 50 µm, right panels. Images are representative of three experiments.

References

    1. Adli M., Parlak M., Li Y. and El-Dahr S. S. (2015). Epigenetic States of nephron progenitors and epithelial differentiation. J. Cell. Biochem. 116, 893-902. 10.1002/jcb.25048 - DOI - PMC - PubMed
    1. Aiden A. P., Rivera M. N., Rheinbay E., Ku M., Coffman E. J., Truong T. T., Vargas S. O., Lander E. S., Haber D. A. and Bernstein B. E. (2010). Wilms tumor chromatin profiles highlight stem cell properties and a renal developmental network. Cell Stem Cell 6, 591-602. 10.1016/j.stem.2010.03.016 - DOI - PMC - PubMed
    1. Anders S., Pyl P. T. and Huber W. (2015). HTSeq--a Python framework to work with high-throughput sequencing data. Bioinformatics 31, 166-169. 10.1093/bioinformatics/btu638 - DOI - PMC - PubMed
    1. Barak H., Huh S.-H., Chen S., Jeanpierre C., Martinovic J., Parisot M., Bole-Feysot C., Nitschké P., Salomon R., Antignac C. et al. (2012). FGF9 and FGF20 maintain the stemness of nephron progenitors in mice and man. Dev. Cell 22, 1191-1207. 10.1016/j.devcel.2012.04.018 - DOI - PMC - PubMed
    1. Bernstein B. E., Mikkelsen T. S., Xie X., Kamal M., Huebert D. J., Cuff J., Fry B., Meissner A., Wernig M., Plath K. et al. (2006). A bivalent chromatin structure marks key developmental genes in embryonic stem cells. Cell 125, 315-326. 10.1016/j.cell.2006.02.041 - DOI - PubMed

Publication types

MeSH terms