. 2018 Aug;28(8):1243-1252.
doi: 10.1101/gr.232488.117. Epub 2018 Jun 26.

An atlas of chromatin accessibility in the adult human brain

Affiliations

An atlas of chromatin accessibility in the adult human brain

John F Fullard et al. Genome Res. 2018 Aug.

Abstract

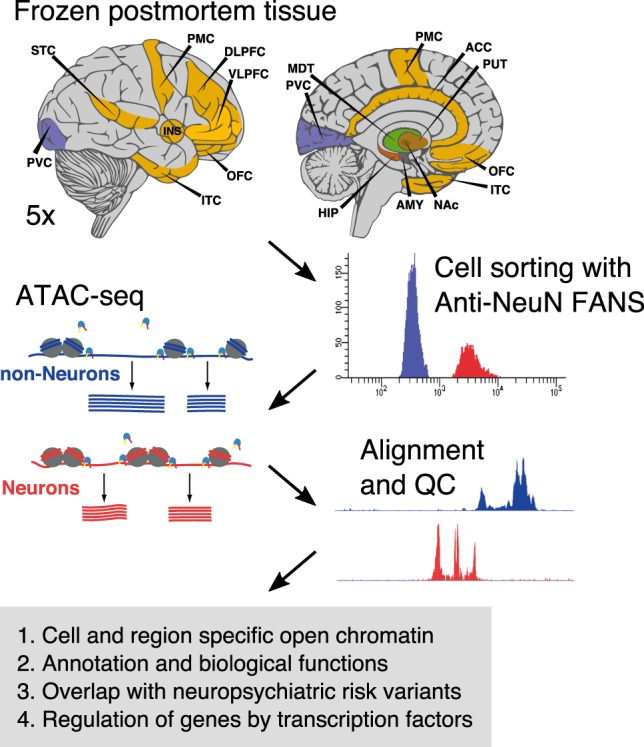
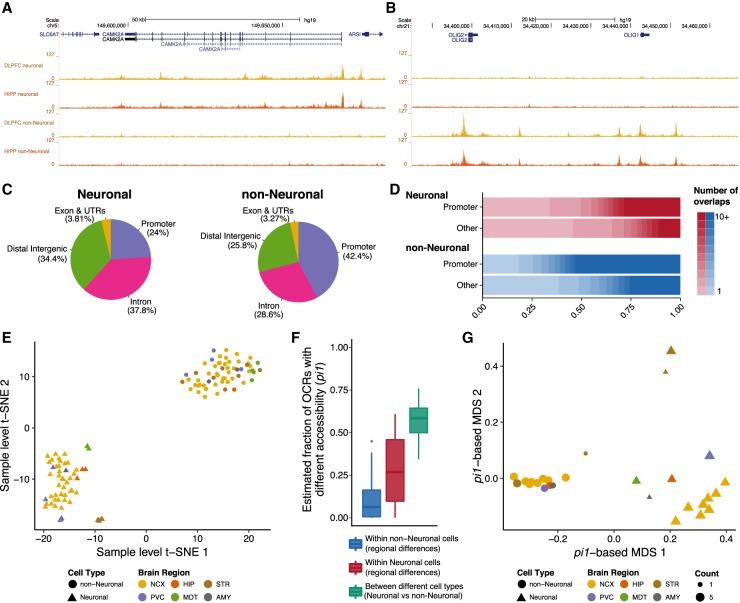
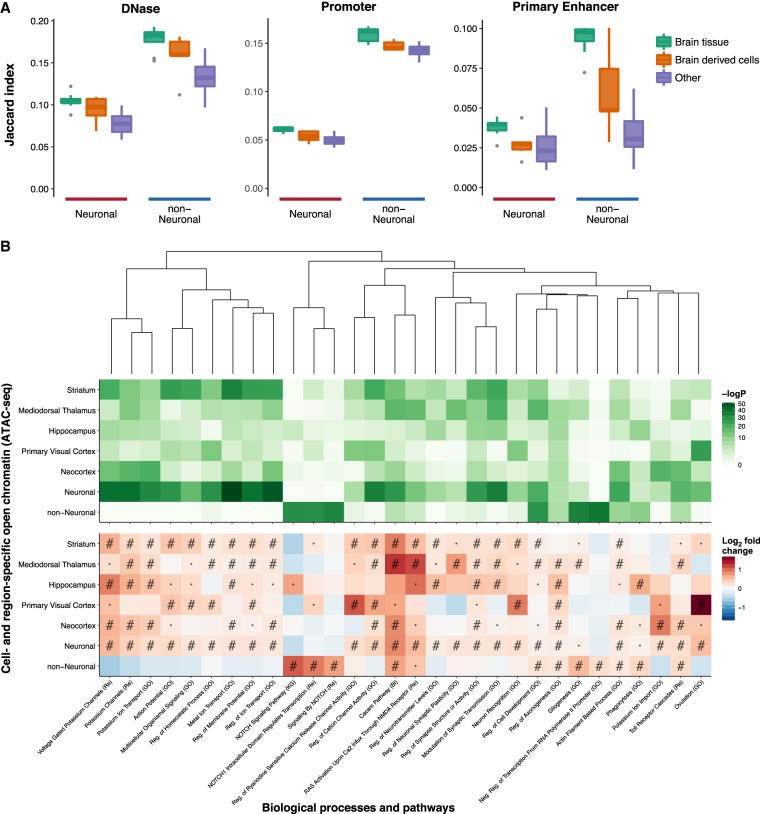
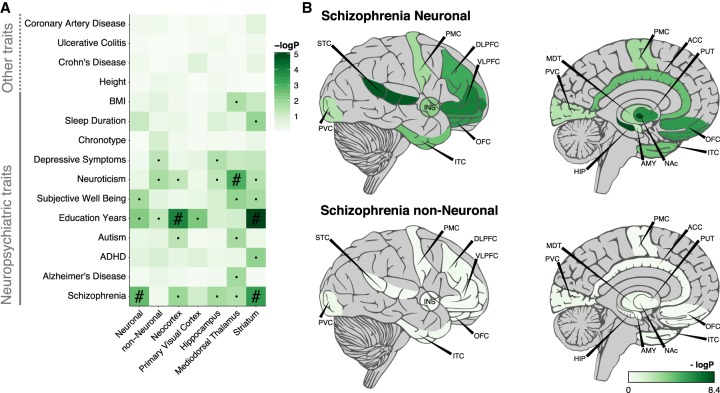
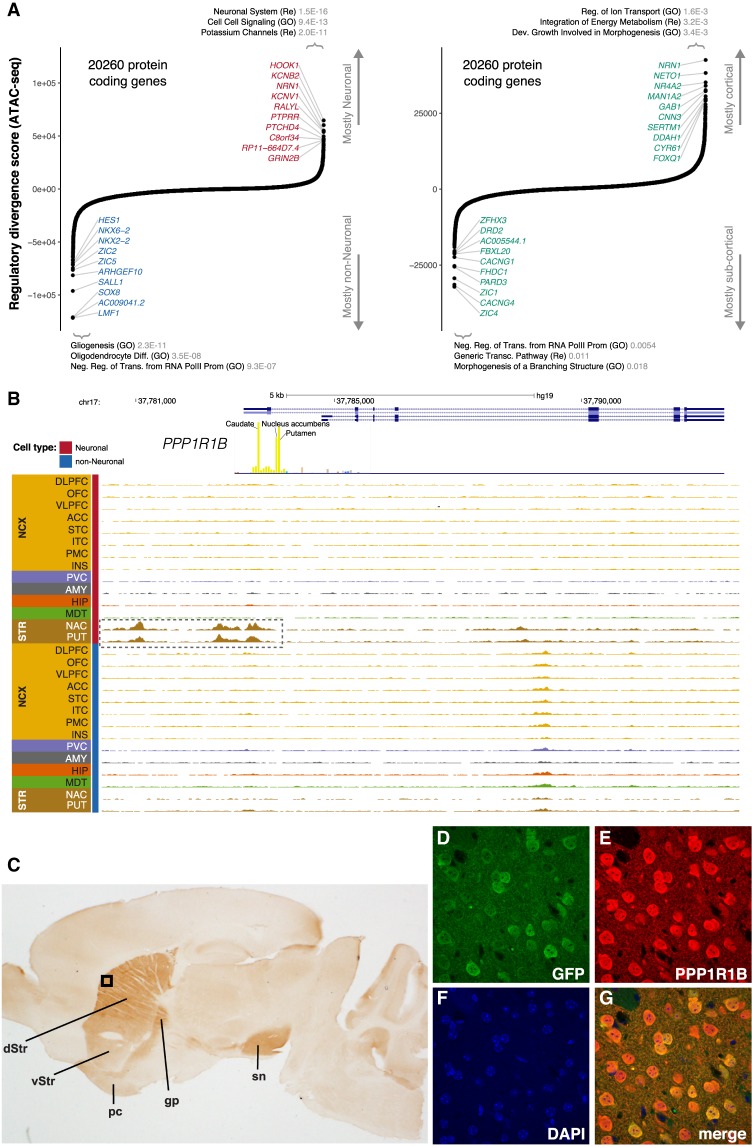
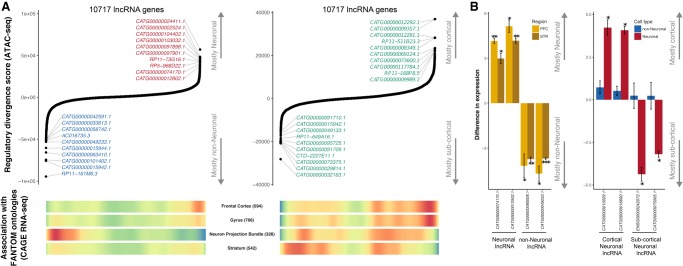
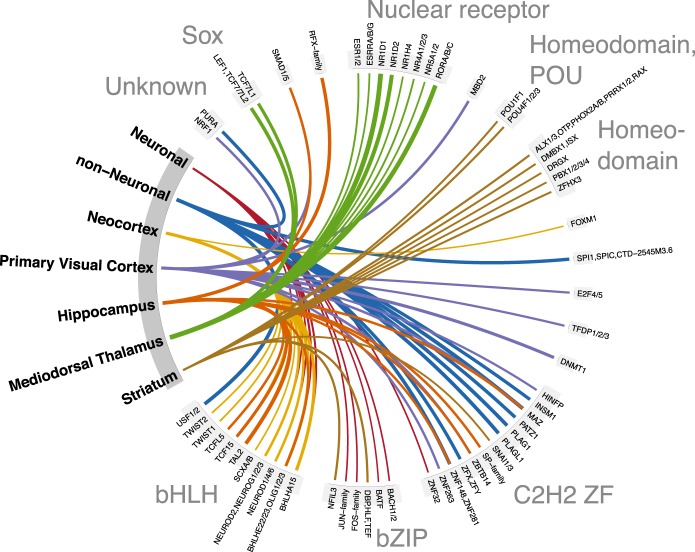
Most common genetic risk variants associated with neuropsychiatric disease are noncoding and are thought to exert their effects by disrupting the function of cis regulatory elements (CREs), including promoters and enhancers. Within each cell, chromatin is arranged in specific patterns to expose the repertoire of CREs required for optimal spatiotemporal regulation of gene expression. To further understand the complex mechanisms that modulate transcription in the brain, we used frozen postmortem samples to generate the largest human brain and cell-type-specific open chromatin data set to date. Using the Assay for Transposase Accessible Chromatin followed by sequencing (ATAC-seq), we created maps of chromatin accessibility in two cell types (neurons and non-neurons) across 14 distinct brain regions of five individuals. Chromatin structure varies markedly by cell type, with neuronal chromatin displaying higher regional variability than that of non-neurons. Among our findings is an open chromatin region (OCR) specific to neurons of the striatum. When placed in the mouse, a human sequence derived from this OCR recapitulates the cell type and regional expression pattern predicted by our ATAC-seq experiments. Furthermore, differentially accessible chromatin overlaps with the genetic architecture of neuropsychiatric traits and identifies differences in molecular pathways and biological functions. By leveraging transcription factor binding analysis, we identify protein-coding and long noncoding RNAs (lncRNAs) with cell-type and brain region specificity. Our data provide a valuable resource to the research community and we provide this human brain chromatin accessibility atlas as an online database "Brain Open Chromatin Atlas (BOCA)" to facilitate interpretation.


Figures

Figure 1.
Figure 1.
Schematic outline of the study design. Dissections from 14 brain regions of five control subjects were obtained from frozen human postmortem tissue. We combined fluorescence-activated nuclear sorting (FANS) with ATAC-seq, followed by downstream analyses, to identify cell-type–specific open chromatin regions. The brain regions and abbreviations are described in Supplemental Table S2.
Figure 2.
Figure 2.
Comparisons between neuronal and non-neuronal OCRs of various brain regions. Representative cell-type–specific open chromatin tracks in the dorsolateral prefrontal cortex (DLPFC) and hippocampus at known neuron-specific (CAMK2A) (A) and non-neuron-specific (OLIG1 and OLIG2) genes (B). (C) Neuronal and non-neuronal OCRs show distinct distribution of genomic contexts. OCRs within 3 kb of a TSS were considered as promoter OCRs. (D) The distribution of the number of brain regions in which a consensus OCR was found, stratified by cell type and promoter/nonpromoter OCRs. OCRs within 3 kb of a TSS were considered as promoter OCRs. (E) Clustering of the individual samples (n = 115) using t-SNE. Brain regions are grouped in six broad areas: (AMY) amygdala; (HIP) hippocampus; (MDT) mediodorsal thalamus; (NCX) neocortex; (PVC) primary visual cortex; (STR) striatum. (F) Distribution of statistical dissimilarity (quantified based on the proportion of true tests, pi1) for inter- and intra-cell-type pairwise comparisons. Larger pi1 indicates a larger fraction of OCRs estimated to be different between samples based on pairwise comparisons. (G) Multidimensional scaling of brain regions and cell types (n = 28) using the pi1 estimates of statistical dissimilarity as distance. Same abbreviations as in E. The MDT non-neuronal group is immediately adjacent to, and partly obscured by, the leftmost non-neuronal striatum group.
Figure 3.
Figure 3.
Overlap with other epigenomes and biological functions. (A) Overlap between DNase-seq OCRs and promoter/primary enhancer states of 127 epigenomes from REMC and neuronal and non-neuronal OCRs identified by ATAC-seq. Samples from REMC are split into three groups: brain tissue, brain-derived cells, and nonbrain tissues (referred to as “Other”). The full results for the individual REMC samples are shown in Supplemental Figures S11 and S12. (B) Overlap between cell- and region-specific open chromatin (ATAC-seq) and gene sets representing biological processes and pathways. Only those that were within the top five most significant gene sets in one or more ATAC-seq categories are shown. Pathways were clustered by the Jaccard index using the WardD method based on the overlap between the genes in the different gene sets and not the enrichments. This was done to show how enrichments varied by cell type and region in terms of related pathways. (#) FDR < 0.001; (·) FDR < 0.05; (Bi) BIOCARTA; (GO) gene ontology; (KG) KEGG; (Re) REACTOME. In this analysis, the region-specific OCRs were derived from neuronal samples only.
Figure 4.
Figure 4.
Overlap between genetic variants associated with various complex traits and identified OCRs assayed using LD-score partitioned heritability. (A) Overlap between cell-type– and region-specific OCRs and genetic risk variants of various traits. The region-specific OCRs are based only on neuronal samples. (B) Overlap between all OCRs identified in 14 brain regions by two cell types and schizophrenia genetic risk variants. OCRs were in all cases padded with 1000 bp to also capture adjacent genetic variants. (Chronotype) whether one is a morning or an evening person; (·) nominally significant; (#) significant after FDR correction of multiple testing across all traits and OCRs sets.
Figure 5.
Figure 5.
Identification of cell- and region-specific regulation of protein-coding genes. (A) Ranking of protein-coding genes based on their regulatory divergence score averaged across all neuronal versus all non-neuronal samples (left) and cortical neuronal samples versus subcortical neuronal samples (right). The regulatory divergence score is a combined measure for the difference in the regulatory burden for each gene, multiplied by how different the regulatory landscape is surrounding the gene (Methods). A gene set enrichment analysis using general gene sets and the top 500 most specific genes for either cell type/region using a one-sided Fisher's exact test was performed—the top three gene sets with P-values corrected for multiple testing using FDR are indicated. SOX8, AC009041.2, and LMF1 are all located in the same genetic locus. (B) Regional plot in the PPP1R1B locus showing OCRs. The promoter OCR and putative proximal enhancer OCRs are highlighted (dashed box). (C) The identified human PPP1R1B upstream OCR along with Exon 1, Intron 1, and the 5′ end of Exon 2 were used to direct expression of EGFP in transgenic mice. Expression identified with anti-PPP1R1B and DAB is restricted to the dorsal (dStr) and ventral striatum (vStr) (dorsal > ventral) and their projections (globus pallidus [gp] and substantia nigra [sn]) and the piriform cortex (pc). The black box indicates the region shown at higher magnification using immunofluorescence in DG: (D) anti-EGFP (green); (E) anti-PPP1R1B (DARPP-32) (red); (F) DAPI (blue); (G) a merged image. EGFP is expressed exclusively in PPP1R1B positive neurons.
Figure 6.
Figure 6.
Identification of cell- and region-specific regulation of lncRNA. (A) Top ranking of lncRNA genes based on their regulatory divergence score averaged across all neuronal versus all non-neuronal samples (left) and cortical neuronal samples versus subcortical neuronal samples (right). The regulatory divergence score is a combined measure of the difference in the regulatory burden for each gene multiplied by how different the regulatory landscape is surrounding that gene (Methods). lncRNA genes were obtained from the FANTOM CAT Robust category, from which only genes from the category “far from protein-coding genes” were retained. Genes with coding status “uncertain” were excluded. (Bottom) Heatmaps of whether gene expression (CAGE) identified genes associated with the given anatomical structure. “Neuron Projection Bundle” includes samples from the corpus callosum and the optic nerve, which are depleted in neuronal nuclei. Red indicates a high gene density, and blue indicates a low gene density. Numbers in parentheses indicate the number of lncRNAs associated with the ontology. (B) qPCR validation of cell-type–specific (left) and brain region–specific (right) lncRNA identified by a regulatory divergence analysis based on ATAC-seq data. Shown are fold differences in expression for neuronal (positive values) to non-neuronal (negative values) gene expression (left) and cortical (positive values) to subcortical (negative values) (right). Error bars indicate standard deviation. (PFC) prefrontal cortex; (STR) striatum; (*) P < 0.05; (**) P < 0.01; (***) P < 0.005.
Figure 7.
Figure 7.
The top 10 transcription factor binding motifs showing the highest fold enrichment of footprinted binding sites within peaks specific to a given cell type or brain region compared to all peaks. The region-specific TFs are based only on neuronal samples. TF binding motifs are grouped by TF family, and line width indicates the log2-transformed fold enrichment. All shown enrichments were statistically significant after correcting for multiple testing in a one-sided binomial test. Similar plots of TF binding motif enrichments stratified by genomic context are shown in Supplemental Figure S24.

References

    1. Andersson R, Gebhard C, Miguel-Escalada I, Hoof I, Bornholdt J, Boyd M, Chen Y, Zhao X, Schmidl C, Suzuki T. 2014. An atlas of active enhancers across human cell types and tissues. Nature 507: 455–461. - PMC - PubMed
    1. Banovich NE, Li YI, Raj A, Ward MC, Greenside P, Calderon D, Tung PY, Burnett JE, Myrthil M, Thomas SM, et al. 2018. Impact of regulatory variation across human iPSCs and differentiated cells. Genome Res 28: 122–131. - PMC - PubMed
    1. Brené S, Lindefors N, Ehrlich M, Taubes T, Horiuchi A, Kopp J, Hall H, Sedvall G, Greengard P, Persson H. 1994. Expression of mRNAs encoding ARPP-16/19, ARPP-21, and DARPP-32 in human brain tissue. J Neurosci 14: 985–998. - PMC - PubMed
    1. Buenrostro JD, Giresi PG, Zaba LC, Chang HY, Greenleaf WJ. 2013. Transposition of native chromatin for fast and sensitive epigenomic profiling of open chromatin, DNA-binding proteins and nucleosome position. Nat Methods 10: 1213–1218. - PMC - PubMed
    1. Corces MR, Buenrostro JD, Wu B, Greenside PG, Chan SM, Koenig JL, Snyder MP, Pritchard JK, Kundaje A, Greenleaf WJ, et al. 2016. Lineage-specific and single-cell chromatin accessibility charts human hematopoiesis and leukemia evolution. Nat Genet 48: 1193–1203. - PMC - PubMed

Publication types