. 2018 Jul 1;32(13-14):915-928.
doi: 10.1101/gad.314815.118. Epub 2018 Jun 26.

POU2F3 is a master regulator of a tuft cell-like variant of small cell lung cancer

Affiliations

POU2F3 is a master regulator of a tuft cell-like variant of small cell lung cancer

Yu-Han Huang et al. Genes Dev. .

Abstract

Small cell lung cancer (SCLC) is widely considered to be a tumor of pulmonary neuroendocrine cells; however, a variant form of this disease has been described that lacks neuroendocrine features. Here, we applied domain-focused CRISPR screening to human cancer cell lines to identify the transcription factor (TF) POU2F3 (POU class 2 homeobox 3; also known as SKN-1a/OCT-11) as a powerful dependency in a subset of SCLC lines. An analysis of human SCLC specimens revealed that POU2F3 is expressed exclusively in variant SCLC tumors that lack expression of neuroendocrine markers and instead express markers of a chemosensory lineage known as tuft cells. Using chromatin- and RNA-profiling experiments, we provide evidence that POU2F3 is a master regulator of tuft cell identity in a variant form of SCLC. Moreover, we show that most SCLC tumors can be classified into one of three lineages based on the expression of POU2F3, ASCL1, or NEUROD1. Our CRISPR screens exposed other unique dependencies in POU2F3-expressing SCLC lines, including the lineage TFs SOX9 and ASCL2 and the receptor tyrosine kinase IGF1R (insulin-like growth factor 1 receptor). These data reveal POU2F3 as a cell identity determinant and a dependency in a tuft cell-like variant of SCLC, which may reflect a previously unrecognized cell of origin or a trans-differentiation event in this disease.

Keywords: POU2F3; enhancer; master regulator; small cell lung cancer; tuft cell.


Figures

Figure 1.
Figure 1.
CRISPR screen reveals POU2F3 as a dependency in a subset of human SCLC lines. (A) Essential TFs identified via pooled DNA-binding domain-focused CRISPR–Cas9 screens performed in the indicated panel of cancer cell lines. Plotted is the log2 fold change of sgRNA abundance after ∼14 population doublings. The effect of individual sgRNAs targeting each DNA-binding domain was averaged. The TFs shown were ranked by specificity for SCLC or are examples of pan-essential TF dependencies. NEG1, NEG2, and NEG3 are spike-in negative control sgRNAs. (NSCLC) Non-small cell lung cancer; (MV) morphological variant form of SCLC defined previously (Gazdar et al. 1985). (B) TF dependencies in NCI-H526 cells ranked by the average sgRNA log2 fold change in the pooled CRISPR screen. (C) Competition-based proliferation assays of individual sgRNAs to validate the results from the pooled screen. Since sgRNA expression is linked to GFP, reductions in GFP percentage reflect the fitness disadvantage caused by CRISPR-based gene targeting. sgNeg is a nontargeting negative control. An sgRNA targeting CDK1 is a positive control, and “e” refers to the exon number that is targeted by each sgRNA. Plotted is the average effect of five independent sgRNAs targeting the POU2F3 DNA-binding domain. n = 3. (D, top) POU2F3 and HSC70 protein levels detected by Western blotting. (Bottom) POU2F3 mRNA levels (reads per kilobase of transcript per million mapped reads [RPKM] from RNA sequencing [RNA-seq] analysis) in the indicated SCLC cell lines. (E) Western blotting performed on day 3 after sgRNA vector transduction in the indicated cell lines. (F, top) The design of a CRISPR-resistant synonymous mutant of POU2F3. (Bottom) Competition-based proliferation assays in NCI-H1048 cells expressing wild-type or CRISPR-resistant POU2F3 cDNA. n = 3. All bar graphs represent the mean ± SEM.
Figure 2.
Figure 2.
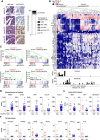
POU2F3 expression is associated with a neuroendocrinelow subtype of SCLC that expresses markers of the tuft cell lineage. (A) SCLC tissue microarray analysis by H&E and anti-POU2F3 immunohistochemical staining. (Left) Representative images of POU2F3high and POU2F3low samples. (Right) Summary of POU2F3 staining of 204 SCLC tumor samples. (B, top) Rederivation of an unsupervised clustering analysis of RNA-seq data obtained from 79 SCLC patient samples from a data set in George et al. (2015). Tumor samples are arranged in columns, and genes are arranged in rows, which were selected based on differential expression in these two groups of samples (George et al. 2015). (Bottom) Expression of POU2F3 and NEUROD1 across the 79 SCLC patient samples. (C) Gene set enrichment analysis (GSEA) of RNA-seq data, evaluating expression of “group 1 identity signature” genes after CRISPR-based targeting of POU2F3. RNA-seq was performed on cells at day 4 or 5 following lentiviral transduction of POU2F3 or control sgRNAs. (NES) Normalized enrichment score; (FWER P val) family-wise error rate P-value. (D) Expression of the indicated neuroendocrine cell lineage markers in POU2F3high and POU2F3low SCLC patient sample RNA-seq from George et al. (2015). Two-tailed t-test results comparing POU2F3high and POU2F3low samples were as follows: for INSM1, P < 0.0001; for CHGA, P = 0.0011; for GRP (gastrin-releasing peptide), P = 0.0046; for CALCA (calcitonin-related polypeptide), P = 0.1177; and for ASCL1, P < 0.0001. The horizontal line is the mean. (E) Expression of the indicated variant SCLC markers in POU2F3high and POU2F3low in SCLC patient sample RNA-seq data from George et al. (2015). Two-tailed t-test results comparing POU2F3high and POU2F3low samples were as follows: for REST, P < 0.0001; for MYC, P < 0.0001; and for NEUROD1, P = 0.0889. The horizontal line is the mean. (F) Expression of the indicated tuft cell markers in POU2F3high and POU2F3low in SCLC patient sample RNA-seq from George et al. (2015). Two-tailed t-test results were as follows: for POU2F3, P < 0.0001; for TRPM5, P < 0.0001; for SOX9, P < 0.0001; for GFI1B, P < 0.0001; for CHAT, P < 0.0001; and for AVIL, P < 0.0001. The horizontal line is the mean.
Figure 3.
Figure 3.
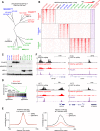
Enhancer landscapes classify SCLC lines based on POU2F3, ASCL1, or NEUROD1 expression. (A) Unsupervised clustering (Euclidian) using dissimilarity level (1 = Pearson correlation coefficient) of global H3K27ac profiles from 14 human SCLC cell lines measured using ChIP-seq analysis. Global H3K27ac profiles were correlated (Pearson), and correlation coefficients were used to calculate distances in the tree representation. (B) ChIP-seq density plots of H3K27ac tag density (red) centered at the summit of 463 P elements, 697 N elements, and 414 A elements across the 14 SCLC cell lines. Density plot of POU2F3 tag density (purple) in NCI-H1048 cells at the indicated regions. (C) Western blotting of POU2F3, ASCL1, NEUROD1, and HSC70 (loading control) in lysates from SCLC cell lines. (D) GSEA of RNA-seq data obtained from NCI-H1048 cells on day 4 following transduction of POU2F3 or control sgRNA, evaluating an effect on genes located near P elements. (NES) Normalized enrichment score; (FWER P val) family-wise error rate P-value. (E) A metaprofile analysis of H3K27ac enrichment at all H3K27ac peaks (107,606 total) or at 463 P elements, evaluating effect of POU2F3 inactivation. NCI-H1048 cells were collected for ChIP-seq analysis on day 3 following transduction with POU2F3 (red) or control (black) sgRNAs. (F) ChIP-seq profiles of H3K27ac (black and red) and POU2F3 (purple) at the indicated of tuft cell marker gene loci.
Figure 4.
Figure 4.
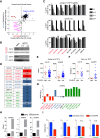
POU2F3high SCLC lines are hypersensitive to targeting of IGF1R. (A) Kinase domain-focused CRISPR screening in NCI-H82 (NEUROD1high) and NCI-H526 (POU2F3high) cells. The averaged log2 fold change of sgRNA abundance after ∼14 population doublings for each kinase domain is plotted. (B) Western blot of IGF1R and HSC70 (loading control) in NCI-H526 and NCI-H82 cells on day 4 after sgRNA transduction. (C) Arrayed format competition-based proliferation assays to evaluate the effect of IGF1R and control sgRNAs on the indicated SCLC lines. n = 3. (D) Summary of proliferation assays following linisitinib treatment, showing the drug concentrations that cause a 50% suppression of cell growth (GI50) using CellTiter-Glo proliferation assays. (E) Expression of IGF1R and IGFBP5 in POU2F3high and POU2F3low SCLC patient sample RNA-seq data from George et al. (2015). Two-tailed t-test results comparing the RPKM (reads per kilobase per million mapped reads) values of POU2F3high and POU2F3low samples were as follows: for IGF1R, P = 0.0488, and for IGFBP5, P = 0.2525. The horizontal line is the mean. (F) Expression of IGF1R and IGFBP5 in POU2F3high and POU2F3low SCLC patient sample microarray data from Sato et al. (2013). Two-tailed t-test results comparing normalized MAS5 intensity value averages of all probes for each gene in POU2F3high and POU2F3low samples were as follows: for IGF1R, P = 0.042, and for IGFBP5, P = 0.0389. The horizontal line is the mean. (G) RNA-seq measurement of IGFBP5 expression (RPKM log10) in human SCLC cell lines. (H) IGFBP5 mRNA levels (RPKM) in the indicated cell lines following transduction with control (sgNeg) or POU2F3 sgRNA. (I) The effect of lentiviral expression of IGFBP5 on the relative proliferation rate of the indicated cell lines. Normalized relative luminescence unit (RLU) was measured using CellTiter-Glo after 2 d of culture of the indicated cells. n = 3. (**) P < 0.01; (N.S.) not significant. All bar graphs represent the mean ± SEM.
Figure 5.
Figure 5.
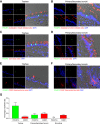
Rare POU2F3-expressing cells exist in the bronchial epithelium of the mouse lung. (AF) Representative images of immunofluorescence staining for POU2F3 (green), CGRP (a neuroendocrine cell marker; red), acetylated α-tubulin (a ciliated cell marker; red), and CC10 (a club cell marker; red) in the mouse trachea or primary/secondary bronchi. (G) Quantification of the percentage of cells in the epithelial layer of the trachea, primary/secondary bronchi, and bronchiole that stain for POU2F3 or CGRP. The mean ± SEM for four independent mice is plotted.

Similar articles

Cited by

References

    1. Andersen B, Weinberg WC, Rennekampff O, McEvilly RJ, Bermingham JR Jr, Hooshmand F, Vasilyev V, Hansbrough JF, Pittelkow MR, Yuspa SH, et al. 1997. Functions of the POU domain genes Skn-1a/i and Tst-1/Oct-6/SCIP in epidermal differentiation. Genes Dev 11: 1873–1884. - PubMed
    1. Augustyn A, Borromeo M, Wang T, Fujimoto J, Shao C, Dospoy PD, Lee V, Tan C, Sullivan JP, Larsen JE, et al. 2014. ASCL1 is a lineage oncogene providing therapeutic targets for high-grade neuroendocrine lung cancers. Proc Natl Acad Sci 111: 14788–14793. - PMC - PubMed
    1. Bader AG, Kang S, Vogt PK. 2006. Cancer-specific mutations in PIK3CA are oncogenic in vivo. Proc Natl Acad Sci 103: 1475–1479. - PMC - PubMed
    1. Barretina J, Caponigro G, Stransky N, Venkatesan K, Margolin AA, Kim S, Wilson CJ, Lehar J, Kryukov GV, Sonkin D, et al. 2012. The Cancer Cell Line Encyclopedia enables predictive modelling of anticancer drug sensitivity. Nature 483: 603–607. - PMC - PubMed
    1. Bezencon C, Furholz A, Raymond F, Mansourian R, Metairon S, Le Coutre J, Damak S. 2008. Murine intestinal cells expressing Trpm5 are mostly brush cells and express markers of neuronal and inflammatory cells. J Comp Neurol 509: 514–525. - PubMed

Publication types

MeSH terms

Substances