. 2018 Aug 6;217(8):2831-2849.
doi: 10.1083/jcb.201711104. Epub 2018 Jun 26.

Actin filaments partition primary cilia membranes into distinct fluid corrals

Affiliations

Actin filaments partition primary cilia membranes into distinct fluid corrals

Sungsu Lee et al. J Cell Biol. .

Abstract

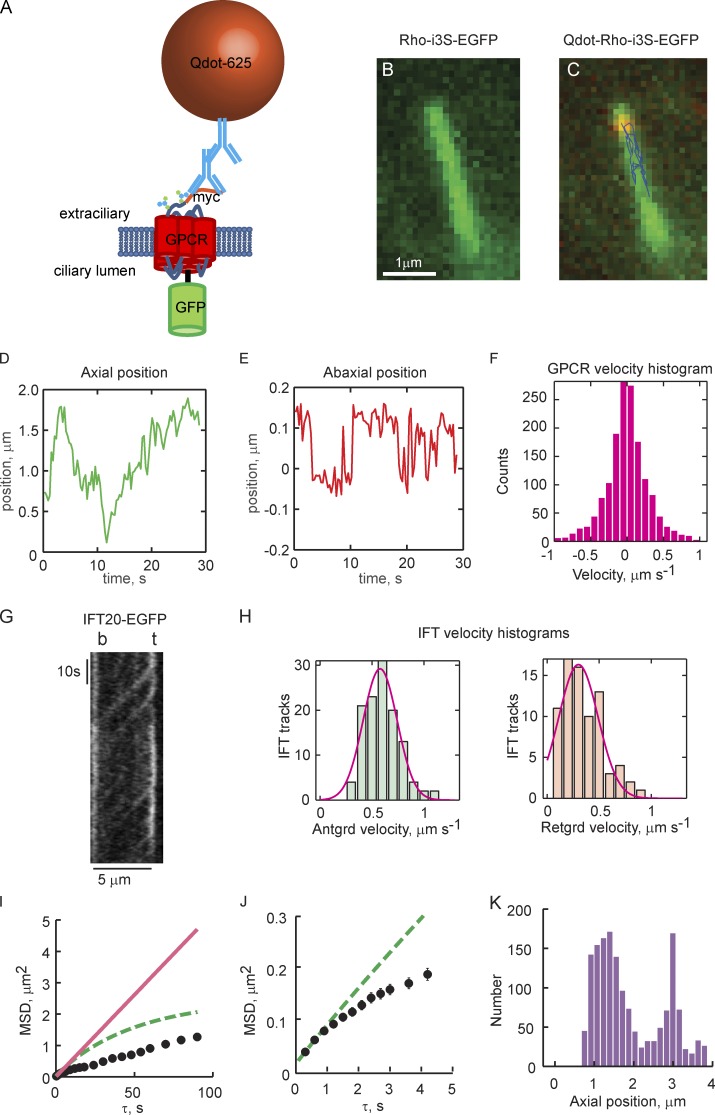
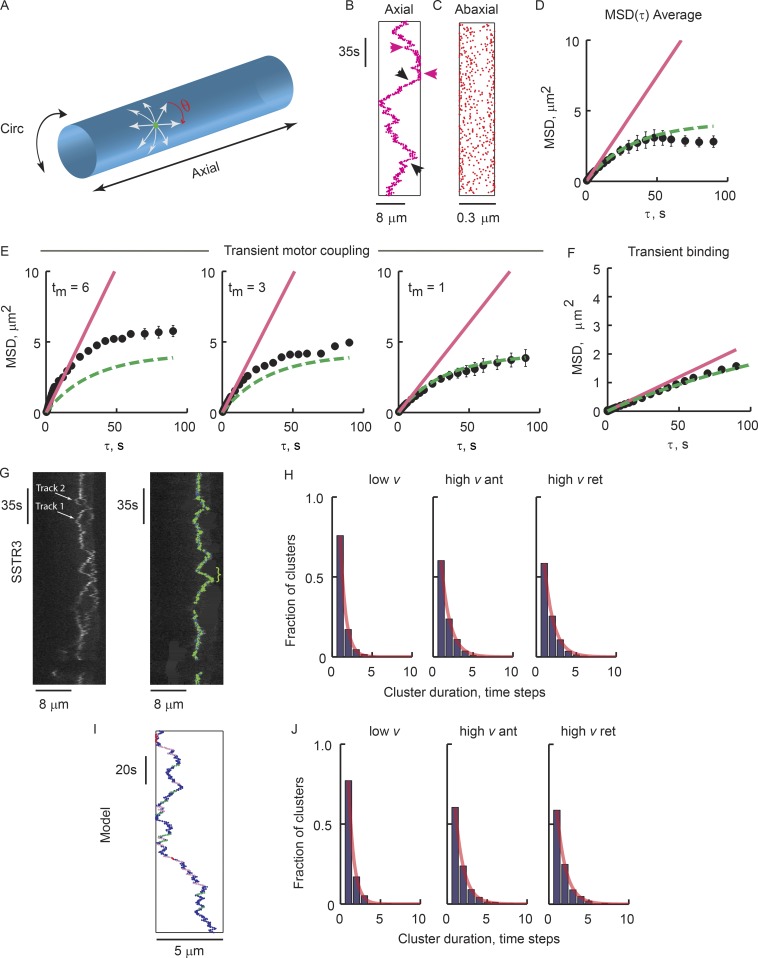
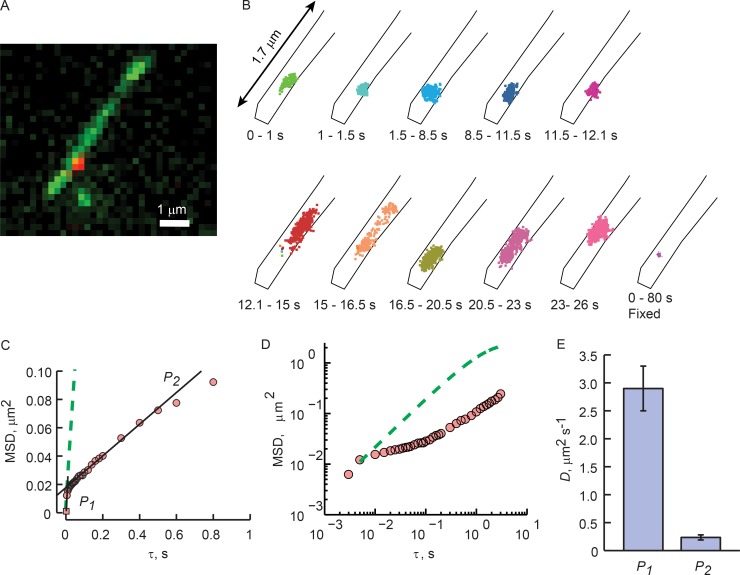
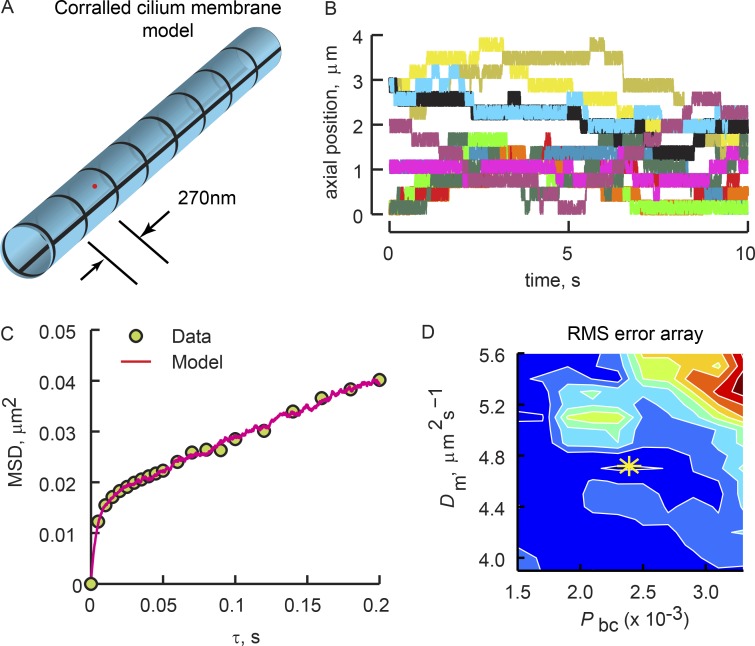
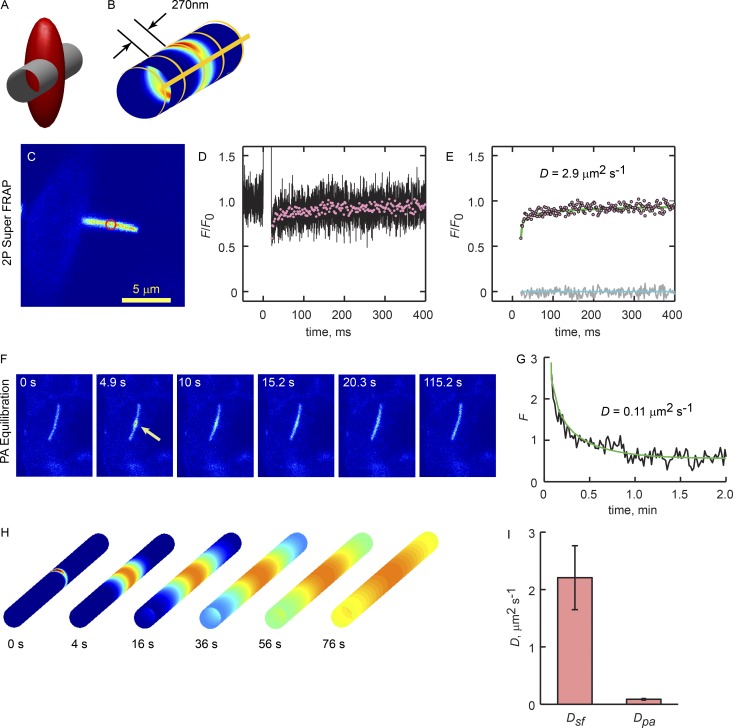
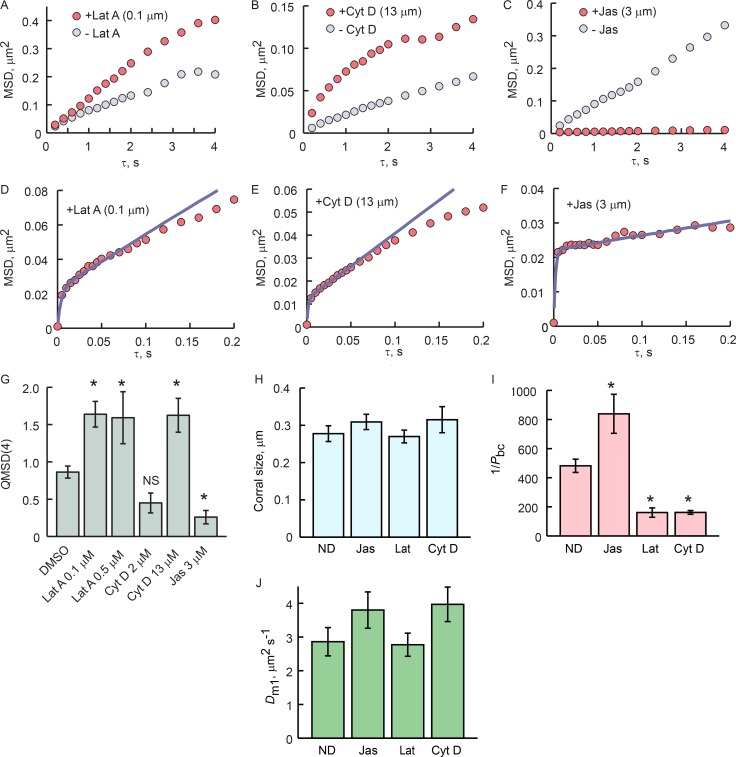
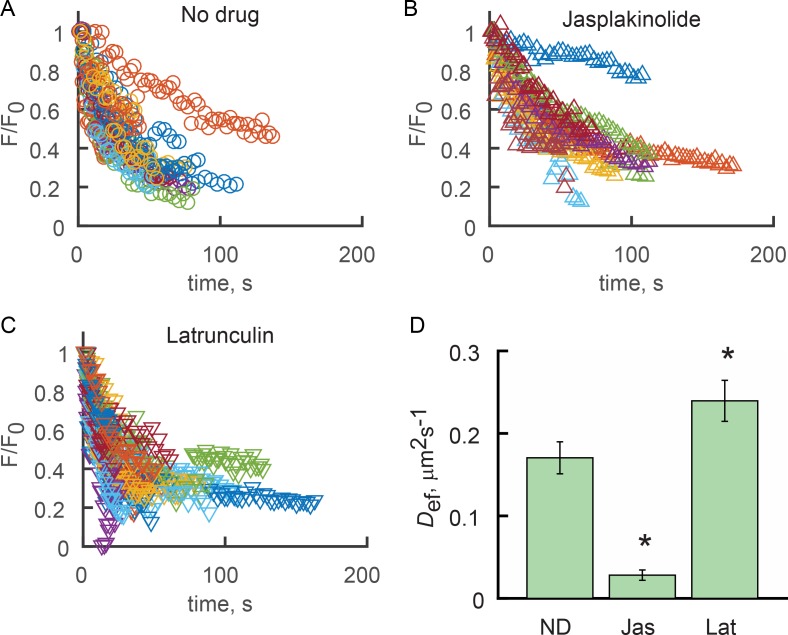
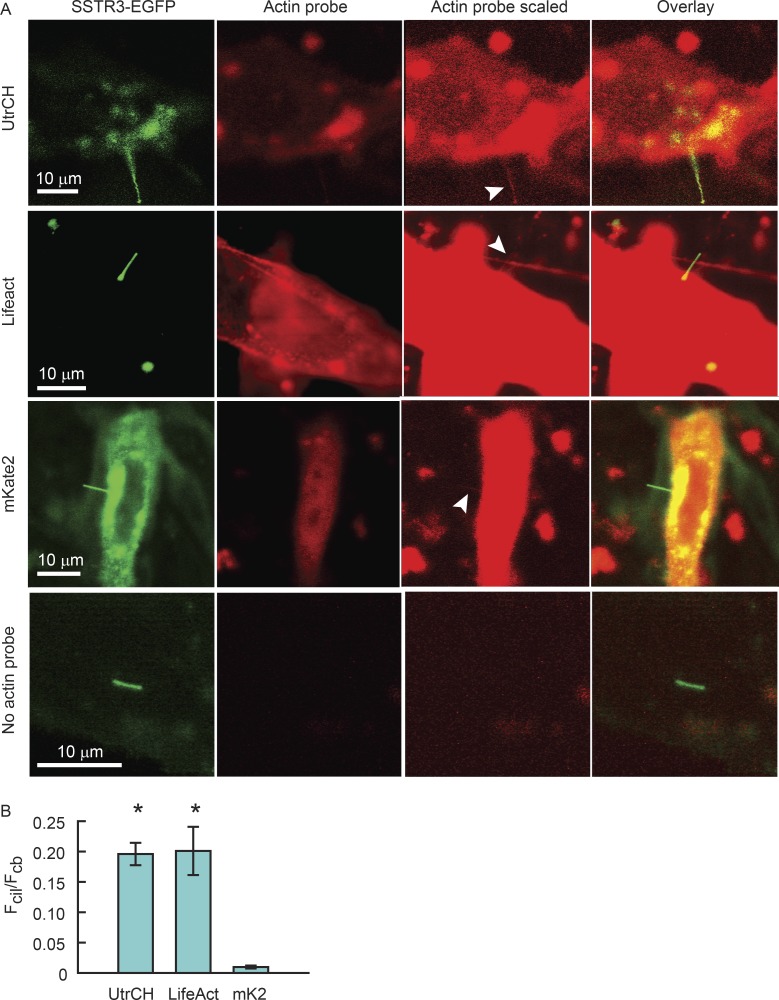
Physical properties of primary cilia membranes in living cells were examined using two independent, high-spatiotemporal-resolution approaches: fast tracking of single quantum dot-labeled G protein-coupled receptors and a novel two-photon super-resolution fluorescence recovery after photobleaching of protein ensemble. Both approaches demonstrated the cilium membrane to be partitioned into corralled domains spanning 274 ± 20 nm, within which the receptors are transiently confined for 0.71 ± 0.09 s. The mean membrane diffusion coefficient within the corrals, Dm1 = 2.9 ± 0.41 µm2/s, showed that the ciliary membranes were among the most fluid encountered. At longer times, the apparent membrane diffusion coefficient, Dm2 = 0.23 ± 0.05 µm2/s, showed that corral boundaries impeded receptor diffusion 13-fold. Mathematical simulations predict the probability of G protein-coupled receptors crossing corral boundaries to be 1 in 472. Remarkably, latrunculin A, cytochalasin D, and jasplakinolide treatments altered the corral permeability. Ciliary membranes are thus partitioned into highly fluid membrane nanodomains that are delimited by filamentous actin.


Figures

Figure 1.
Figure 1.
Superresolution tracking of single Qdot-labeled GPCRs reveals 2D transport on ciliary membranes that is distinct from IFT-based motor transport. (A) Schematic of the GPCR constructs used for single-molecule tracking and ensemble FRAP experiments. (B) Image of a cilium taken with the GFP channel shows uniform distribution of myc-Rhoi3S-EGFP. (C) Overlay of GFP and Qdot channels shown with tracking results from a single Qdot625-labeled myc-Rhoi3S-EGFP. Axial and circumferential movements (abaxial) are apparent (see Videos 1–4). (D) Axial position time course (kymograph) obtained from Qdot tracking. (E) Time course of movements perpendicular to the cilium axis. Zero in the ordinate indicates the center of mass of the cilium. (F) Instantaneous axial velocity histogram. Anterograde velocities are positive; retrograde are negative. Note the symmetry of the histogram, indicating that the distribution of velocities is the same in the anterograde and retrograde directions. (G) Representative IFT20-EGFP kymograph obtained under identical conditions (Video 5). Note smooth contiguous movement along the full length of the cilium. (H) Anterograde and retrograde IFT velocity histograms pooled from the slopes of 122 anterograde and 84 retrograde tracks from 14 cilia obtained from six independent experiments. Red lines, Gaussian fittings of the histograms. Anterograde, mean = 0.594, SD = 0.173 µm/s; retrograde, mean = 0.340, SD = 0.204 µm/s. (I and J) MSD analysis reveals significant subdiffusion of GPCRs within ciliary membranes. Black circles represent time-averaged MSDs of an individual Qdot-labeled GPCR plotted as a function of the time step size (τ). Error bars (SEM) are on the order of the size of the symbols; n > 1,000 for each τ. Red lines, linear fittings to MSD(τ = 0.3 and 0.6 s) from which apparent Dax was estimated; dashed lines, predicted MSD(τ) based on estimated Dax and Eq. 1. (J) MSD(τ) plot on expanded scale. (K) Axial position histogram for the individual GPCR tracking experiment. The length of a given cilium was divided into 20 bins into which axial positions were distributed. Zero on the abscissa represents the base of the cilium. In D–F and I–K, results are representative from one tracking experiment. Total number of Qdot-labeled myc-Rhoi3S-EGFP tracked = 9, on eight individual cilia, taken from four independent experiments (Table 1).
Figure 2.
Figure 2.
Simulated random walk on the cilium membrane recapitulates the patterns of axial GPCR movements. (A) Schematic of the cilium membrane. Green dot, a theoretical GPCR; θ, randomly generated angle that determines movement direction; arrows, a subset of possible trajectories; Circ, circumferential. (B–F) Simulation results with parameters found for the SSTR3 tracking shown in G: Dm = 0.15 µm2/s, lax = 8 µm, time step = 0.3 s (Video 6). (B) Axial position kymograph from a single simulation run. Red and black arrowheads indicate regions of low and high axial velocity, respectively. (C) 2D projection of the 3D circumferential positions from run in B show expected denser population of points at the edges. (D) Black symbols represent mean MSD(τ) of five runs; in each run, the MSD represents the mean of >1,000 squared displacements. Error bars = SEM. (E and F) Results from simulations including transient coupling to motors or stationary objects. In each plot, black circles represent the mean from five independent simulations with lax = 5 µm and Dm = 0.15 µm2/s. Straight lines connect the first two MSD(τ) points. Dashed lines are the Eq. 1 predictions. (E) Stochastic, transient coupling to an axial moving motor, where Pm = 0.2, vm = 0.6 µm/s, and coupling duration, tm, are indicated (Video 7). (F) Transient binding to immobile objects, where Pb = 0.2, tb = 10 time steps (Video 6). Note that with transient motor transport, MSD(τ) consistently exceeds the Eq. 1 prediction, whereas transient binding leads to an overall reduced slope. (G–J) Comparison of GPCR motion and pure random walk simulation shows similar frequencies of apparent processive motion and absence of motion. (G) Kymograph segment of an SSTR3 tracking experiment (Video 3). Left, raw kymograph showing two Qdot-labeled SSTR3s. Right, Track 2 was masked for track 1 analysis. Overlaid markers plot detected positions; colors indicate instantaneous velocity categories: blue, v < 0.2 µm/s, green, v ≥ 0.2 µm/s. (H) Frequency of sequential low-velocity clusters (low v), high-velocity clusters, anterograde (high v ant) or retrograde (high v ret), pooled from 14 tracked Qdot-labeled GPCRs obtained in eight independent experiments (Table 1). Lines are exponential fittings. (I) Axial positions from 180 s of a pure random walk simulation. Clusters of sequential displacements are color coded: low v, red; high v anterograde, purple; high v retrograde, green. (J) Velocity cluster histograms from five simulation runs. Lines as in H.
Figure 3.
Figure 3.
High-speed imaging reveals corralled GPCR diffusion. (A) A still from a Rhoi3S tracking experiment acquired at 200 fps. (B) Time sequence of the positions of the GPCR tracked in B during the indicated experimental time frame, shown on expanded scale. Black lines represent the boundaries of the cilium. The bottom right plot represents the positions of a Qdot-labeled Rhoi3S fixed with glutaraldehyde (Fig. S1). (C) MSD(τ) analysis (symbols). Black lines represent linear regressions of two plot phases: P1, the first two points; P2, τ = 0.1–0.5 s. The slope of P1 represents diffusion that is least impacted by corral confinement, and that of P2 represents diffusion that is substantially impeded by the corral boundaries. Green dashed line represents Eq. 1 prediction based on the diffusion coefficient estimated from the P1 slope. (D) Log–log plot of the results from E. Note that the Eq. 1 prediction is linear, whereas the tracking results have several phases. In A–D, results are representative from a single tracking experiment. (E) Mean diffusion coefficients computed from the slopes of the two phases. Error bars are SEM. n = 18 cells/18 individual cilia obtained in seven individual experiments (Table 2).
Figure 4.
Figure 4.
Fitting of corralled diffusion model to the high-speed tracking results reveals low probability of corral boundary crossing. (A) Schematic of the corralled ciliary membrane simulation (see Theory). (B) Kymographs from 12 separate runs of the corralled diffusion simulation that yielded the best fit of the particle tracking results from the experiment shown in Fig. 3. Note the large variation in corral residence time, Tr, resulting from the stochastic corral boundary crossings. See Table 2, cilium R9 for fitting parameters. (C) MSD(τ) plots of the high-speed tracking experiment from Fig. 3 (symbols) and the simulation that provided the best fit (red line). (D) Array of the RMSE between the model and tracking data. White lines are iso-error lines. Colors are heat maps depicting relative regional error, where red is larger and dark blue is smaller error. The yellow asterisk shows the minimal error, found as the centroid of the smallest iso-error line, indicating the values of Dm and Pbc producing the best fit of the data.
Figure 5.
Figure 5.
2P Super FRAP verifies Qdot tracking results. (A) Schematic showing the geometries of a 300-nm-diameter cilium membrane and the psf of the Ti:S laser focused to the diffraction limit by the 1.2-NA water-immersion objective. The red ellipsoid is an iso-intensity surface representing the psf at 1/e Imax (Imax being at the center of the ellipsoid). (B) Heat map of the relative psf intensity at the ciliary membrane, and thus the pattern of photoconverted GPCRs produced by a brief laser pulse. Yellow lines show the pattern of corral boundaries used in the ensemble diffusion model (see Theory). (C) Confocal image of an SSTR3-EGFP cilium used in a 2P Super FRAP experiment. Red circle indicates the bleach position. (D) Mean of 25 bleach-recovery curves acquired at 200 kHz (black line). A 10-ms bleach pulse began at time 0. Red symbols represent 10-fold downsampled recovery phase (decimation). (E) Fitted ensemble diffusion model (line) and error residuals (gray line). Lower green line is 0. Best fit was determined by varying Dm and finding the minimum RMSE, as described in Calvert et al. (2007), Materials and methods. (F) Time image series of SSTR3-PAGFP equilibration. PAGFP was photoconverted by a 10-ms exposure from the Ti:S laser tuned to 820 nm (Calvert et al., 2007). Equilibration was monitored with serial 1P confocal scans (488 nm, 1.31 s/frame) at a single z plane. (G) Time course of PAGFP relaxation from the photoconversion site (black trace). Smooth green line is the best fit of the ensemble diffusion model where Dm = 0.11 µm2/s. (H) Time series images of the ensemble diffusion model where the source at time 0 represents the distribution of photoconverted molecules after a brief 2P laser exposure. Circumferential corral boundaries were present in the model membrane every 270 nm along the axis, as shown in B. (I) Mean membrane diffusion coefficients obtained with 2P Super FRAP, Dsf, and long-term equilibration by PAGFP FRAPa, Dpa. Error bars are SEM. Mean diffusion coefficients were significantly different, P < 0.05, as determined from pairwise t test. 2P Super FRAP n = 7 cilia obtained from three independent experiments. PAGFP FRAPa n = 8 cilia obtained from five independent experiments.
Figure 6.
Figure 6.
Actin filament–disrupting drugs impact cilia membrane corral permeability. (A–C) MSD(τ) plots from 5 Hz GPCR-tracking experiments with and without F-actin–perturbing drugs. GPCRs were tracked for 5 min without drug, incubated with drug for 10 min, and tracked again for 5 min. Similar experiments were performed with DMSO alone. Quotients of MSD(τ = 4) before and after treatment (QMSD(4)) are shown in G. (D–F) 200-Hz tracking and fitting with corralled diffusion model with drug showed that F-actin perturbation altered the permeability of the corral boundaries but had no effect on the size of the corrals or Dm1. Note different scaling of ordinates. (H) Mean sizes of the corrals measured were not significantly different. (I) Inverse mean probability of boundary crossing, 1/Pbc. 1/Pbc is a measure of the number of times a GPCR encounters a boundary before it manages to cross. (J) The mean corral diffusion coefficients in each condition are not statistically different. (G–J) ND, no drug (vehicle control). Error bars are SEM. (G and I) Asterisks denote significant difference from DMSO at P < 0.05 (G) or P < 0.01 (I), as determined by ANOVA and Bonferroni post hoc analysis. In A–C and G, latrunculin A 0.1 µM, n = 7; five independent experiments; latrunculin A 0.5 µM, n = 11; six independent experiments; cytochalasin D 13 µM, n = 14, nine independent experiments; cytochalasin D 2 µM, n = 11; six independent experiments; DMSO controls, n = 6; two independent experiments. In D–F and H–J, ND, n = 18, seven independent experiments; jasplakinolide, n = 7; two independent experiments; latrunculin A n = 11, six independent experiments; cytochalasin D, n = 7, two independent experiments.
Figure 7.
Figure 7.
F-actin–perturbing drugs alter the ensemble longitudinal diffusion of SSTR3 in the absence of Q-dot labeling. (A–C) 2P FRAPa experiments were performed as described in Fig. 5 (F and G), where SSTR3-PAGFP was photoconverted with 100-µs pulses of the Ti:S laser tuned to 850 nm. Groups of fluorescence relaxation curves obtained for cilia treated with vehicle (A), 3 µM jasplakinilode (B), or 0.1 µM latrunculin A (C) show that jasplakinolide treatment slows, whereas latrunculin treatment accelerates, relaxation. Each relaxation curve was fitted with the cilium surface ensemble diffusion model to obtain effective diffusion coefficients (Def). (D) Mean Def for each condition. ND, no drug (vehicle control). Error bars are SEM. Asterisks indicate significant differences from ND (P < 0.01) as determined by ANOVA with Bonferroni post hoc analysis. ND, n = 19 cilia; seven independent experiments; jasplakinolide, n = 17, three independent experiments; latrunculin A, n = 26; three independent experiments.
Figure 8.
Figure 8.
F-actin is present within IMCD3 cilia at low levels. (A) IMCD3 cells were transfected with plasmids expressing SSTR3-EGFP and UtrCH-RFP, Lifeact-mCherry, or unfused mKate2, and ciliogenesis was initiated by serum starvation. Cells were imaged live by confocal microscopy using identical microscope settings, where green and red channels were not saturated (actin probe). To visualize actin probe signal within cilia, the red channel was scaled arbitrarily after acquisition (actin probe scaled). This scaling did not affect actual pixel counts. White arrowheads indicate red fluorescent signal within the cilia. All three species of red fluorescent proteins were found in cilia, including the unfused mKate2, showing that soluble fluorescent proteins expressed in the cell have access to the ciliary compartment. Actin probe panels displayed at optimal intensity scaling, showing that images were acquired without saturation. Actin probe scaled panels were intensity scaled to reveal cilium signal. (B) Mean ± SEM. Fcil/Fcb ratios. Asterisks indicate significant differences compared with unfused mKate2. UtrCH, n = 9; one independent experiment; Lifeact, n = 22; five independent experiments; unfused mKate2, n = 7; two independent experiments, no probe, n = 5; one independent experiment.

References

    1. Axelrod D., Koppel D.E., Schlessinger J., Elson E., and Webb W.W.. 1976a Mobility measurement by analysis of fluorescence photobleaching recovery kinetics. Biophys. J. 16:1055–1069. 10.1016/S0006-3495(76)85755-4 - DOI - PMC - PubMed
    1. Axelrod D., Ravdin P., Koppel D.E., Schlessinger J., Webb W.W., Elson E.L., and Podleski T.R.. 1976b Lateral motion of fluorescently labeled acetylcholine receptors in membranes of developing muscle fibers. Proc. Natl. Acad. Sci. USA. 73:4594–4598. 10.1073/pnas.73.12.4594 - DOI - PMC - PubMed
    1. Banks D.S., and Fradin C.. 2005. Anomalous diffusion of proteins due to molecular crowding. Biophys. J. 89:2960–2971. 10.1529/biophysj.104.051078 - DOI - PMC - PubMed
    1. Blacque O.E., and Sanders A.A.W.M.. 2014. Compartments within a compartment: What C. elegans can tell us about ciliary subdomain composition, biogenesis, function, and disease. Organogenesis. 10:126–137. 10.4161/org.28830 - DOI - PMC - PubMed
    1. Bouchaud J.-P., and Georges A.. 1990. Anomalous diffusion in disordered media: Statistical mechanisms, models and physical applications. Phys. Rep. 195:127–293. 10.1016/0370-1573(90)90099-N - DOI

Publication types