. 2018 Sep 3;217(9):3255-3266.
doi: 10.1083/jcb.201703196. Epub 2018 Jun 26.

Actin polymerization controls cilia-mediated signaling

Affiliations

Actin polymerization controls cilia-mediated signaling

Michael L Drummond et al. J Cell Biol. .

Abstract

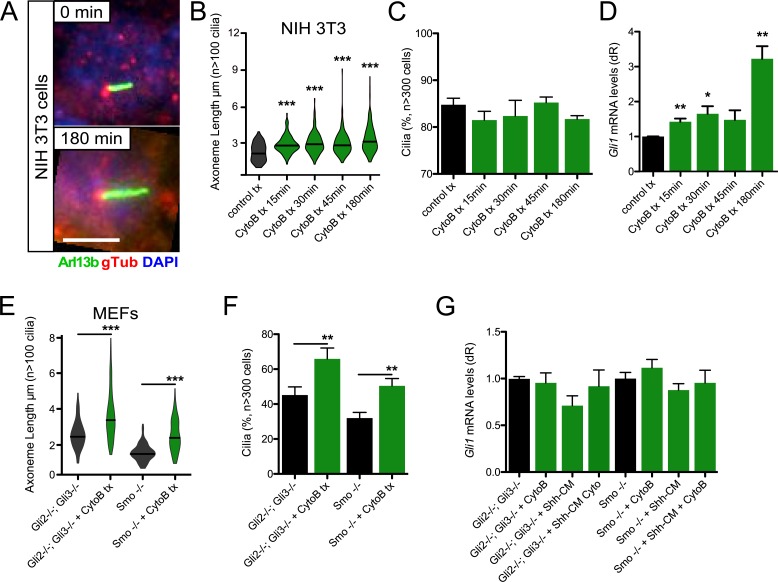
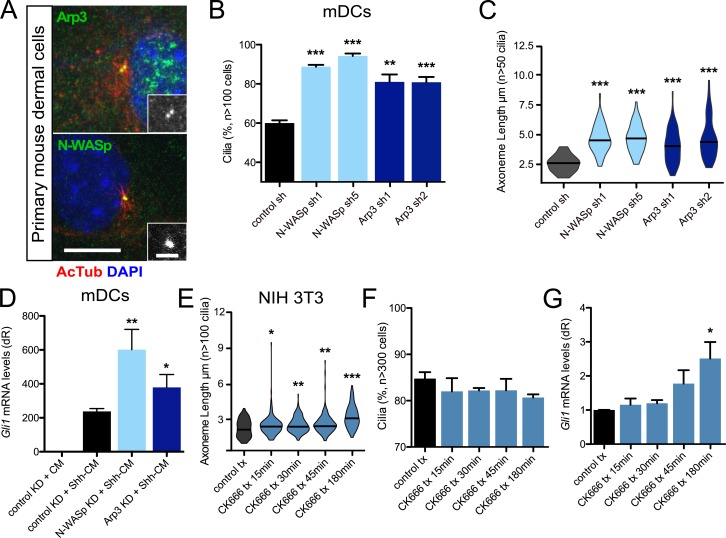
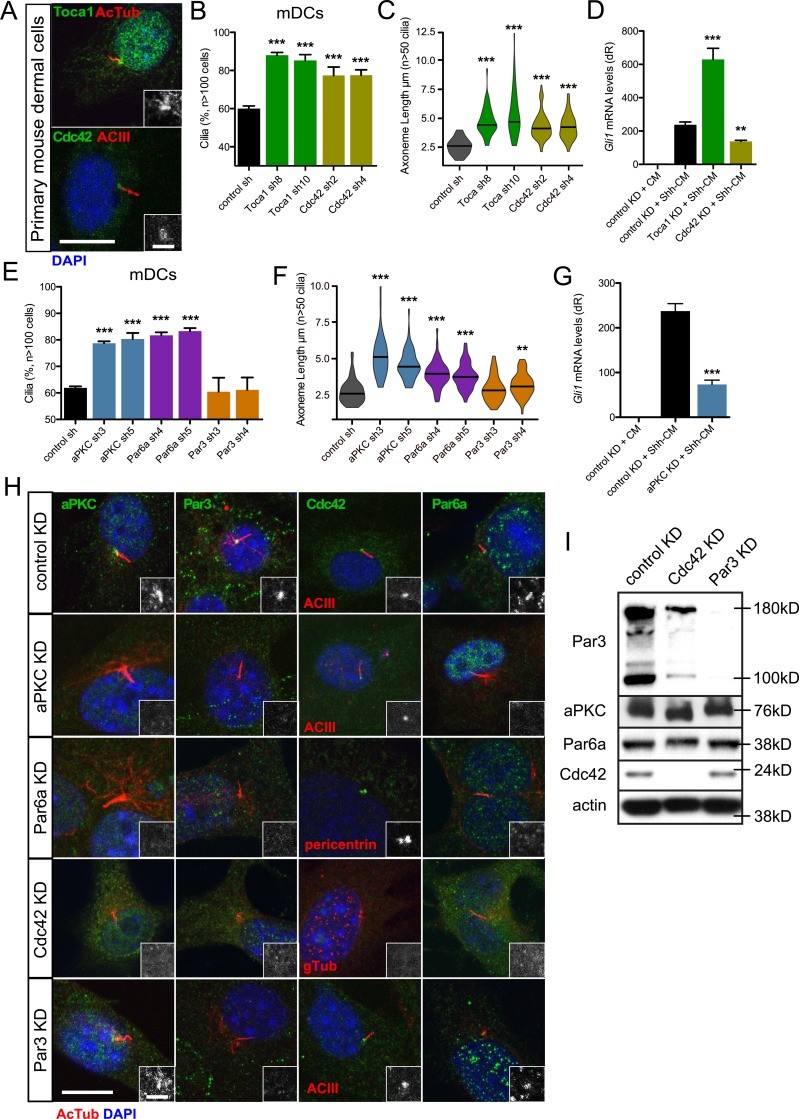
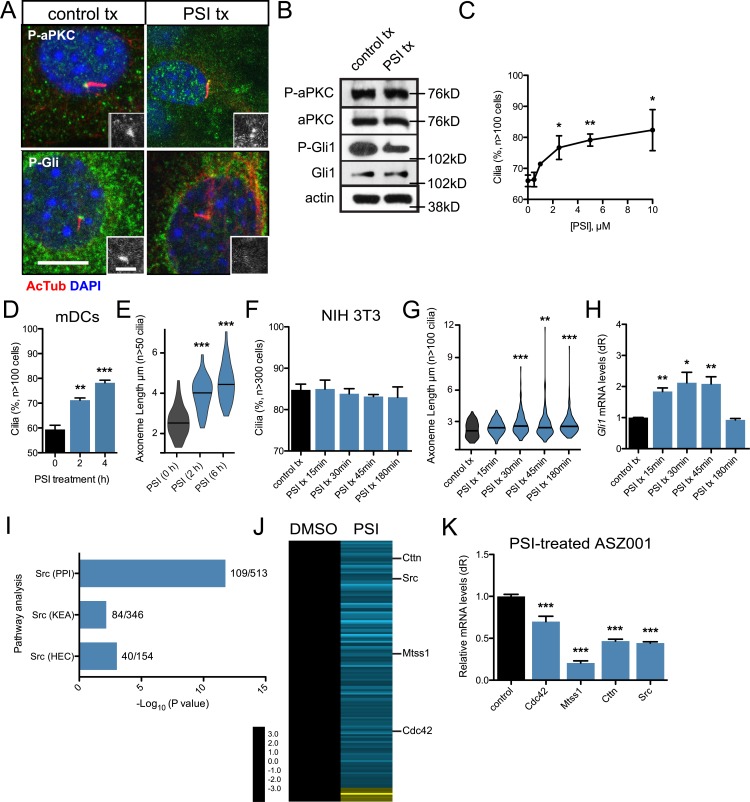
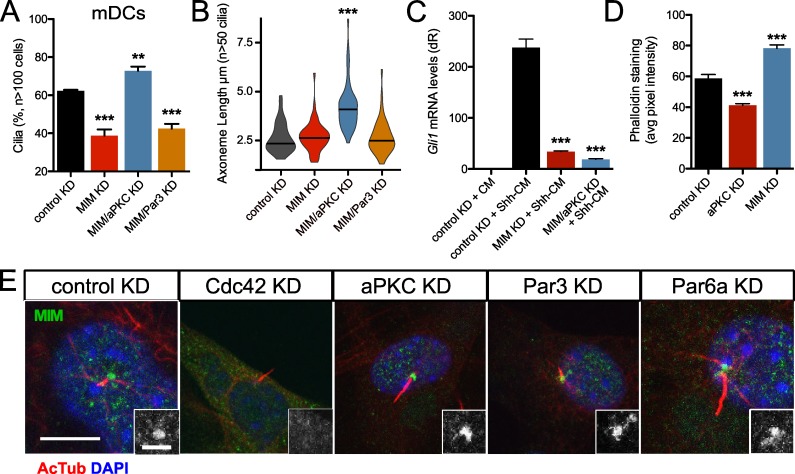
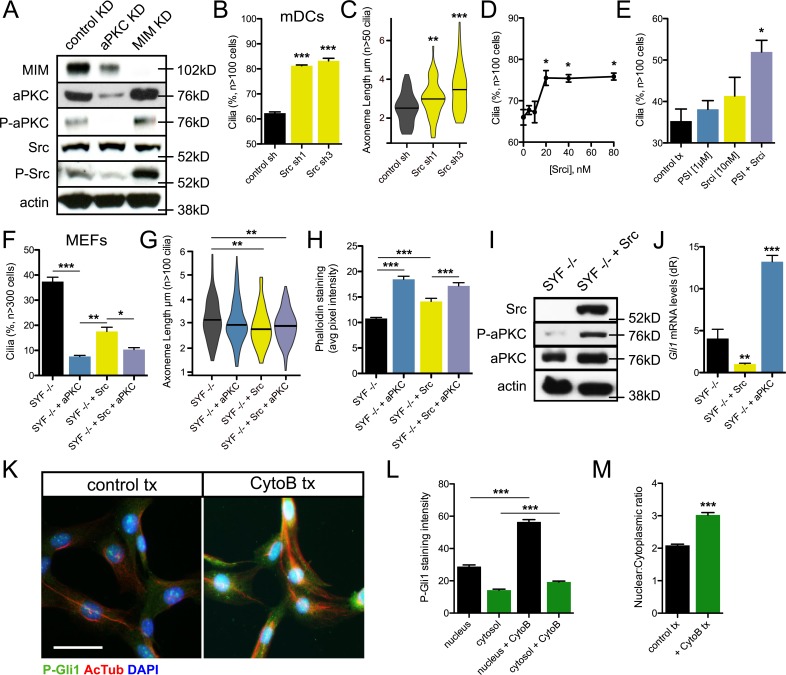
Primary cilia are polarized organelles that allow detection of extracellular signals such as Hedgehog (Hh). How the cytoskeleton supporting the cilium generates and maintains a structure that finely tunes cellular response remains unclear. Here, we find that regulation of actin polymerization controls primary cilia and Hh signaling. Disrupting actin polymerization, or knockdown of N-WASp/Arp3, increases ciliation frequency, axoneme length, and Hh signaling. Cdc42, a potent actin regulator, recruits both atypical protein pinase C iota/lambda (aPKC) and Missing-in-Metastasis (MIM) to the basal body to maintain actin polymerization and restrict axoneme length. Transcriptome analysis implicates the Src pathway as a major aPKC effector. aPKC promotes whereas MIM antagonizes Src activity to maintain proper levels of primary cilia, actin polymerization, and Hh signaling. Hh pathway activation requires Smoothened-, Gli-, and Gli1-specific activation by aPKC. Surprisingly, longer axonemes can amplify Hh signaling, except when aPKC is disrupted, reinforcing the importance of the Cdc42-aPKC-Gli axis in actin-dependent regulation of primary cilia signaling.


Figures

Figure 1.
Figure 1.
Cytochalasin B induces axoneme length changes to regulate Hh signaling. (A) Immunofluorescence of NIH 3T3 cells treated with or without 10 µM cytochalasin B (CytoB) for the indicated times and stained for Arl13b, γ-tubulin (gTub), and DNA (DAPI). Bar, 5 µm. (B and C) Violin plot of axoneme lengths from confluent NIH 3T3 cells (B) and percentage of cells displaying primary cilia (C) after treatment with 10 µM CytoB for the indicated amounts of time (n = 3 experiments). tx, treatment. (D) Gli1 mRNA levels of confluent NIH 3T3 cells treated with Shh-CM and 10 µM CytoB for the indicated amounts of time (n = 3 experiments). dR, delta reporter signal normalized to passive reference dye. (E and F) Violin plot of axoneme lengths from subconfluent Gli2−/−; Gli3−/− and Smo−/− MEFs (E) and percentage of cells displaying primary cilia (F) after 3-h treatment with 10 µM CytoB (n = 3 experiments). (G) Gli1 mRNA levels of Gli2−/−; Gli3−/− and Smo−/− MEFs treated with or without Shh-CM and/or 3 h of 10 µM CytoB (n = 3 experiments). CM, conditioned media. Error bars represent SEM. Significance was determined by unpaired two-tailed t test (*, P < 0.05; **, P < 0.01; ***, P < 0.001).
Figure 2.
Figure 2.
Actin nucleators restrict axoneme length and Hh signaling. (A) Immunofluorescence of mDCs stained for Arp3 or N-WASp with acetylated-tubulin (AcTub)–positive primary cilia. Immunoreactivity around the basal body is highlighted in the lower right of each panel. Bars: 10 µm; (inset) 2 µm. (B and C) Percentage of subconfluent mDCs displaying primary cilia (B) and violin plot of axoneme lengths (C) after shRNA knockdown of control (n = 4 experiments), N-WASp (n = 3 experiments), or Arp3 (n = 4 experiments). sh, short hairpin. (D) Gli1 mRNA levels of confluent mDCs after shRNA knockdown of control (n = 9 experiments), N-WASp (n = 5 experiments), or Arp3 (n = 3 experiments) and treated with control-conditioned media or Shh-CM. CM, conditioned media; KD, knockdown. dR, delta reporter signal normalized to passive reference dye. (E and F) Violin plot of axoneme lengths from confluent NIH 3T3 cells (E) and percentage of cells displaying primary cilia (F) after treatment with 20 µM CK666 for the indicated amounts of time (n = 3 experiments). tx, treatment. (G) Gli1 mRNA levels of confluent NIH 3T3 cells treated with Shh-CM and 20 µM CK666 for the indicated amounts of time (n = 3 experiments). Error bars represent SEM. Significance determined by unpaired two-tailed t test (*, P < 0.05; **, P < 0.01; ***, P < 0.001).
Figure 3.
Figure 3.
Cdc42 regulates primary cilia and Hh signaling by recruiting aPKC–Par6a to the basal body. (A) Immunofluorescence of mDCs stained for Toca1 or Cdc42 with acetylated-tubulin (AcTub) – or adenyl cyclase III (ACIII)–positive primary cilia. Immunoreactivity around the basal body is highlighted in the lower right of each panel. Bars: 10 µm; (inset) 2 µm. (B and C) Percentage of subconfluent mDCs displaying primary cilia (B) and violin plot of axoneme lengths (C) after shRNA knockdown of control (n = 4 experiments), Toca1 (n = 3 experiments), or Cdc42 (n = 4 experiments). sh, short hairpin. (D) Gli1 mRNA levels of confluent mDCs after shRNA knockdown of control (n = 9 experiments), Toca1 (n = 2 experiments), or Cdc42 (n = 3 experiments) and treated with control-conditioned media or Shh-CM. CM, conditioned media. dR, delta reporter signal normalized to passive reference dye. (E and F) Percentage of subconfluent mDCs displaying primary cilia (E) and violin plot of axoneme lengths (F) after shRNA knockdown of control (n = 4 experiments), aPKC (n = 4 experiments), Par6a (n = 4 experiments), or Par3 (n = 4 experiments). sh, short hairpin. (G) Gli1 mRNA levels of confluent mDCs after shRNA knockdown of control (n = 9 experiments) or aPKC (n = 6 experiments) and treated with control-conditioned media or Shh-CM. KD, knockdown. Error bars represent SEM. Significance determined by unpaired two-tailed t test (**, P < 0.01; ***, P < 0.001). (H) Immunofluorescence of control, aPKC, Par6a, Cdc42, or Par3 knockdown mDCs stained for indicated proteins and AcTub/ACIII–positive primary cilia or pericentrin/γ-tubulin (gtub)–positive basal bodies. Immunoreactivity around the basal body is highlighted in the lower right of each panel. Bars: 10 µm; (inset) 2 µm. (I) Western blot of control, Cdc42, or Par3 knockdown mDCs that are probed for polarity proteins and actin.
Figure 4.
Figure 4.
aPKC activity is necessary to regulate primary cilia frequency and axoneme length. (A) Immunofluorescence of control-treated or 10 µM PSI–treated mDCs stained for phosphorylated aPKC (P-aPKC), phosphorylated Gli1 (P-Gli), and primary cilia (AcTub). Immunoreactivity around the basal body is highlighted in the lower right of each panel. tx, treatment. Bars: 10 µm; (inset) 2 µm. (B) Western blot of control or PSI-treated mDCs that are probed for aPKC, P-aPKC, Gli1, P-Gli1, and actin. (C and D) Percentage of subconfluent mDCs with primary cilia upon dose-dependent (C; n = 2 experiments) or temporal addition of 10 µM PSI (D; n = 3 experiments). (E) Violin plot of axoneme length upon temporal addition of 10 µM PSI. (F and G) Percentage of cells displaying primary cilia (F) and violin plot of axoneme lengths (G) from confluent NIH 3T3 cells after treatment with 10 µM PSI for the indicated amounts of time (n = 3 experiments). (H) Gli1 mRNA levels of confluent NIH 3T3 cells treated with Shh-CM and 10 µM PSI for the indicated amounts of time (n = 3 experiments). dR, delta reporter signal normalized to passive reference dye. (I) Pathway analysis of down-regulated transcripts in PSI-treated ASZ001 cells compared with DMSO control. Number of genes in dataset compared with total number of genes displayed as a fraction to the right of each bar. KEA, kinase enrichment analysis; PPI, protein–protein interaction database. Human endogenous complexome, HEC. (J) Heat map of significantly changed transcripts in the Src pathway in PSI-treated ASZ001 cells compared with DMSO control. (K) Quantitative reverse-transcription PCR validation of selected components of the Src pathway in PSI-treated ASZ001 cells compared with DMSO control (n = 3 experiments). Error bars represent SEM. Significance determined by unpaired two-tailed t test (*, P < 0.05; **, P < 0.01; ***, P < 0.001).
Figure 5.
Figure 5.
aPKC antagonizes MIM downstream of Cdc42. (A and B) Percentage of subconfluent mDCs displaying primary cilia (A) and violin plot of axoneme length (B) after shRNA knockdown (KD) of control (n = 4 experiments), MIM (n = 7 experiments), aPKC and MIM (n = 7 experiments), or Par3 and MIM (n = 3 experiments). (C) Gli1 mRNA levels of confluent mDCs after shRNA knockdown of control (n = 9 experiments), MIM (n = 3 experiments), or aPKC and MIM (n = 3 experiments) and treated with control-conditioned media or Shh-CM. CM, conditioned media. dR, delta reporter signal normalized to passive reference dye. (D) Phalloidin staining quantification of subconfluent mDCs after shRNA knockdown of control, aPKC, or MIM (n > 50 cells). Error bars represent SEM. Significance was determined by unpaired two-tailed t test (**, P < 0.01; ***, P < 0.001). (E) Immunofluorescence of control, aPKC, Par6a, Cdc42, or Par3 knockdown mDCs stained for MIM and acetylated-tubulin (AcTub)–positive primary cilia. MIM staining around the basal body is highlighted in the lower right of each panel. Bars: 10 µm; (inset) 2 µm.
Figure 6.
Figure 6.
aPKC and Src positively regulate each other to promote Gli1 activity. (A) Western blot of control, aPKC, or MIM knockdown mDCs that are probed for MIM, total and activated forms of aPKC and Src, and actin. (B and C) Percentage of subconfluent mDCs displaying primary cilia (B) and violin plot of axoneme length (C) after shRNA knockdown of control (n = 2 experiments) or Src (n = 2 experiments for each short hairpin). (D) Percentage of mDCs with primary cilia upon dose-dependent addition of Src inhibitor I (Srci; n = 2 experiments). (E) Percentage of subconfluent mDCs with primary cilia in control treatment (tx) or subthreshold concentrations of PSI, Srci, or both (n = 3 experiments). (F–H) Percentage of cells displaying primary cilia (F), violin plot of axoneme lengths (G), and phalloidin staining quantification (H; n > 100 cells) from subconfluent Src/Fyn/Yes (SYF)−/− MEFs with or without stable transfection of aPKC and/or Src (n = 3 experiments). (I) Western blot of SYF−/− MEFs with or without addition of Src and probed for total and activated forms of aPKC and total Src. (J) Gli1 mRNA levels of SYF−/− MEFs with or without addition of Src or aPKC (n = 4 experiments). dR, delta reporter signal normalized to passive reference dye. (K) Immunofluorescence of NIH 3T3 cells treated with or without 2.5 µM cytochalasin B (CytoB) for 3 h and stained for the indicated proteins. Bar, 30 µm. (L and M) Quantification (L) and nuclear-to-cytoplasmic ratio (M) of the aPKC-specific phosphorylated-Gli1 immunostain (n > 100 cells). Error bars represent SEM. Significance was determined by unpaired two-tailed t test (*, P < 0.05; **, P < 0.01; ***, P < 0.001).

Similar articles

Cited by

References

    1. Antoniades I., Stylianou P., and Skourides P.A.. 2014. Making the connection: ciliary adhesion complexes anchor basal bodies to the actin cytoskeleton. Dev. Cell. 28:70–80. 10.1016/j.devcel.2013.12.003 - DOI - PubMed
    1. Atwood S.X., Chabu C., Penkert R.R., Doe C.Q., and Prehoda K.E.. 2007. Cdc42 acts downstream of Bazooka to regulate neuroblast polarity through Par-6 aPKC. J. Cell Sci. 120:3200–3206. 10.1242/jcs.014902 - DOI - PMC - PubMed
    1. Atwood S.X., Chang A.L.S., and Oro A.E.. 2012. Hedgehog pathway inhibition and the race against tumor evolution. J. Cell Biol. 199:193–197. 10.1083/jcb.201207140 - DOI - PMC - PubMed
    1. Atwood S.X., Li M., Lee A., Tang J.Y., and Oro A.E.. 2013. GLI activation by atypical protein kinase C ι/λ regulates the growth of basal cell carcinomas. Nature. 494:484–488. 10.1038/nature11889 - DOI - PMC - PubMed
    1. Avasthi P., and Marshall W.F.. 2012. Stages of ciliogenesis and regulation of ciliary length. Differentiation. 83:S30–S42. 10.1016/j.diff.2011.11.015 - DOI - PMC - PubMed

Publication types

MeSH terms