. 2018 Jun 26;7(13):e009244.
doi: 10.1161/JAHA.118.009244.

Inhibition of MicroRNA-155 Supports Endothelial Tight Junction Integrity Following Oxygen-Glucose Deprivation

Affiliations

Inhibition of MicroRNA-155 Supports Endothelial Tight Junction Integrity Following Oxygen-Glucose Deprivation

Juan Carlos Pena-Philippides et al. J Am Heart Assoc. .

Abstract

Background: Brain microvascular endothelial cells form a highly selective blood brain barrier regulated by the endothelial tight junctions. Cerebral ischemia selectively targets tight junction protein complexes, which leads to significant damage to cerebral microvasculature. Short noncoding molecules called microRNAs are implicated in the regulation of various pathological states, including endothelial barrier dysfunction. In the present study, we investigated the influence of microRNA-155 (miR-155) on the barrier characteristics of human primary brain microvascular endothelial cells (HBMECs).

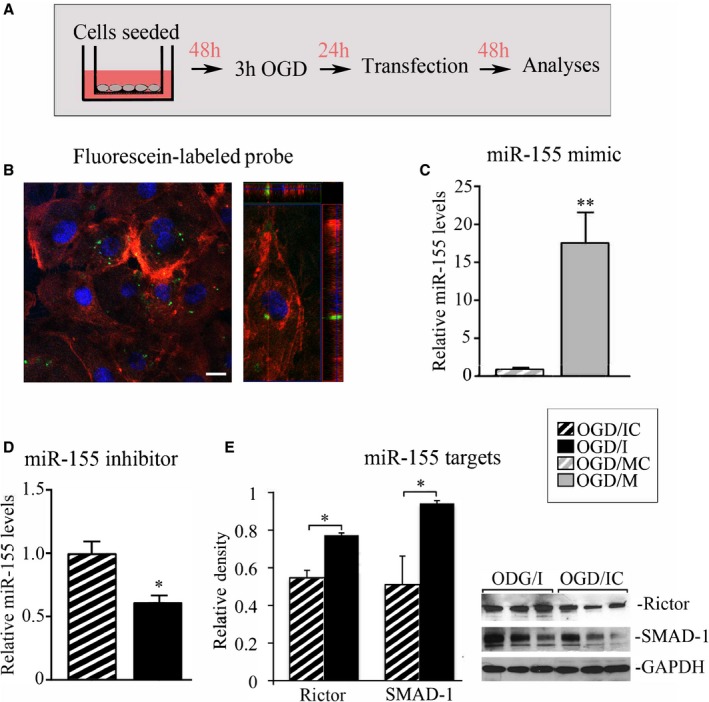
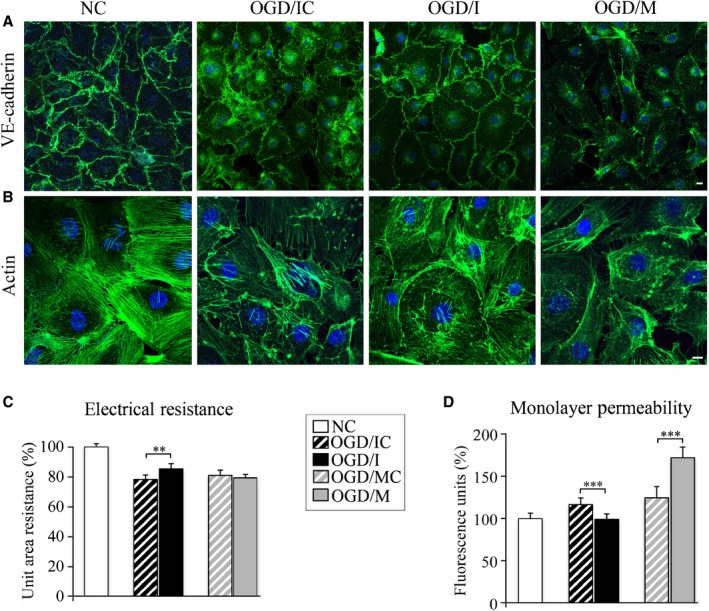
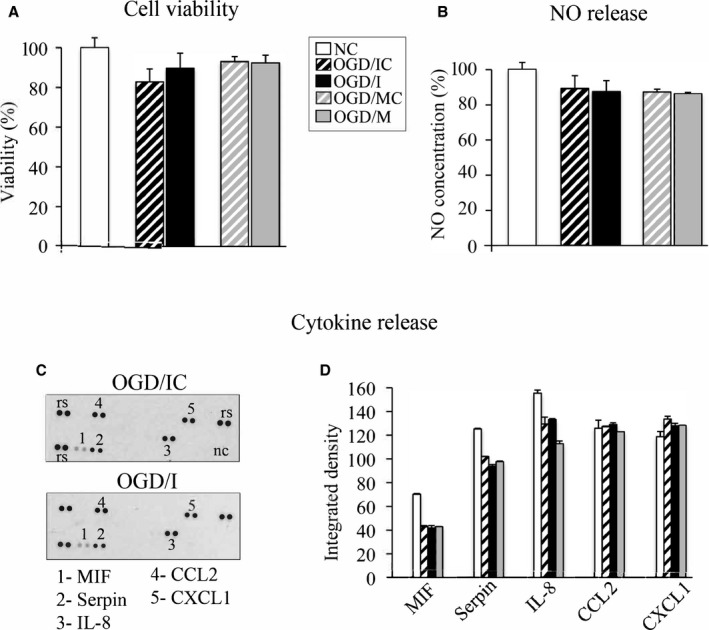
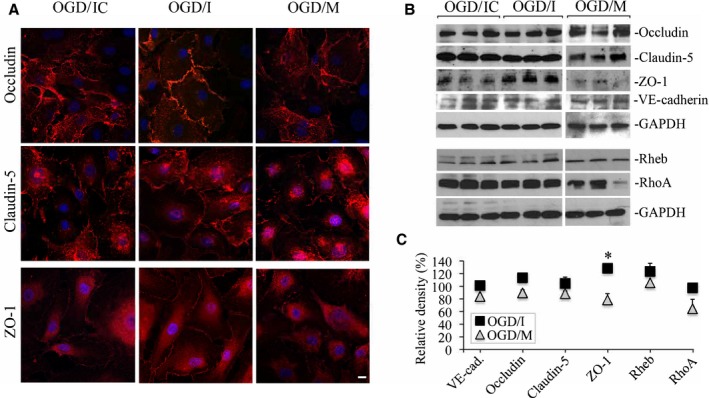
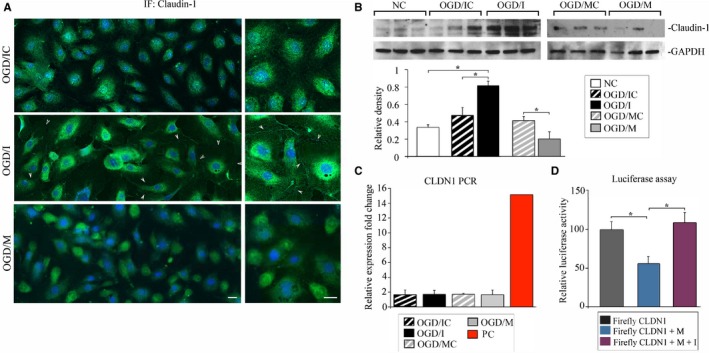
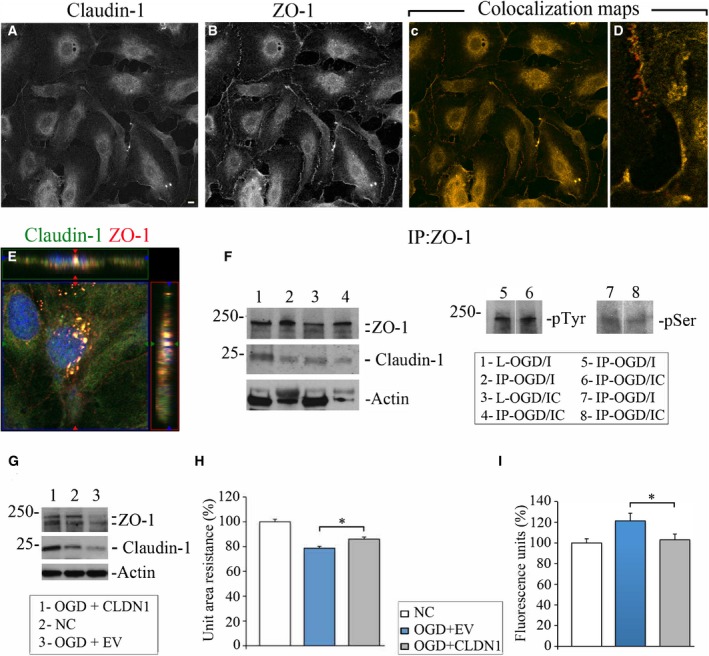
Methods and results: Oxygen-glucose deprivation was used as an in vitro model of ischemic stroke. HBMECs were subjected to 3 hours of oxygen-glucose deprivation, followed by transfections with miR-155 inhibitor, mimic, or appropriate control oligonucleotides. Intact normoxia control HBMECs and 4 oxygen-glucose deprivation-treated groups of cells transfected with appropriate nucleotide were subjected to endothelial monolayer electrical resistance and permeability assays, cell viability assay, assessment of NO and human cytokine/chemokine release, immunofluorescence microscopy, Western blot, and polymerase chain reaction analyses. Assessment of endothelial resistance and permeability demonstrated that miR-155 inhibition improved HBMECs monolayer integrity. In addition, miR-155 inhibition significantly increased the levels of major tight junction proteins claudin-1 and zonula occludens protein-1, while its overexpression reduced these levels. Immunoprecipitation and colocalization analyses detected that miR-155 inhibition supported the association between zonula occludens protein-1 and claudin-1 and their stabilization at the HBMEC membrane. Luciferase reporter assay verified that claudin-1 is directly targeted by miR-155.

Conclusions: Based on these results, we conclude that miR-155 inhibition-induced strengthening of endothelial tight junctions after oxygen-glucose deprivation is mediated via its direct target protein claudin-1.

Keywords: brain microvascular endothelial cells; endothelial barrier; microRNA; oxygen‐glucose deprivation; tight junctions.


Figures

Figure 1
Figure 1
Efficiency of microRNA‐155 (miR‐155) inhibition and overexpression. A, Diagram describing the experimental setup. Human primary brain microvascular endothelial cells (HBMECs) seeded in cell culture inserts were subjected to 3 hours of oxygen‐glucose deprivation (OGD) and returned back to the normal cell culture conditions; 24 hours later, the cells were transfected with miR‐155 inhibitor, mimic, or appropriate scrambled oligonucleotide. Cells were analyzed at 48 hours after the transfection. B, Fluorescence confocal microscopy of HBMECs transfected with fluorescein‐labeled miR‐155 inhibitor control (green dots) and stained for actin with rhodamine‐conjugated fluorescent phalloidin. Left panel: orthogonal image projection verifies that fluorescent probes were incorporated within the cell. Bar: 10 μm. C and D, miR‐155 PCR analysis. Total RNA was isolated from the cells subjected to OGD and transfected with the following oligonucleotides: miR‐155 mimic (OGD/M; grey bar); mimic control (OGD/MC; grey bar with white stripes); specific miR‐155 inhibitor (OGD/I; black bar); and control inhibitor (OGD/IC; black bar with white stripes). C, P=0.002, (D) P=0.029, Mann–Whitney (Wilcoxon) test. n=3 (for OGD/MC and OGD/IC groups) and n=4 (for OGD/I and OGD/M groups) independent experiments. E, Validation of miR‐155 inhibition by the quantitative assessment of miR‐155 direct target proteins Rictor and SMAD‐1. Optical density of the protein bands was measured using ImageJ software, normalized to GAPDH density in every sample, and expressed as average relative density values. Protein levels were compared between OGD/I (black bars) and OGD/IC (black bars with white stripes) cell lysates. P=0.029, Mann–Whitney (Wilcoxon) test, n=3 independent experiments per group. Representative immunoblots demonstrate Rictor and SMAD‐1 protein expression (3 bands per group); GAPDH was used as a loading control. Error bars: SEM; *P<0.05; **P<0.01.
Figure 2
Figure 2
Endothelial monolayer integrity is improved after microRNA‐155 (miR‐155) inhibition in the oxygen‐glucose deprivation (OGD)–subjected cells. Human primary brain microvascular endothelial cell (HBMEC) morphology following OGD was evaluated in the normoxic control (NC), control inhibitor (OGD/IC), specific miR‐155 inhibitor (OGD/I), and mimic (OGD/M) group of cells using fluorescence staining for vascular endothelial (VE)–cadherin (A, green) and actin (B; Acti‐stain 488 phalloidin, green). Imaging was performed with a Zeiss LSM800 confocal microscope, using tile scan and Z stack image acquisitions. Bars: 10 μm. C, Endothelial monolayer resistance was assessed at 48 hours after the cell transfection. Measurements were performed in NC (white bars), OGD/IC (black bar with white stripes), OGD/I (black bar), mimic control (OGD/MC; grey bar with white stripes), and OGD/M (grey bar) cells. Measured resistances were corrected by subtracting blank resistance and multiplying by the area of the insert membrane. Final unit area resistance data are expressed as percentage of the measurements in NC cells (graph). n=4 independent experiments, each with 24‐well measurements (unit of analysis) per group. Tests based on the linear mixed effects models revealed a significant overall across‐group difference (P<0.0001) and significant difference between OGD/IC and OGD/I (P=0.002); the difference between OGD/MC and OGD/M was not significant (P=0.44). D, Following the monolayer resistance measurements, the same cells were subjected to endothelial monolayer permeability assay. The amount of fluorescent dextran diffusing through the monolayer from the upper chamber to the lower chamber was measured with microplate fluorometer. n=4 independent experiments each with 24 well measurements (unit of analysis) per group. Tests based on linear mixed effects models revealed a significant overall difference among the 5 groups (P<0.0001), a significant difference between OGD/IC and OGD/I (P<0.00001), and a significant difference between OGD/MC and OGD/M (P<0.00001). Error bars: SEM; **P<0.01, ***P<0.001.
Figure 3
Figure 3
MicroRNA‐155 (miR‐155) inhibition does not affect viability and NO/cytokine release in human primary brain microvascular endothelial cells (HBMECs). A, MTT cell viability assay was performed in normoxic controls (NC; white bar) and oxygen‐glucose deprivation (OGD)–subjected cells transfected with specific miR‐155 inhibitor (OGD/I; black bar), control inhibitor (OGD/IC; black bar with white stripes), mimic (OGD/M; grey bar), and mimic control (OGD/MC; grey bar with white stripes). Cell viability in all groups was expressed as a percentage of measurements in NC cells. B through D, HBMEC‐conditioned medium was collected in all groups of cells (described in A) at 48 hours after cell transfection and analyzed for NO and human cytokine/chemokine expression. B, NO levels in all groups were measured with total NO and nitrate/nitrite ELISA, and expressed as a percentage of the measurements in NC cells. C, Human cytokine expression was assessed using the Proteome Profiler Array. Analysis detected that HBMECs released 5 human cytokines/hemokines including macrophage migration inhibitory factor (MIF), interleukin 8 (IL‐8), chemokine (C‐C motif) ligand 2 (CCL 2), and chemokine (C‐X‐C motif) ligand 1 (CXCL1) as well as Serpin E1/plasminogen activator inhibitor‐1 protein. Representative images demonstrate cytokine expression profiling in OGD/IC and OGD/I samples. D, Profiles of mean spot pixel density for all cytokines were quantified using ImageJ software. Average measurements in NC cells are shown as white bars. Nonparametric 1‐way ANOVA (Kruskal test) was conducted, followed by Mann–Whitney test for pairwise comparison. Results were nonsignificant. n=3 independent experiments per group.
Figure 4
Figure 4
Effect of microRNA‐155 (miR‐155) inhibition and overexpression on the endothelial cell junction proteins. Immunofluorescence microscopy (A) and Western blot analysis (B) were performed to detect the cellular distribution and expression levels of cell junction proteins in oxygen‐glucose deprivation (OGD)/control inhibitor (OGD/IC), specific miR‐155 inhibitor (OGD/I), and mimic (OGD/M) cells. A, Immunofluorescence staining for occludin, claudin‐5, and zonula occludens protein‐1 (ZO‐1; red). Confocal microscopy images were acquired using a Zeiss LSM800 confocal microscope. Bar: 10 μm. B, Representative immunoblots demonstrate the levels of occludin, claudin‐5, ZO‐1, and vascular endothelial (VE)–cadherin. In addition to cell junction proteins, Western blots were performed to assess expression of miR‐155 direct target Rheb and RhoA bands. C, Graph demonstrates quantification of Western blot data obtained in OGD/I (black squares) and OGD/M (grey triangles) samples. Optical density of the protein bands was measured using ImageJ software, normalized to GAPDH density in every sample, and expressed as a percentage of the optical density calculated in the appropriate control OGD/IC and mimic control (OGD/MC) samples, respectively. n=4 (for OGD/IC and OGD/MC groups) and 6 (for OGD/I and OGD/M groups) independent experiments. Mann–Whitney (Wilcoxon) test was used to compare the relative protein levels between OGD/I and OGD/IC groups (P=0.029). Error bars: SEM; *P<0.05.
Figure 5
Figure 5
MicroRNA‐155 (miR‐155) inhibition results in stabilization of claudin‐1 (CLDN1). A, Immunofluorescence (IF) staining of CLDN1 in oxygen‐glucose deprivation (OGD)/control inhibitor (OGD/IC), specific miR‐155 inhibitor (OGD/I), and mimic (OGD/M) cells. Arrows demonstrate cell membrane localization of CLDN1 in OGD/I cells. Imaging was performed with a Zeiss LSM800 confocal microscope using tile scan and Z stack image acquisitions. Bar: 20 μm. B, Western blot analysis of CLDN1 protein expression in normoxic control (NC), OGD/IC, OGD/I, mimic control (OGD/MC), and OGD/M samples. Graph: optical density of the protein bands was measured using ImageJ software, normalized to GAPDH density in every sample, and expressed as the average relative density values. Mann–Whitney (Wilcoxon) test and Kruskal test were used to compare pairwise difference and overall difference, respectively. Overall differences were highly significant (P=0.0095); the pairwise difference between NC and OGD/I, OGD/IC, and OGD/I, and between OGD/MC and OGD/M was also significant (P=0.029). n=4 (for NC) and n=6 (for other groups) independent experiments. C, CLDN1 (CLDN1) quantitative polymerase chain reaction was performed in all samples (4 samples per group) and expressed as the relative fold change compared with CLDN1 expression in NC samples. Red bar demonstrates CLDN1 expression in the positive control sample (a mix of cDNAs synthesized from total RNA from 18 different human tissues; supplied by the manufacturer). D, Luciferase reporter assay, using Luc‐Pair Duo‐Luciferase HS Assay System, performed in HeLa cells. Cells were cotransfected with reporter plasmids carrying a fragment of the 3′‐UTR region of CLDN1 (Firefly CLDN1, grey bar), miR‐155 mimic (Firefly CLDN1+M, blue bar), and a combination of miR‐155 mimic and inhibitor (Firefly CLDN1+M+I, purple bar). Kruskal test showed a significant overall difference P=0.023). Mann–Whitney test showed a difference between Firefly CLDN1 and Firefly CLDN1+M (P=0.029), and between CLDN1+M and CLDN1+M+I (P=0.029). n=4 samples per group. Error bars: SEM; *P<0.05.
Figure 6
Figure 6
Claudin‐1 (CLDN1) and zonula occludens protein‐1 (ZO‐1) colocalize and interact in oxygen‐glucose deprivation (OGD)/specific miR‐155 inhibitor (OGD/I) cells. Double immunofluorescence staining of OGD/I cells with anti‐CLDN1 (A) and anti–ZO‐1 (B) antibodies. C and D, Colocalization maps automatically generated using Fiji software demonstrate colocalization (yellow) and no colocalization (red pixels) of 2 channels in the cells (C); enlarged details in (D) depict the degree of colocalization on the cell borders. Bar: 10 μm. E, Orthogonal projection of human primary brain microvascular endothelial cells from the OGD/I group, coimmunostained with anti‐CLDN1 (green) and anti–ZO‐1 (red) antibodies. 4′,6‐Diamidino‐2‐phenylindole staining was used to visualize nuclei (blue). Imaging was performed with a Zeiss LSM800 confocal microscope using tile scan and Z stack image acquisitions. F, Cell lysates from the OGD/I and OGD/control inhibitor (OGD/IC) groups (L‐OGD/I and L‐OGD/IC) were immunoprecipitated with anti–ZO‐1 antibody. Immunoprecipitates (IPOGD/I and IPOGD/IC) were probed with antibodies against ZO‐1, CLDN1, actin, phosphotyrosine (pTyr), and phosphoserine (pSer). G through I, OGD‐subjected cells were transfected with CLDN1 cDNA‐containing vector (OGD+CLDN1) or empty vector (OGD+EV). G, expression of ZO‐1 and CLDN1 was detected in OGD+CLDN1 (lane 1), normoxic control (NC; lane 2), and OGD+EV (lane 3) samples. Actin was used as a loading control. H, Endothelial monolayer resistance was assessed at 48 hours after the cell transfection. Measurements were performed in NC (white bar), OGD+EV (blue bar), and OGD+CLDN1 (grey bar) cells. Measured resistances were corrected by subtracting blank resistance and multiplying by the area of the insert membrane. Final unit area resistance data are expressed as percentage of the measurements in NC cells (graph). n=3 (for OGD+EV and NC) and n=4 (for OGD+CLDN1) independent experiments, and each experiment had 24 wells (unit of analysis). Tests based on linear mixed effects models show an overall difference (P<0.001) and a difference between OGD+EV and OGD+CLDN1 (P=0.029). I, Following the monolayer resistance measurements, the same cells were subjected to endothelial monolayer permeability assay. The amount of fluorescent dextran diffusing through the monolayer from the upper chamber to the lower chamber was measured with a microplate fluorometer. Data on the graph are expressed as a percentage of the fluorescence intensity measured in NC cells. n=3 independent experiments each with 24 wells per group (unit of analysis). Tests based on linear mixed effects models revealed a significant overall difference (P=0.001), and a difference between EV and CLDN1 (P=0.018). Error bars: SEM; *P<0.05.

Similar articles

Cited by

References

    1. Ballabh P, Braun A, Nedergaard M. The blood‐brain barrier: an overview: structure, regulation, and clinical implications. Neurobiol Dis. 2004;16:1–13. - PubMed
    1. Zhao Z, Nelson AR, Betsholtz C, Zlokovic BV. Establishment and dysfunction of the blood‐brain barrier. Cell. 2015;163:1064–1078. - PMC - PubMed
    1. Haseloff RF, Dithmer S, Winkler L, Wolburg H, Blasig IE. Transmembrane proteins of the tight junctions at the blood‐brain barrier: structural and functional aspects. Semin Cell Dev Biol. 2015;38:16–25. - PubMed
    1. Krause G, Winkler L, Mueller SL, Haseloff RF, Piontek J, Blasig IE. Structure and function of claudins. Biochim Biophys Acta. 2008;1778:631–645. - PubMed
    1. Van Itallie CM, Anderson JM. Claudin interactions in and out of the tight junction. Tissue Barriers. 2013;1:e25247. - PMC - PubMed

Publication types

MeSH terms

LinkOut - more resources