. 2018 Sep;17(9):1766-1777.
doi: 10.1074/mcp.RA118.000554. Epub 2018 Jun 26.

Quantifying and Localizing the Mitochondrial Proteome Across Five Tissues in A Mouse Population

Affiliations

Quantifying and Localizing the Mitochondrial Proteome Across Five Tissues in A Mouse Population

Evan G Williams et al. Mol Cell Proteomics. 2018 Sep.

Abstract

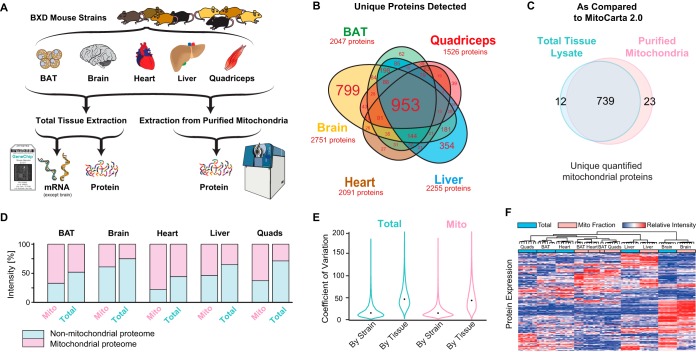
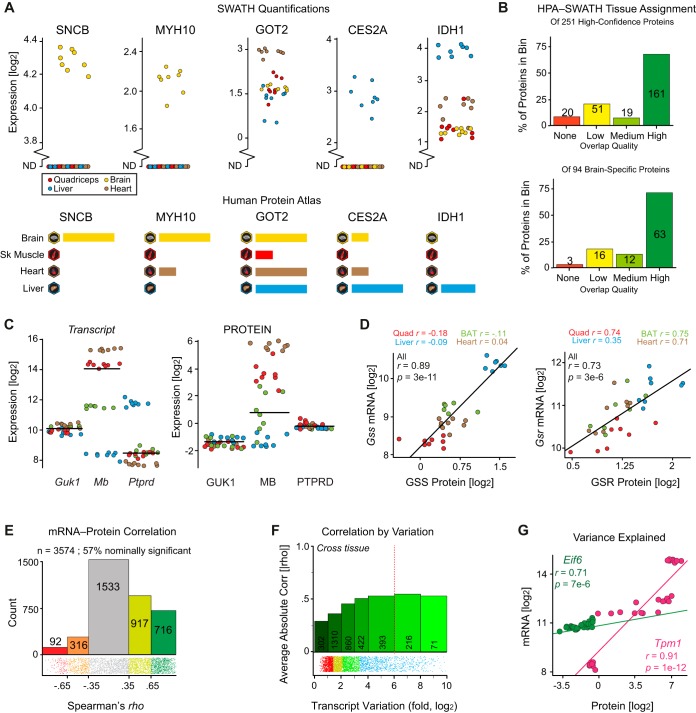
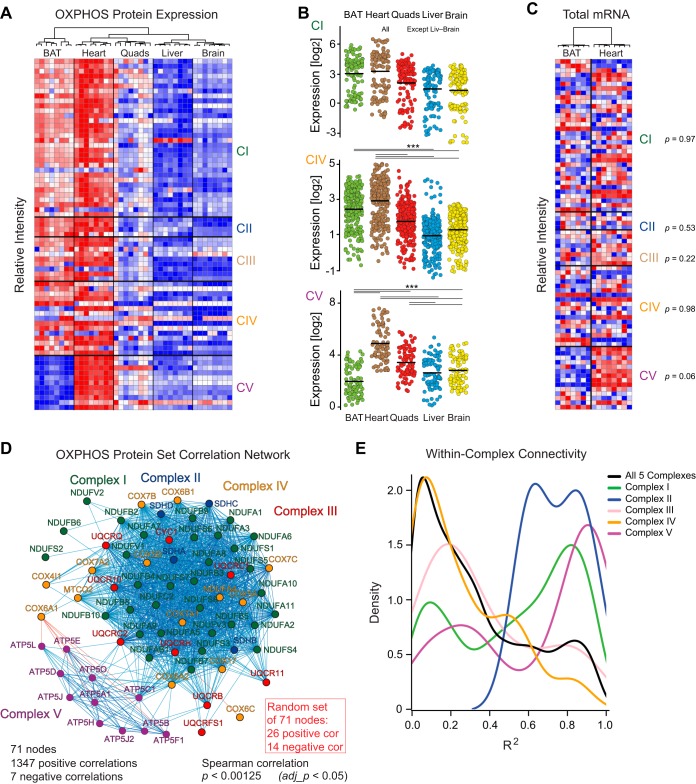
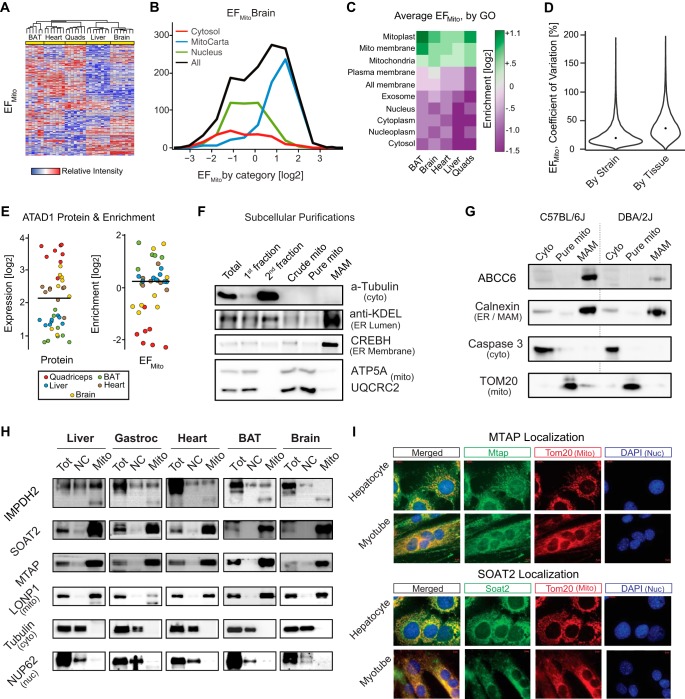
We have used SWATH mass spectrometry to quantify 3648 proteins across 76 proteomes collected from genetically diverse BXD mouse strains in two fractions (mitochondria and total cell) from five tissues: liver, quadriceps, heart, brain, and brown adipose (BAT). Across tissues, expression covariation between genes' proteins and transcripts-measured in the same individuals-broadly aligned. Covariation was however far stronger in certain subsets than others: only 8% of transcripts in the lowest expression and variance quintile covaried with their protein, in contrast to 65% of transcripts in the highest quintiles. Key functional differences among the 3648 genes were also observed across tissues, with electron transport chain (ETC) genes particularly investigated. ETC complex proteins covary and form strong gene networks according to tissue, but their equivalent transcripts do not. Certain physiological consequences, such as the depletion of ATP synthase in BAT, are thus obscured in transcript data. Lastly, we compared the quantitative proteomic measurements between the total cell and mitochondrial fractions for the five tissues. The resulting enrichment score highlighted several hundred proteins which were strongly enriched in mitochondria, which included several dozen proteins were not reported in literature to be mitochondrially localized. Four of these candidates were selected for biochemical validation, where we found MTAP, SOAT2, and IMPDH2 to be localized inside the mitochondria, whereas ABCC6 was in the mitochondria-associated membrane. These findings demonstrate the synergies of a multi-omics approach to study complex metabolic processes, and this provides a resource for further discovery and analysis of proteoforms, modified proteins, and protein localization.


Figures

Fig. 1.
Fig. 1.
Cross-tissue mitochondrial proteomics using SWATH-MS. A, Project design. Eight genetically distinct BXD strains were selected for proteomic analysis in five tissues: BAT, brain, heart, liver, and quadriceps. Each tissue sample was measured for both whole-cell proteome and purified mitoproteome. mRNA was previously measured in the same individuals for all tissues except brain. B, Venn diagram showing the identification of proteins in each tissue. Brain has the most uniquely identified proteins. Font size corresponds to the number of proteins per category. C, Only a few additional mitoproteins are identified in purified mitochondria. This Venn diagram is collation of all tissues' data. D, Total proteome intensities summed and segregated into mitoproteins or non-mitoproteins based on MitoCarta. E, Coefficients of variation for protein intensities across strains and tissues. The median coefficient of variation within tissue across strains was ∼15%, compared with coefficients of variation of ∼45% within-strain across tissues. F, Hierarchical clustering of all protein expression levels across samples. Clustering (Euclidean distance, black lines at top) was performed using all samples proteins, although only 150 proteins are displayed below (y axis) for brevity and clarity in visualization.
Fig. 2.
Fig. 2.
Variation and covariation across transcripts and proteins. A, Excerpt of the 251 comparisons between SWATH quantifications and HPA data for the four overlapping tissues (BAT is not in HPA). Each dot represents a different strain for the total proteome, with representative examples shown for exact matches (e.g. SNCB), close matches (MYH10, CES2A), moderate matches (GOT2), and discrepancies (IDH1). A broken axis with points at ND indicates “no data” (i.e. not quantified in the raw signal). B, Histogram of HPA-SWATH alignment (top) all tissues and (bottom) brain-only. HPA and SWATH broadly agree, with exact matches for ∼60%, moderate matches for ∼30%, and clear discrepancies for ∼10%. Further details can be found in the supplemental Table S1. C, Transcript and protein variation tend to be similar across layers (e.g. Guk1 and Mb), though exceptions are readily found (e.g. Ptprd). D, Although some gene product pairs covary only under situations of high variance, such as Gss—which correlates only when all tissues are considered—others are more consistently linear irrespective of variance, such as Gsr. E, Transcripts and proteins broadly covary. 57% of genes' proteins and transcripts correlate nominally (p < 0.05) across the data, at an average of rho = 0.42. F, More variable transcripts are more likely to correlate with their associated protein. Among highly variable transcripts (e.g. variance ≥ 26 fold, right of red dotted line), 72% correlate least nominally with their protein levels with an average correlation coefficient of rho = 0.53. Among the least variable transcripts (variance ≤ 21 fold), only 29% nominally correlate with an average correlation coefficient of rho = 0.29. G, Eif6 transcript and protein levels are strongly correlated despite relatively little variation across tissues. Tpm1 transcript and protein levels are highly correlated, but only in the context of massive cross-tissue variance (∼100-fold). Pearson correlation is used as the visual difference in expression variance is lost with Spearman correlations (which are rho = 0.69 and rho = 0.93 for Eif6 and Tpm1, respectively).
Fig. 3.
Fig. 3.
Functional protein network based on large-scale proteomics. A, Relative protein intensities of the 71 measured OXPHOS proteins. BAT shows high expression of CI-IV, but the lowest expression of CV proteins (ANOVA post-hoc Dunnett test, p < 0.005 BAT versus all other tissues). B, Significant differences of CIV and CV protein expression across all five tissues (ANOVA with post-hoc Tukey tests, p < 0.005 indicated by ***). For CI, all differences are significant except for liver versus brain (p = 0.11). C, Transcript expression intensities in BAT and heart for the 66 OXPHOS transcripts that also have protein expression data (5 OXPHOS genes have protein measurements but no transcript measurements). Hierarchical clustering separates tissues, yet no complexes have different expression (paired Welch's t-tests, shown at side). D, Covariation network of all five tissues together shows major coexpression of CI-IV whereas CV is distinctly apart because of its contrary regulation in BAT. At adj_p < 0.05, there are 1347 positive correlations and 7 negative correlations between the 71 OXPHOS nodes (proteins). For a set of 71 proteins randomly selected from the same dataset, only 26 positive and 14 negative correlations are observed at the same cutoff. E, Covariation within complexes: Most correlations from CI, CII, and CV consistently correlate within their own complex, whereas CIII and CIV proteins are more variably distributed.
Fig. 4.
Fig. 4.
Using EFmito to identify mitochondrial localization. A, Cluster analysis of all 3648 proteins based on EFmito. Hierarchical clustering separates all tissues. B, Histogram of EFmito frequencies in brain for gene ontologies of nuclear, cytosolic, or mitochondrial localization. Mitochondrial proteins generally have high EFmito, whereas nuclear and cytosolic proteins generally have low EFmito, though significant overlap is observed. C, Heat map showing the average EFmito across all tissues in a selection of cell compartments, with consistent enrichment of mitoprotein sets. D, Coefficients of variation between strains and tissues for EFmito. Within strains, median is 22%, compared with 39% across tissues, i.e. tissue differences again have a larger impact than do strain differences. E, ATAD1 expression varied among tissues, with quadriceps having the highest expression yet lowest EFmito, suggesting tissue-dependent subcellular localization. F, Fractionations showing the ultracentrifugation purification of the mitochondria from the MAM. G, ABCC6 is consistently localized in the MAM across strains, though trace amounts appear in the cytosol. Abcc6 has a major sequence variant between C57BL/6J and DBA/2J (Williams et al., 2016), which substantially affects expression but not localization. H, Western blots indicate that MTAP, SOAT2, and IMPDH2 are localized in the mitochondria. LONP1, tubulin, and NUP62 were used as mitochondrial, cytosolic and nuclear markers, respectively. NC: Total cell minus the mitochondrial and MAM fractions. I, Mitochondrial and nuclear ICC staining of MTAP and SOAT2 shows the localization of both proteins with mitochondria in hepatocytes and myotubes. Tom20 and DAPI were used to stain mitochondria and nuclei, respectively.

References

    1. Nunnari J., and Suomalainen A. (2012) Mitochondria: in sickness and in health. Cell 148, 1145–1159 - PMC - PubMed
    1. Jovaisaite V., Mouchiroud L., and Auwerx J. (2014) The mitochondrial unfolded protein response, a conserved stress response pathway with implications in health and disease. J. Exp. Biol. 217, 137–143 - PMC - PubMed
    1. Fox T. D. (2012) Mitochondrial protein synthesis, import, and assembly. Genetics 192, 1203–1234 - PMC - PubMed
    1. Neupert W., and Herrmann J. M. (2007) Translocation of proteins into mitochondria. Annu. Rev. Biochem. 76, 723–749 - PubMed
    1. Schagger H., and Pfeiffer K. (2000) Supercomplexes in the respiratory chains of yeast and mammalian mitochondria. EMBO J. 19, 1777–1783 - PMC - PubMed

Publication types