. 2018 Jul 31;8(8):2735-2747.
doi: 10.1534/g3.118.200415.

Genomic Selection in Preliminary Yield Trials in a Winter Wheat Breeding Program

Affiliations

Genomic Selection in Preliminary Yield Trials in a Winter Wheat Breeding Program

Vikas Belamkar et al. G3 (Bethesda). .

Abstract

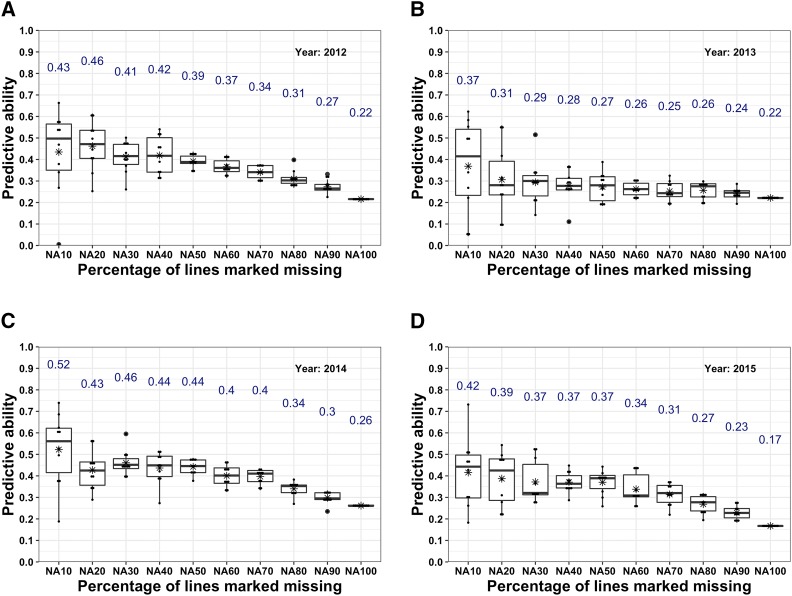
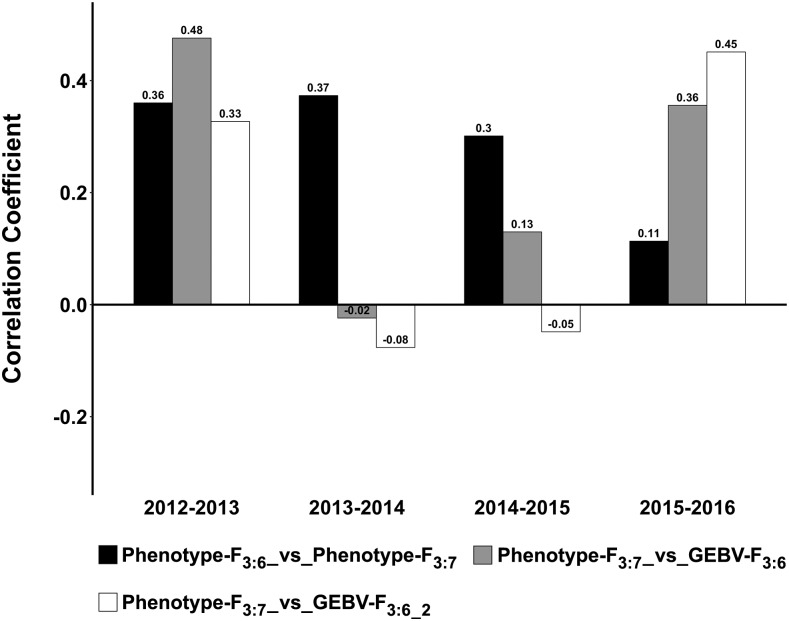
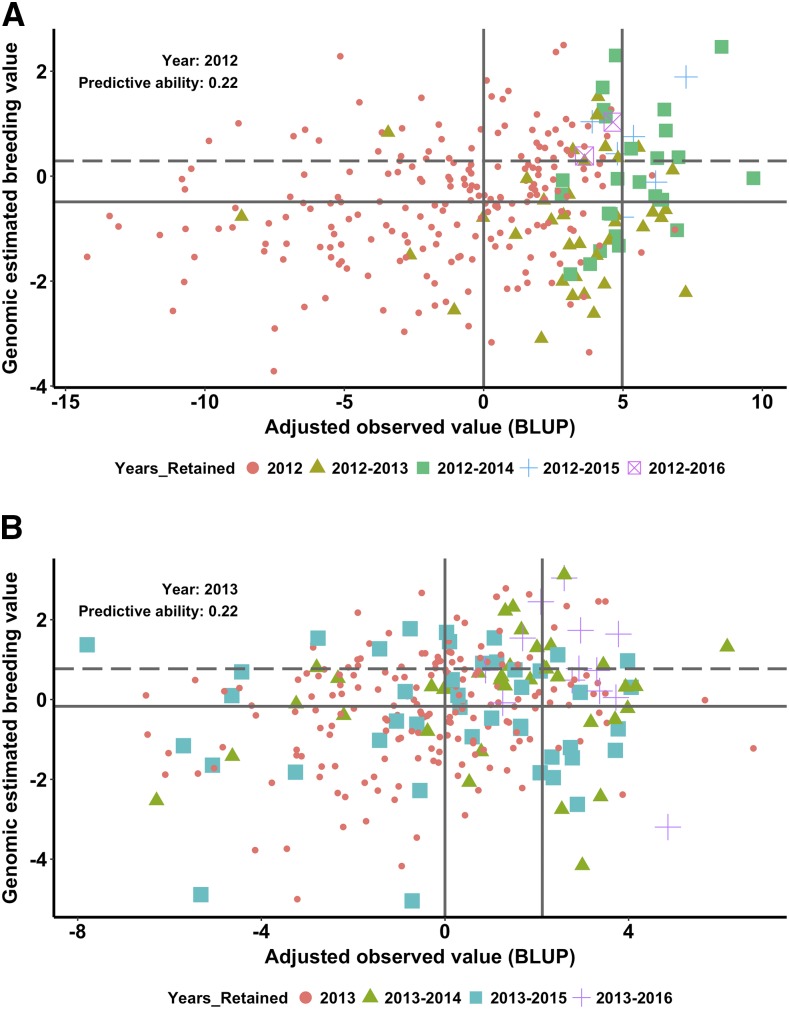
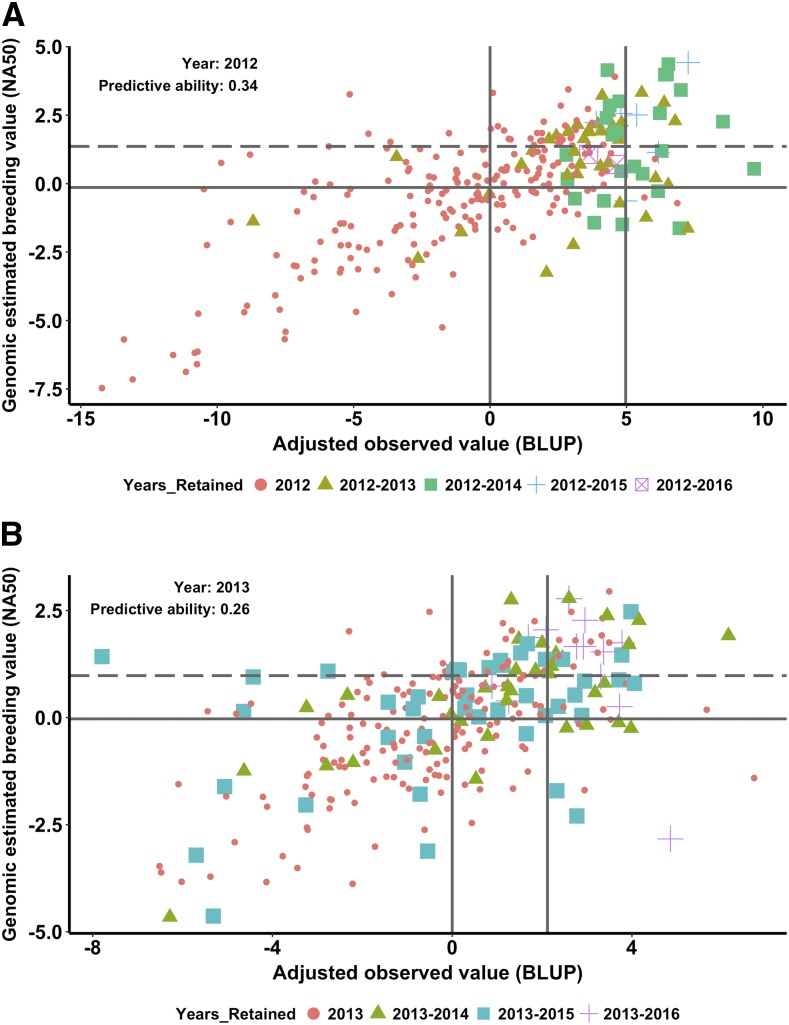
Genomic prediction (GP) is now routinely performed in crop plants to predict unobserved phenotypes. The use of predicted phenotypes to make selections is an active area of research. Here, we evaluate GP for predicting grain yield and compare genomic and phenotypic selection by tracking lines advanced. We examined four independent nurseries of F3:6 and F3:7 lines trialed at 6 to 10 locations each year. Yield was analyzed using mixed models that accounted for experimental design and spatial variations. Genotype-by-sequencing provided nearly 27,000 high-quality SNPs. Average genomic predictive ability, estimated for each year by randomly masking lines as missing in steps of 10% from 10 to 90%, and using the remaining lines from the same year as well as lines from other years in a training set, ranged from 0.23 to 0.55. The predictive ability estimated for a new year using the other years ranged from 0.17 to 0.28. Further, we tracked lines advanced based on phenotype from each of the four F3:6 nurseries. Lines with both above average genomic estimated breeding value (GEBV) and phenotypic value (BLUP) were retained for more years compared to lines with either above average GEBV or BLUP alone. The number of lines selected for advancement was substantially greater when predictions were made with 50% of the lines from the testing year added to the training set. Hence, evaluation of only 50% of the lines yearly seems possible. This study provides insights to assess and integrate genomic selection in breeding programs of autogamous crops.

Keywords: GenPred; Genomic selection; Triticum aestivum; genomic best linear unbiased prediction; genomic prediction; genotyping-by-sequencing; shared data resources; spatial variation.


Figures

Figure 1
Figure 1
The maximum realized kinship coefficient (MRKC) between lines grown in a testing year and lines in rest of the years (training set). The MRKC was calculated as max (Uij) and Uij is the realized kinship coefficient between line i in the test set and line j in the training set. The MRKC value represents the kinship between a specific line in the test set and all lines in the training set. The kinship of each of the preliminary yield trials (PYT 2012-2015) with rest of the PYTs (training set) and kinship between lines advanced from the PYT to advanced yield trial (AYT) each year (example, AYT 2013) and lines in the training set (PYT 2013, 2014, and 2015) are shown in a and b. The average maximum realized kinship coefficient estimated across all lines grown in PYT and AYT is written on top of each of the violin plots.
Figure 2
Figure 2
Predictive ability (PA) estimated for grain yield using various cross-validation scenarios (NA10 to NA90) and for an entire new preliminary yield trial nursery (NA100) in each of the four years, 2012 to 2015, a to d. Each of cross-validation scenarios was performed 10 times and the mean PA is written on top of each of the box plot and is also highlighted with an asterisk in the boxplots.
Figure 3
Figure 3
Comparison of phenotypic and genomic selection. The comparison is made using 57 lines advanced from the preliminary yield trial (F3:6) grown in 2012-2015 to the advanced yield trial (F3:7) grown in 2013-2016. The suffix “2” separated by an underscore represents scenarios where the genomic estimated breeding values of the preliminary yield trials (F3:6) are estimated by excluding the following (F3:7) year from the training set. Correlation coefficients noted on the bar plots.
Figure 4
Figure 4
Comparison of adjusted observed grain yield values (best linear unbiased predictors, BLUPs) and genomic estimated breeding values (GEBVs) for lines tested in 2012 (a) and 2013 (b) preliminary yield trials (PYTs). The lines advanced in each year from the 2012 and 2013 PYT nursery until 2016 are highlighted with different colors and shapes. The two vertical lines represent the mean of the BLUPs of the PYT nursery and the mean of the BLUPs of the 57 PYT lines selected for advancement to the advanced yield trial nursery. The two horizontal lines indicate the mean (solid) and the 75th percentile of the genomic estimated breeding values (dashed).
Figure 5
Figure 5
Comparison of adjusted observed grain yield (best linear unbiased predictors, BLUPs) and genomic breeding values estimated using all lines in other years and 50% of the lines randomly selected from 2012 (a) and 2013 (b) from preliminary yield trials (PYTs). The lines advanced in each year from the 2012 and 2013 PYT nursery until 2016 are highlighted with different colors and shapes. The two vertical lines represent the mean of the BLUPs of the PYT nursery and the mean of the BLUPs of the 57 PYT lines selected for advancement to the advanced yield trial nursery. The two horizontal lines indicate the mean (solid) and the 75th percentile of the genomic estimated breeding values (dashed).

References

    1. Akdemir D., Sanchez J. I., Jannink J. L., 2015. Optimization of genomic selection training populations with a genetic algorithm. Genet. Sel. Evol. 47: 38 10.1186/s12711-015-0116-6 - DOI - PMC - PubMed
    1. Allen A. M., Barker G. L. A., Wilkinson P., Burridge A., Winfield M., et al. , 2013. Discovery and development of exome‐based, co‐dominant single nucleotide polymorphism markers in hexaploid wheat (Triticum aestivum L.). Plant Biotechnol. J. 11: 279–295. 10.1111/pbi.12009 - DOI - PubMed
    1. Arruda M. P., Lipka A. E., Brown P. J., Krill A. M., Thurber C., et al. , 2016. Comparing genomic selection and marker-assisted selection for Fusarium head blight resistance in wheat (Triticum aestivum L.). Mol. Breed. 36: 84.
    1. Asoro F. G., Newell M. A., Beavis W. D., Scott M. P., Jannink J.-L., 2011. Accuracy and training population design for genomic selection on quantitative traits in elite North American oats. Plant Genome 4: 132–144. 10.3835/plantgenome2011.02.0007 - DOI
    1. Asoro F. G., Newell M. A., Beavis W. D., Scott M. P., Tinker N. A., et al. , 2013. Genomic, Marker-Assisted, and Pedigree-BLUP Selection Methods for β-Glucan Concentration in Elite Oat. Crop Sci. 53: 1894–1906. 10.2135/cropsci2012.09.0526 - DOI

Publication types