. 2018 Aug 24;293(34):13214-13223.
doi: 10.1074/jbc.RA118.003910. Epub 2018 Jun 26.

Routes of phosphoryl group transfer during signal transmission and signal decay in the dimeric sensor histidine kinase ArcB

Affiliations

Routes of phosphoryl group transfer during signal transmission and signal decay in the dimeric sensor histidine kinase ArcB

Juan L Teran-Melo et al. J Biol Chem. .

Abstract

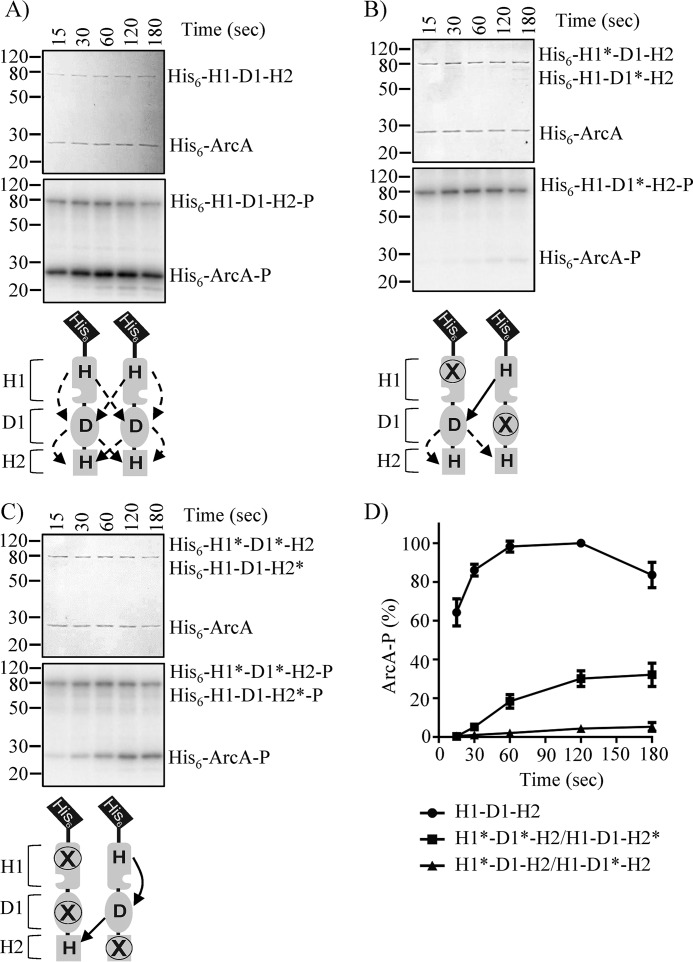
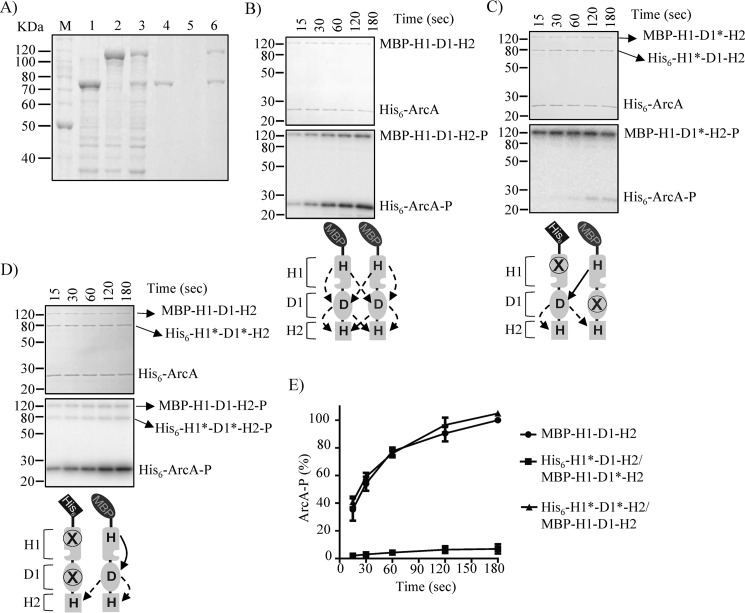
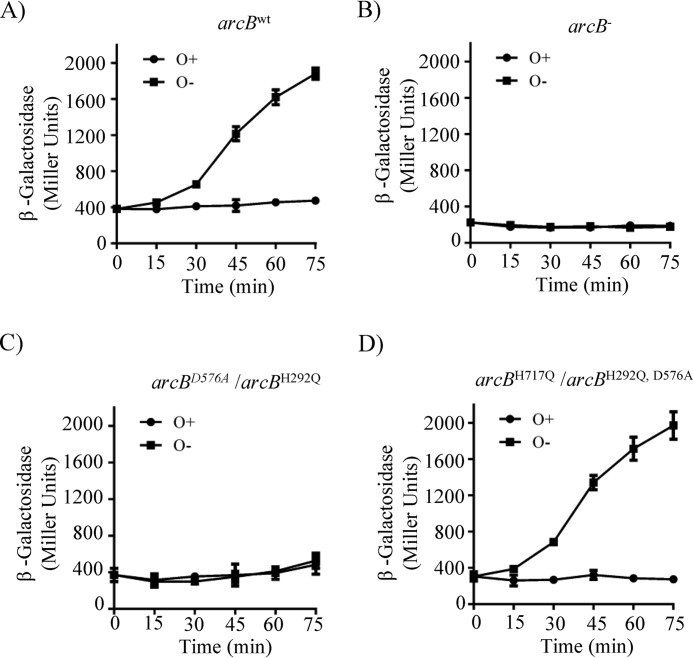
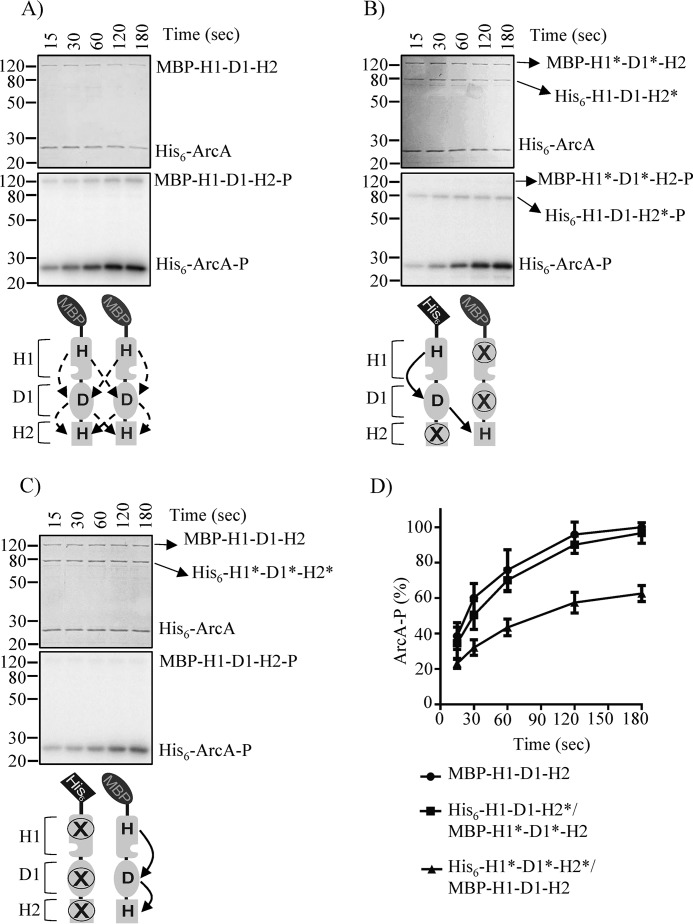
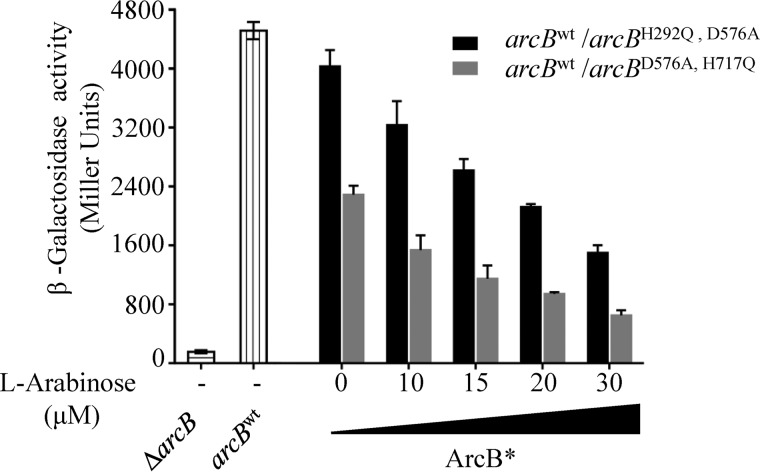
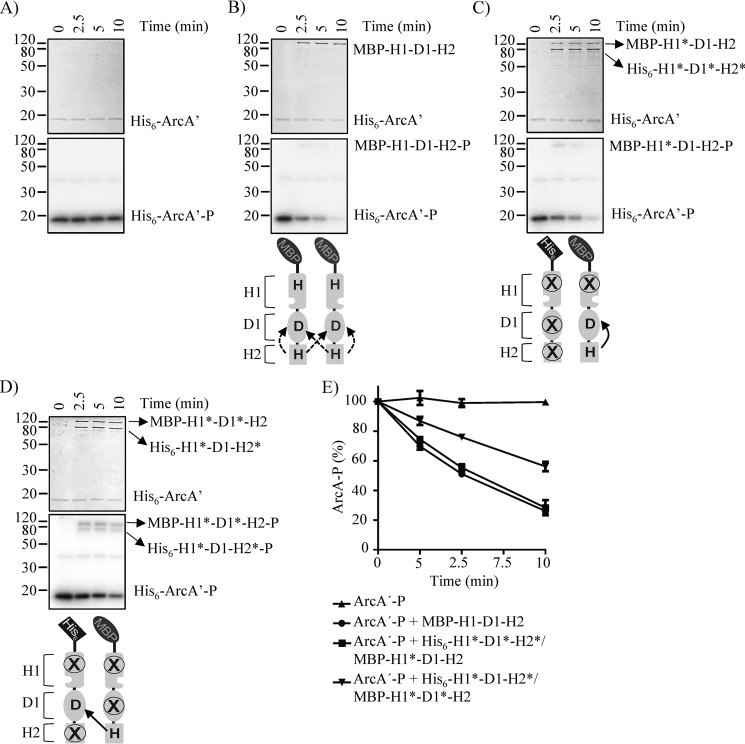
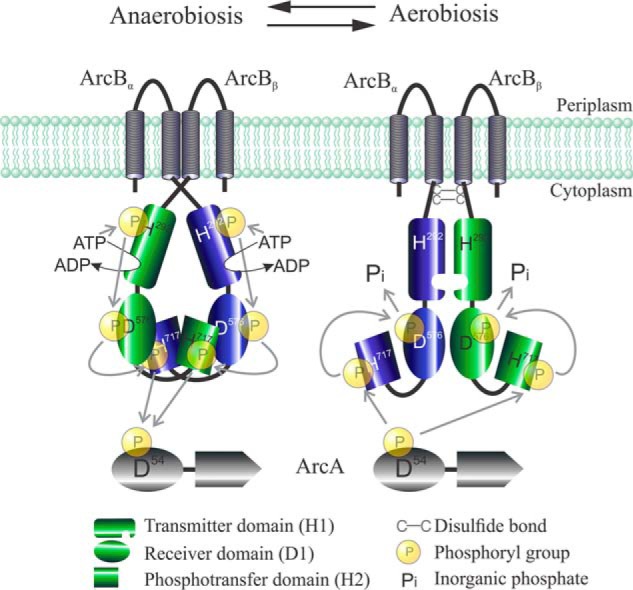
The Arc (anoxic redox control) two-component system of Escherichia coli, comprising ArcA as the response regulator and ArcB as the sensor histidine kinase, modulates the expression of numerous genes in response to respiratory growth conditions. Under reducing growth conditions, ArcB autophosphorylates at the expense of ATP, and transphosphorylates ArcA via a His292 → Asp576 → His717 → Asp54 phosphorelay, whereas under oxidizing growth conditions, ArcB catalyzes the dephosphorylation of ArcA-P by a reverse Asp54 → His717 → Asp576 → Pi phosphorelay. However, the exact phosphoryl group transfer routes and the molecular mechanisms determining their directions are unclear. Here, we show that, during signal propagation, the His292 → Asp576 and Asp576 → His717 phosphoryl group transfers within ArcB dimers occur intra- and intermolecularly, respectively. Moreover, we report that, during signal decay, the phosphoryl group transfer from His717 to Asp576 takes place intramolecularly. In conclusion, we present a mechanism that dictates the direction of the phosphoryl group transfer within ArcB dimers and that enables the discrimination of the kinase and phosphatase activities of ArcB.

Keywords: ArcB/A two-component system; bacteria; bacterial signal transduction; conformation; histidine kinase; intermolecular phosphotransfer; intramolecular phosphotransfer; phosphorelay; phosphoryl transfer; phosphorylation; sensor kinase.


Conflict of interest statement

The authors declare that they have no conflicts of interest with the contents of this article

Figures

Figure 1.
Figure 1.
ArcA phosphorylation by His6-ArcB78–778 and by combinations of His6-ArcB78–778 phosphorelay mutants. Purified ArcA was incubated in a 30-μl reaction mixture with [γ-32P]ATP and His6-H1-D1-H2 (A), His6-H1*D1-H2 and His6-H1-D1*-H2 (B), or His6-H1*-D1*-H2 and His6-H1-D1-H2* (C). At the indicated time intervals, 5-μl samples were withdrawn and subjected to SDS-PAGE analysis. Coomassie Blue-stained gels revealing protein bands (top panels), corresponding autoradiograms (middle panels), and schemes showing the permitted ∼P transfers into ArcB dimers (bottom panels) are presented. The molecular mass standard values (kDa) are shown on the left, and the position of each polypeptide in the gel is indicated on the right of each panel. D, relative amount of ArcA-P formed, as quantified by densitometric analysis of the autoradiogams. Data represent the averages from at least three independent experiments, and S.D. values (error bars) are indicated.
Figure 2.
Figure 2.
Probing the mode of H1 to D1 ∼P group transfer by in vitro phosphorelay complementation assays using His6-ArcB78–778*/MBP-ArcB78–778* dimers. A, overexpression of His6-H1*-D1-H2 (lane 1), MBP-H1-D1*-H2 (lane 2), and His6-H1*-D1-H2/MBP-H1-D1*-H2 (lane 3) was analyzed by SDS-PAGE and Coomassie Blue staining. Overexpressed proteins were purified by Ni-NTA affinity chromatography, and the elution fractions of His6-H1*-D1-H2 (lane 4), MBP-H1-D1*-H2 (lane 5), and His6-H1*-D1-H2/MBP-H1- D1*-H2 (lane 6) were analyzed by SDS-PAGE and visualized by Coomassie Blue staining. Purified ArcA was incubated in a 30-μl reaction mixture with [γ-32P]ATP and purified/co-eluted MBP-H1-D1-H2 (B), His6-H1*-D1-H2/MBP-H1-D1*-H2 (C), or His6-H1*-D1*-H2/MBP-H1-D1-H2 (D). At the indicated time intervals, 5-μl samples were withdrawn and subjected to SDS-PAGE analysis. Coomassie Blue-stained gels revealing protein bands (top panels), the corresponding autoradiograms (middle panels), and schemes showing the permitted ∼P transfers (bottom panels) are presented. The molecular mass standard values (kDa) are shown on the left, and the position of each polypeptide in the gel is indicated on the right of each panel. E, relative amount of ArcA-P formed, as quantified by densitometric analysis of the autoradiograms. Data represent the averages from at least three independent experiments, and the S.D. values (error bars) are indicated.
Figure 3.
Figure 3.
Co-expression of arcBH717Q and arcBH292Q,D576A restores ArcB activity and regulation of reporter expression. Cultures of strain ECL5003 (arcBwt) (A) and its isogenic strains ECL5004 (arcB) (B) and IFC2001 (arcBD576A) (C) harboring plasmid pEXT22CmArcBH292Q and IFC2002 (arcBH717Q) (D) harboring plasmid pEXT22CmArcBH292Q,D576A, all carrying the ArcA-P–activatable λΦ(cydA′-lacZ) reporter, were grown aerobically in LB buffered with 0.1 m MOPS (pH 7.4) and supplemented with 20 mm d-xylose. At an A600 of 0.2, one aliquot was withdrawn, to measure the β-gal activity (depicted as 0 min), and the rest of the culture was divided in two. One part was kept under aerobic conditions (circles) as a control, whereas the other was shifted to anaerobiosis (squares), and the time course of the β-gal activity was followed. The data represent the averages from three independent experiments, and the S.D. values (error bars) are indicated.
Figure 4.
Figure 4.
Probing the mode of ∼P group transfer from D1 to H2 in vitro. Purified ArcA was incubated in a 30-μl reaction mixture, in the presence of [γ-32P]ATP, with purified MBP-H1-D1-H2 (A), co-purified His6-H1-D1-H2*/MBP-H1*-D1*-H2 (B), or co-purified His6-H1*-D1*-H2*/MBP-H1-D1-H2 (C). At the indicated time intervals, 5-μl samples were withdrawn and subjected to SDS-PAGE analysis. Coomassie Blue–stained gels revealing protein bands (top panels), the corresponding autoradiograms (middle panels), and schemes showing the permitted ∼P transfers into ArcB dimers (bottom panels) are presented. The molecular mass standard values (kDa) are shown on the left, and the position of each polypeptide in the gel is indicated on the right of each panel. D, relative amount of ArcA-P formed, as quantified by densitometric analysis of the autoradiograms. Data represent the averages from at least three independent experiments, and the S.D. values (error bars) are indicated.
Figure 5.
Figure 5.
Effect of increasing concentrations of ArcBH292Q,D576A or ArcBH576A,H717Q in an arcBwt WT strain on the anaerobic ArcA phosphorylation in vivo. Strain ECL5003 (arcBwt), carrying plasmid pBADArcBH292Q,D576A (black bars) or pBADArcBD576D,H717A (gray bars) was grown aerobically in LB buffered with 0.1 m MOPS (pH 7.4) and supplemented with 20 mm d-xylose to an A600 of 0.1. The culture was split to five screw-cap tubes (filled to the rim) for anaerobic growth, and l-arabinose was added at the indicated concentrations. At the mid-exponential phase of growth (A600 of 0.5) β-gal activity was assayed. For comparison purposes, β-gal activities of ECL5003 (bars with vertical lines) and ECL5004 (arcB) (bars with horizontal lines) anaerobic cultures are indicated. The data are averages from three independent experiments, and the S.D. values (error bars) are indicated.
Figure 6.
Figure 6.
Testing the ArcA′-P dephosphorylation by MBP-H1-D1-H2 and His6-ArcB78–778*/MBP-ArcB78–778* dimers. Purified ArcA′-P was incubated alone (A) or with MBP-H1-D1-H2 (B), His6-H1*-D1*-H2*/MBP-H1*-D1-H2 (C), or His6-H1*-D1-H2*/MBP-H1*-D1*-H2 (D) in 25-μl reaction mixtures. At the indicated time points, 5-μl samples were withdrawn for SDS-PAGE analysis. Coomassie Blue–stained gels revealing protein bands (top panels), the corresponding autoradiograms (middle panels), and schemes showing the permitted ∼P transfers into ArcB dimers (bottom panels) are presented. The molecular mass standard values (kDa) are shown on the left, and the position of each polypeptide in the gel is indicated on the right of each panel. E, relative amount of ArcA-P formed, as quantified by densitometric analysis of the autoradiograms. Data represent the averages from at least three independent experiments, and the S.D. values (error bars) are indicated.
Figure 7.
Figure 7.
Testing the time lag for ArcA-P dephosphorylation (signal decay) after a shift to nonstimulating conditions. Strain ECL5002 (squares) and its isogenic ECL5032 (arcBH171Q) strain harboring a plasmid-born arcBH292Q,D576A allele (circles), both carrying the λΦ(lldP′-lacZ) reporter, were grown anaerobically in LB buffered with 0.1 m MOPS (pH 7.4) and supplemented with 20 mm d-xylose and 20 mm l-lactate. At an A600 of 0.2, one aliquot was withdrawn, to measure the β-gal activity (depicted as 0 min), and the rest of the cultures were divided into two: one of the subcultures was kept under anaerobiosis (open symbols), serving as control, whereas the other one was shifted to aerobiosis (filled symbols), and the time course of the β-gal activity was followed. Data represent the averages from three independent experiments, and the S.D. values (error bars) are indicated.
Figure 8.
Figure 8.
Graphic representation of the ArcB/A two-component system showing the proposed modes of ∼P group transfer during signal propagation (anaerobiosis) and signal decay (aerobiosis). Under anoxic growth conditions, the ATP-dependent intramolecular autophosphorylation in H1 is followed by a phosphorelay that involves an intramolecular H1 to D1 phosphotransfer and an intermolecular D1 to H2 phosphotransfer. Under oxic growth conditions, disulfide bond–dependent conformational adjustments of the ArcB modules enforce an intramolecular phosphotransfer from H2 to D1 followed by release of ∼P as Pi, resulting in ArcA-P dephosphorylation and signal decay.

Similar articles

Cited by

References

    1. Georgellis D., Kwon O., Lin E. C., Wong S. M., and Akerley B. J. (2001) Redox signal transduction by the ArcB sensor kinase of Haemophilus influenzae lacking the PAS domain. J. Bacteriol. 183, 7206–7212 10.1128/JB.183.24.7206-7212.2001 - DOI - PMC - PubMed
    1. Jung W. S., Jung Y. R., Oh D. B., Kang H. A., Lee S. Y., Chavez-Canales M., Georgellis D., and Kwon O. (2008) Characterization of the Arc two-component signal transduction system of the capnophilic rumen bacterium Mannheimia succiniciproducens. FEMS Microbiol. Lett. 284, 109–119 10.1111/j.1574-6968.2008.01187.x - DOI - PubMed
    1. Malpica R., Sandoval G. R., Rodríguez C., Franco B., and Georgellis D. (2006) Signaling by the Arc two-component system provides a link between the redox state of the quinone pool and gene expression. Antioxid. Redox Signal. 8, 781–795 10.1089/ars.2006.8.781 - DOI - PubMed
    1. Lynch A. S., and Lin E. C. (1996) Regulation of gene expression in Escherichia coli. in Escherichia coli and Salmonella: Cellular and Molecular Biology (Neidhardt F. C., Curtis R., Ingraham A. L., Lin E. C. C., Low K. B., Magasanik B., Reznikoff W. S., Riley M., Schaechter M., and Umbarger H. E., eds) pp. 1526–1538, American Society for Microbiology, Washington, D. C.
    1. Iuchi S., and Lin E. C. (1988) arcA (dye), a global regulatory gene in Escherichia coli mediating repression of enzymes in aerobic pathways. Proc. Natl. Acad. Sci. U.S.A. 85, 1888–1892 10.1073/pnas.85.6.1888 - DOI - PMC - PubMed

Publication types

MeSH terms

LinkOut - more resources