. 2018 Aug 10;293(32):12525-12534.
doi: 10.1074/jbc.RA118.003471. Epub 2018 Jun 26.

Protein phosphatase 2A stimulates activation of TFEB and TFE3 transcription factors in response to oxidative stress

Affiliations

Protein phosphatase 2A stimulates activation of TFEB and TFE3 transcription factors in response to oxidative stress

José A Martina et al. J Biol Chem. .

Abstract

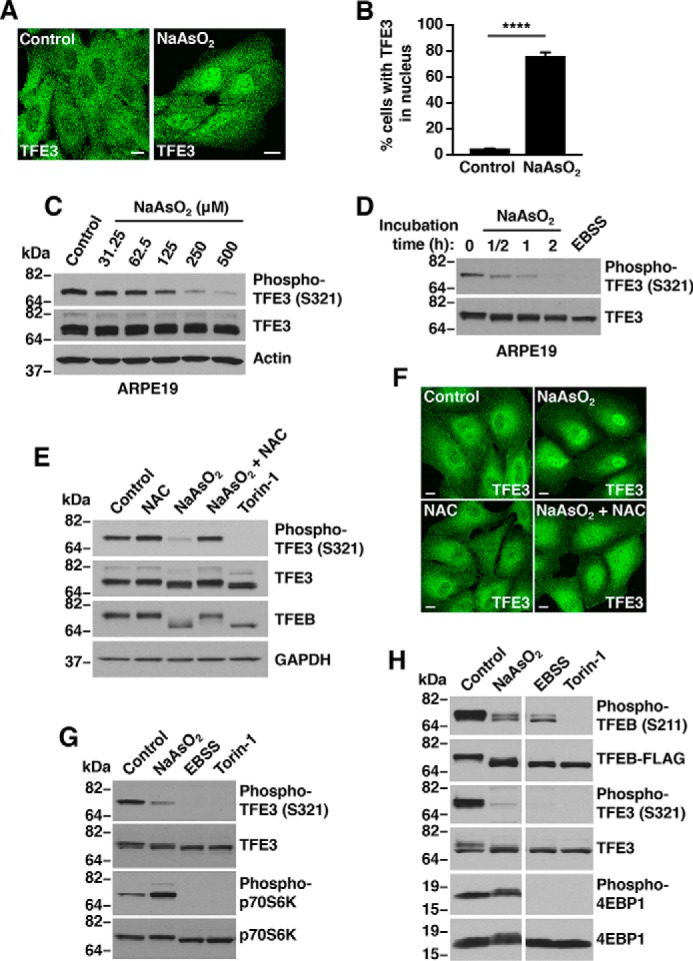
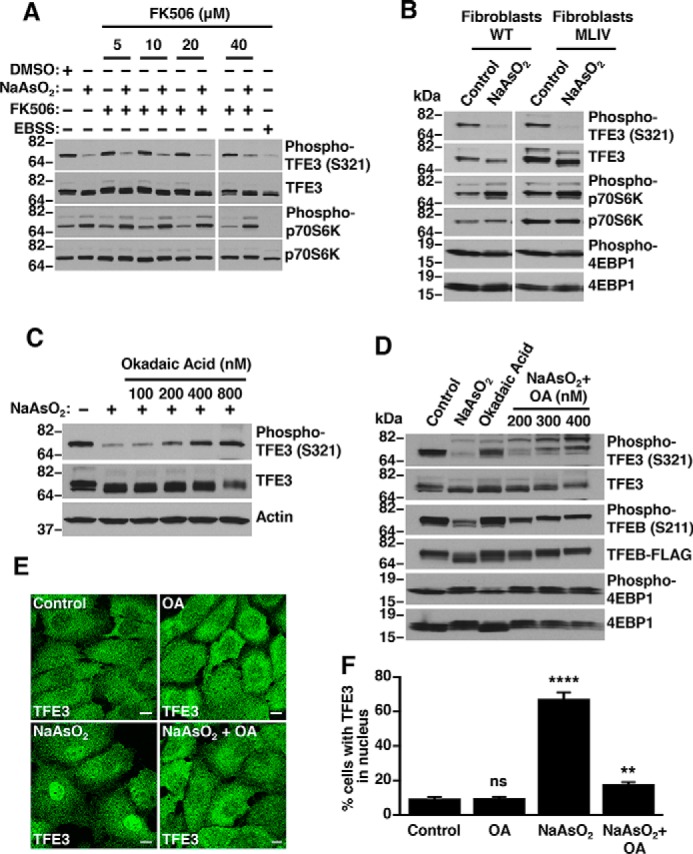
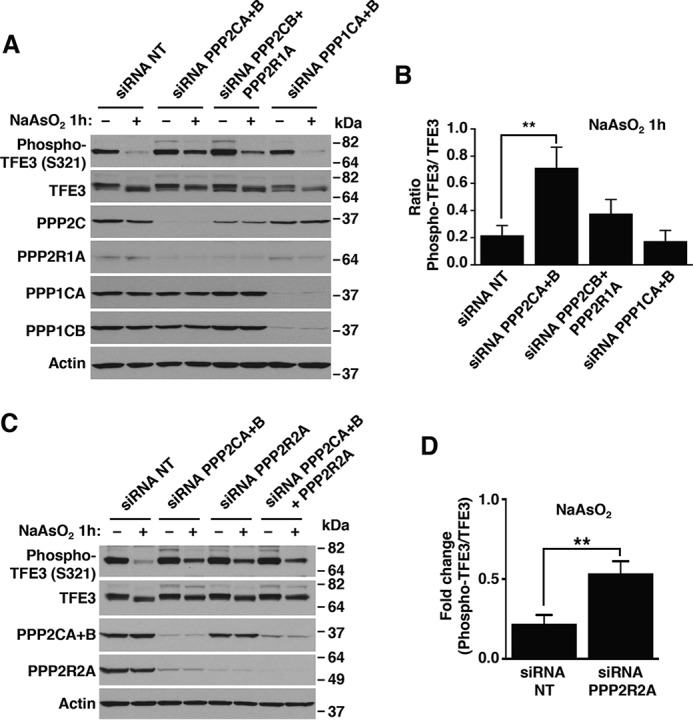
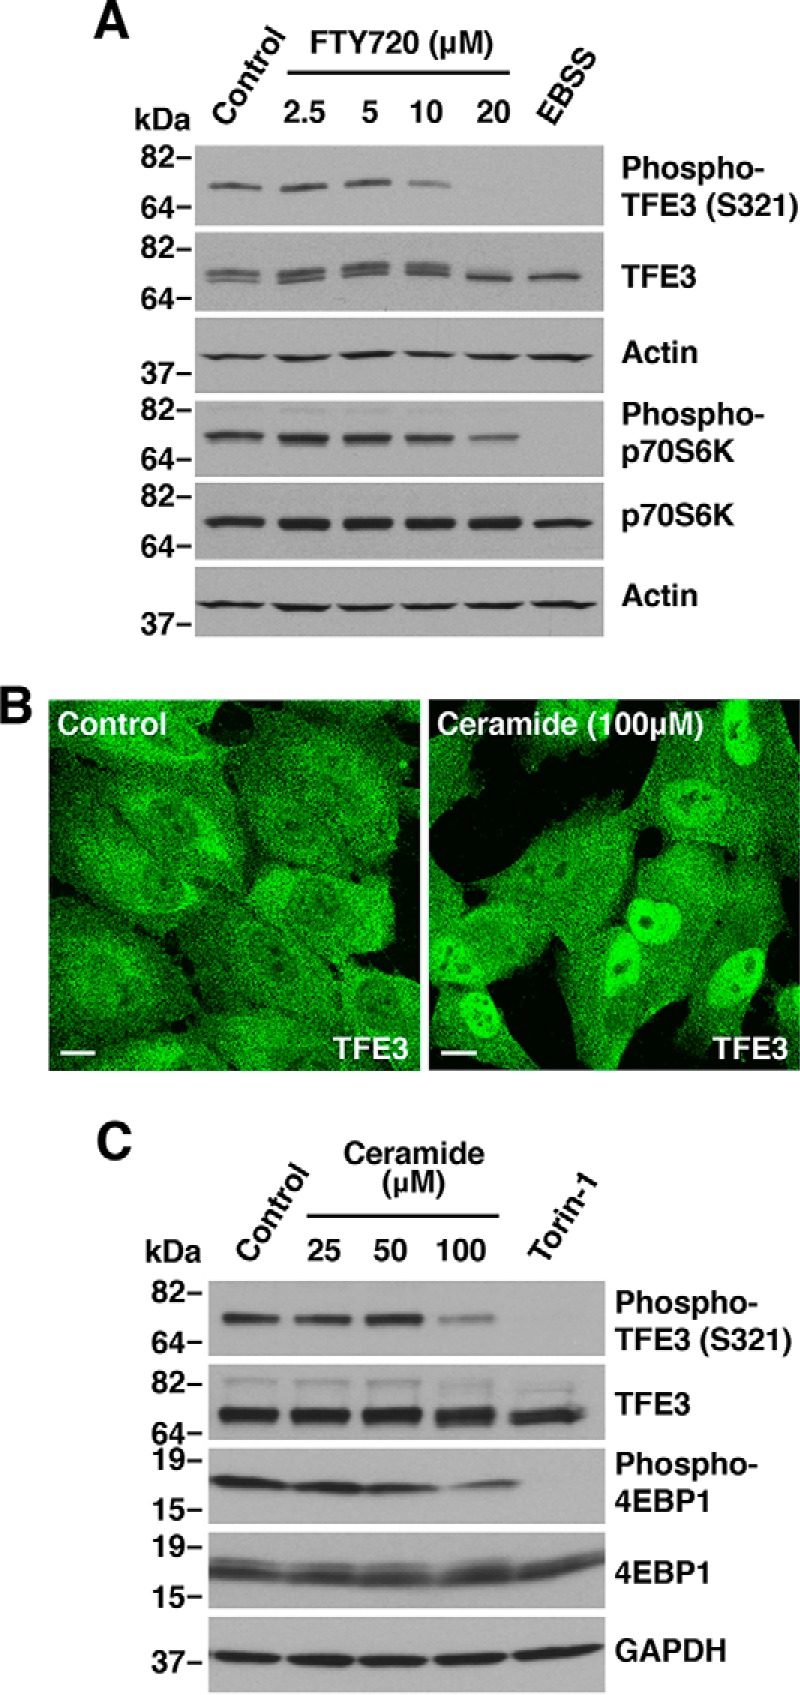
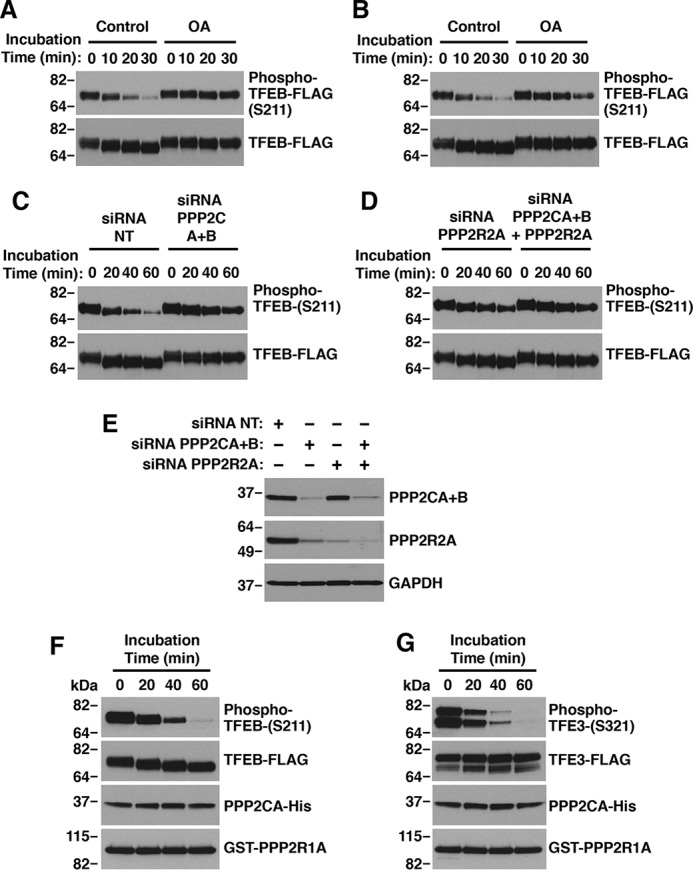
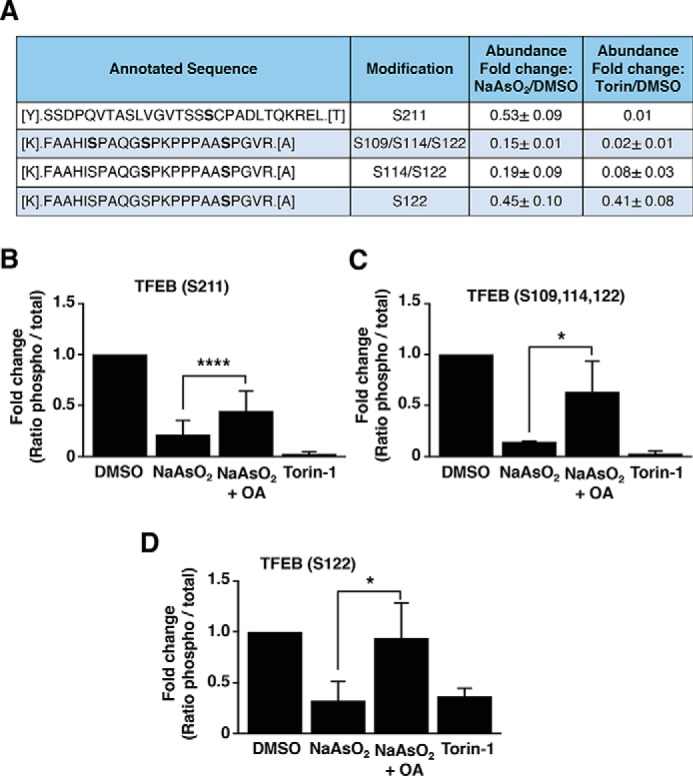
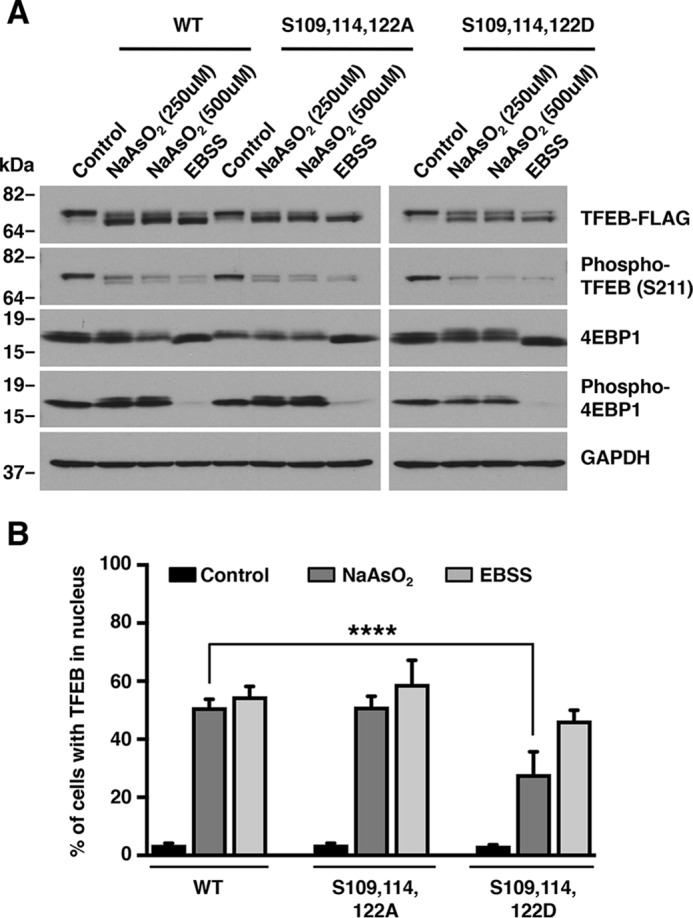
Adaptations and responses to stress conditions are fundamental processes that all cells must accomplish to maintain or restore cellular homeostasis. Cells have a plethora of response pathways to mitigate the effect of different environmental stressors. The transcriptional regulators transcription factor EB (TFEB) and transcription factor binding to IGHM enhancer 3 (TFE3) play a key role in the control of these stress pathways. Therefore, understanding their regulation under different stress conditions is of great interest. Here, using a range of human and murine cells, we show that TFEB and TFE3 are activated upon induction of acute oxidative stress by sodium arsenite via an mTOR complex 1 (mTORC1)-independent process. We found that the mechanism of arsenite-stimulated TFEB and TFE3 activation instead involves protein phosphatase 2A (PP2A)-mediated dephosphorylation at Ser-211 and Ser-321, respectively. Depletion of either the catalytic (PPP2CA+B) or regulatory (PPP2R2A/B55α) subunits of PP2A, as well as PP2A inactivation with the specific inhibitor okadaic acid, abolished TFEB and TFE3 activation in response to sodium arsenite. Conversely, PP2A activation by ceramide or the sphingosine-like compound FTY720 was sufficient to induce TFE3 nuclear translocation. MS analysis revealed that PP2A dephosphorylates TFEB at several residues, including Ser-109, Ser-114, Ser-122, and Ser-211, thus facilitating TFEB activation. Overall, this work identifies a critical mechanism that activates TFEB and TFE3 without turning off mTORC1 activity. We propose that this mechanism may enable some cell types such as immune or cancer cells that require simultaneous TFEB/TFE3 and mTORC1 signaling to survive and achieve robust cell growth in stressful environments.

Keywords: mTORC1; nuclear translocation; okadaic acid; oxidative stress; phosphatase; protein phosphatase 2 (PP2A); sodium arsenite; transcription factor; transcription factor EB; transcription factor binding to IGHM enhancer 3.


Conflict of interest statement

The authors declare that they have no conflicts of interest with the contents of this article

Figures

Figure 1.
Figure 1.
Sodium arsenite activates TFE3 and TFEB independent of mTORC1 activity. A, ARPE19 cells treated with either vehicle or 250 μm NaAsO2 for 1 h were fixed, permeabilized, and immunostained with antibodies against TFE3. Scale bar, 10 μm. B, quantification of cells with TFE3 in nucleus in vehicle- or NaAsO2-treated ARPE19 cells as shown in A. Vehicle, n = 810; NaAsO2, n = 846 from three independent experiments. Error bars denote S.D. p value calculated using two-tailed t test, (****) p < 0.0001. C, immunoblot analysis of protein lysates from ARPE19 cells treated with the indicated concentrations of NaAsO2 for 1 h. D, immunoblot analysis of protein lysates from ARPE19 cells treated with either 250 μm NaAsO2 for the indicated times or EBSS for 1 h. E, immunoblot analysis of protein lysates from ARPE19 cells treated with either 250 μm NaAsO2 in the presence of 15 mm NAC or 250 nm Torin-1 for 1 h. F, ARPE19 cells treated with either vehicle or 250 μm NaAsO2 in the presence of 15 mm NAC for 1 h were fixed, permeabilized, and immunostained with antibodies against TFE3. Scale bar, 10 μm. G, immunoblot analysis of protein lysates from ARPE19 cells and treated with either 250 μm NaAsO2, 250 nm Torin-1 or EBSS for 1 h. H, immunoblot analysis of protein lysates from HeLa cells expressing TFEB-FLAG and treated as indicated in G. Samples were run on the same gel (irrelevant lanes were spliced out; see raw data). Immunoblots are representative of three independent experiments.
Figure 2.
Figure 2.
Sodium arsenite-induced TFE3 and TFEB activation is inhibited by okadaic acid. A, immunoblot analysis of protein lysates from ARPE19 cells treated with 250 μm NaAsO2 in the presence of the indicated concentration of Calcineurin inhibitor FK506 for 1 h. B, immunoblot analysis of protein lysates from a MLIV patient and unrelated nondiseased fibroblasts treated with 250 μm NaAsO2 for 1 h. C and D, immunoblot analysis of protein lysates from ARPE19 cells and HeLa (CF7) cells treated with 250 μm NaAsO2 in the presence of the indicated concentration of okadaic acid for 1 h. E, ARPE19 cells treated with either vehicle or 250 μm NaAsO2 for 1 h in the presence of 400 nm okadaic acid were fixed, permeabilized, and immunostained with antibodies against TFE3. Scale bar, 10 μm. F, quantification of cells with TFE3 in nucleus in either vehicle or NaAsO2 and okadaic acid-treated ARPE19 cells as shown in E. Vehicle, n = 517; OA, n = 556 NaAsO2, n = 524; and NaAsO2 + OA, n = 548 from three independent experiments. Error bars denote S.D. p value was calculated using one-way ANOVA, (**) p < 0.01, (****) p < 0.0001. Immunoblots are representative of three independent experiments.
Figure 3.
Figure 3.
TFE3 is a substrate of protein phosphatase 2A but not protein phosphatase 1A. A, immunoblot analysis of protein lysates from ARPE19 cells depleted of either PPP2A or PPP1A and treated with 250 μm NaAsO2 for 1 h. B, quantification of phospho-TFE3/TFE3 ratios from ARPE19 cells depleted of either PPP2A or PPP1A and treated with 250 μm NaAsO2 for 1 h, as shown in A. Quantified results are fold-change of phospho-TFE3/TFE3 from its corresponding vehicle-treated cells. Data are presented as mean ± S.D. using one-way ANOVA, **, p < 0.01, from three independent experiments. C, immunoblot analysis of protein lysates from ARPE19 cells depleted of either PPP2A catalytic and regulatory subunits and treated with 250 μm NaAsO2 for 1 h. D, quantification of phospho-TFE3/TFE3 ratios from ARPE19 cells depleted of the PPP2A regulatory subunit and treated with 250 μm NaAsO2 for 1 h, as shown in C. Quantified results are fold-change of phospho-TFE3/TFE3 from its corresponding vehicle-treated cells. Data are presented as mean ± S.D. using two-tailed t test; **, p < 0.01, from three independent experiments. Immunoblots are representative of three independent experiments.
Figure 4.
Figure 4.
Protein phosphatase 2A dephosphorylation of TFE3 and TFEB. A, immunoblot analysis of protein lysates from ARPE19 cells treated with the indicated concentrations of FTY720 for 1 h. B, ARPE19 cells treated with vehicle or 100 μm C2-ceramide for 2 h were fixed, permeabilized, and immunostained with antibodies against TFE3. Scale bar, 10 μm. C, immunoblot analysis of protein lysates from ARPE19 cells treated with the indicated concentrations of C2-ceramide or 250 nm Torin-1 for 2 h. Immunoblots are representative of three independent experiments.
Figure 5.
Figure 5.
Protein phosphatase 2A dephosphorylates TFEB and TFE3 in vitro. A, in vitro dephosphorylation of TFEB with ARPE19 cell lysates in the presence of 400 nm okadaic acid. B, in vitro dephosphorylation of TFEB with ARPE19 cell lysates treated with 400 nm okadaic acid for 1 h. C and D, in vitro dephosphorylation of TFEB with ARPE19 cell lysates depleted of PP2A subunits. E, immunoblot analysis of protein lysates from ARPE19 cells depleted of either PPP2A catalytic and regulatory subunits. F and G, in vitro dephosphorylation of TFEB (G) or TFE3 (H) with recombinant purified PP2A subunits.
Figure 6.
Figure 6.
Protein phosphatase 2A dephosphorylates TFEB at different residues. A, mass spectrometry analysis of the phosphorylation status of TFEB-FLAG from U-2 OS cells treated with either vehicle, 150 μm NaAsO2 or 250 nm Torin-1 for 2 h. The relative abundances of the indicated phosphopeptides were compared based on the areas under curve of their corresponding chromatographic peaks and are shown as fold-change from its corresponding vehicle-treated cells. Data are presented as mean ± S.D. from two independent experiments. B–D, mass spectrometry analysis of the phosphorylation status of TFEB-FLAG in Ser-211 (B), Ser-109, -114, and -122 (C), and Ser-122 (D) from HeLa (CF7) cells treated with either vehicle or 300 μm NaAsO2 in the presence or absence of 400 nm okadaic acid or 250 nm Torin-1 for 1.5 h. The relative abundances of the indicated phosphopeptides were compared based on the areas under curve of their corresponding chromatographic peaks and are shown as fold-change from its corresponding vehicle-treated cells. Data are presented as mean ± S.D. using one-way ANOVA, (*) p < 0.05 and (****) p < 0.0001, from three independent experiments.
Figure 7.
Figure 7.
Dephosphorylation of TFEB at Ser-109, Ser-114, and Ser-122 facilitate its activation in response to oxidative stress. A, immunoblot analysis of protein lysates from ARPE19 cells expressing TFEB-WT or the indicated TFEB mutants and treated with either 250 μm NaAsO2 or EBSS for 1 h. Data are representative of at least three independent experiments. B, quantification of cells with TFEB in nucleus in ARPE19 cells expressing TFEB-WT or the indicated TFEB mutants and treated with either 250 μm NaAsO2 or EBSS for 1 h. TFEB-WT (vehicle, n = 654, NaAsO2, n = 687, and EBSS, n = 747), TFEB-S109A,S114A,S122A (vehicle, n = 643, NaAsO2, n = 671, and EBSS n = 669), and TFEB-S109D,S114D,S122D (vehicle, n = 651, NaAsO2, n = 671, and EBSS, n = 658) from three independent experiments are shown. Error bars denote S.D. p value was calculated using one-way ANOVA, (****) p < 0.0001.

Similar articles

Cited by

References

    1. Raben N., and Puertollano R. (2016) TFEB and TFE3: linking lysosomes to cellular adaptation to stress. Annu. Rev. Cell Dev. Biol. 32, 255–278 10.1146/annurev-cellbio-111315-125407 - DOI - PMC - PubMed
    1. Sardiello M., Palmieri M., di Ronza A., Medina D. L., Valenza M., Gennarino V. A., Di Malta C., Donaudy F., Embrione V., Polishchuk R. S., Banfi S., Parenti G., Cattaneo E., and Ballabio A. (2009) A gene network regulating lysosomal biogenesis and function. Science 325, 473–477 10.1126/science.1174447 - DOI - PubMed
    1. Settembre C., Di Malta C., Polito V. A., Garcia Arencibia M., Vetrini F., Erdin S., Erdin S. U., Huynh T., Medina D., Colella P., Sardiello M., Rubinsztein D. C., and Ballabio A. (2011) TFEB links autophagy to lysosomal biogenesis. Science 332, 1429–1433 10.1126/science.1204592 - DOI - PMC - PubMed
    1. Martina J. A., Diab H. I., Lishu L., Jeong A. L., Patange S., Raben N., and Puertollano R. (2014) The nutrient-responsive transcription factor TFE3 promotes autophagy, lysosomal biogenesis, and clearance of cellular debris. Sci. Signal. 7, ra9 10.1126/scisignal.2004754 - DOI - PMC - PubMed
    1. Martina J. A., and Puertollano R. (2013) Rag GTPases mediate amino acid-dependent recruitment of TFEB and MITF to lysosomes. J. Cell Biol. 200, 475–491 10.1083/jcb.201209135 - DOI - PMC - PubMed

Publication types

MeSH terms

LinkOut - more resources