. 2018 Aug 6;215(8):2097-2113.
doi: 10.1084/jem.20180421. Epub 2018 Jun 26.

Ca2+-mitochondria axis drives cell division in hematopoietic stem cells

Affiliations
Free PMC article

Ca2+-mitochondria axis drives cell division in hematopoietic stem cells

Terumasa Umemoto et al. J Exp Med. .
Free PMC article

Abstract

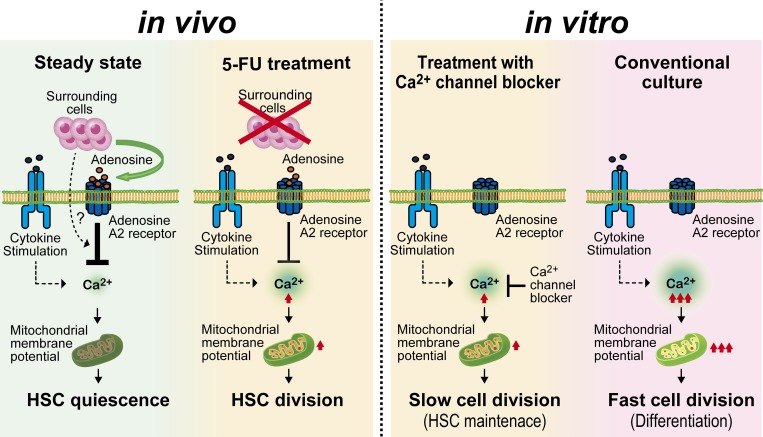
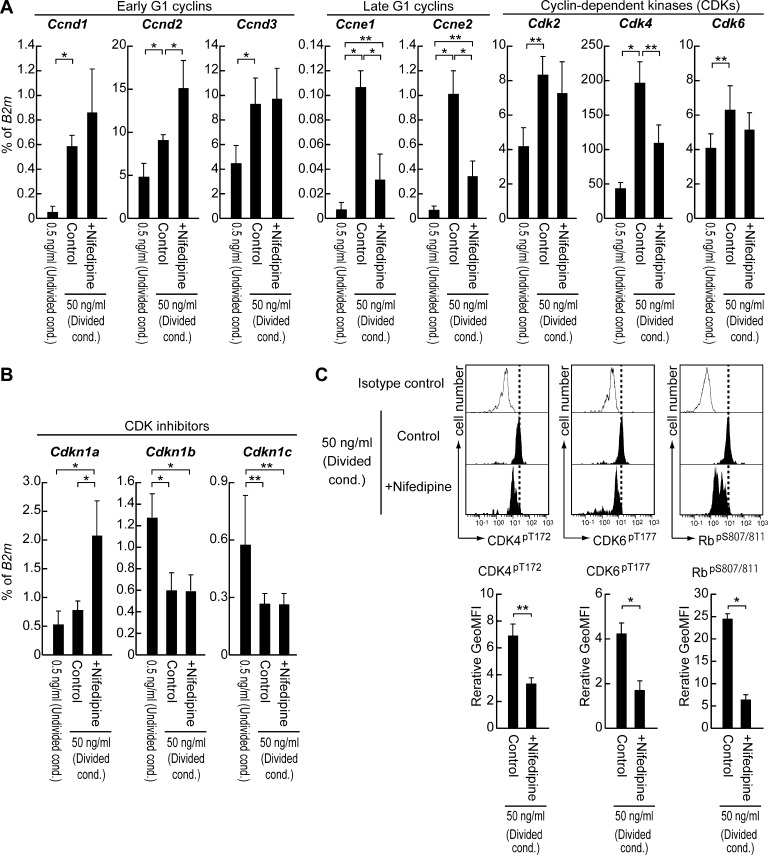
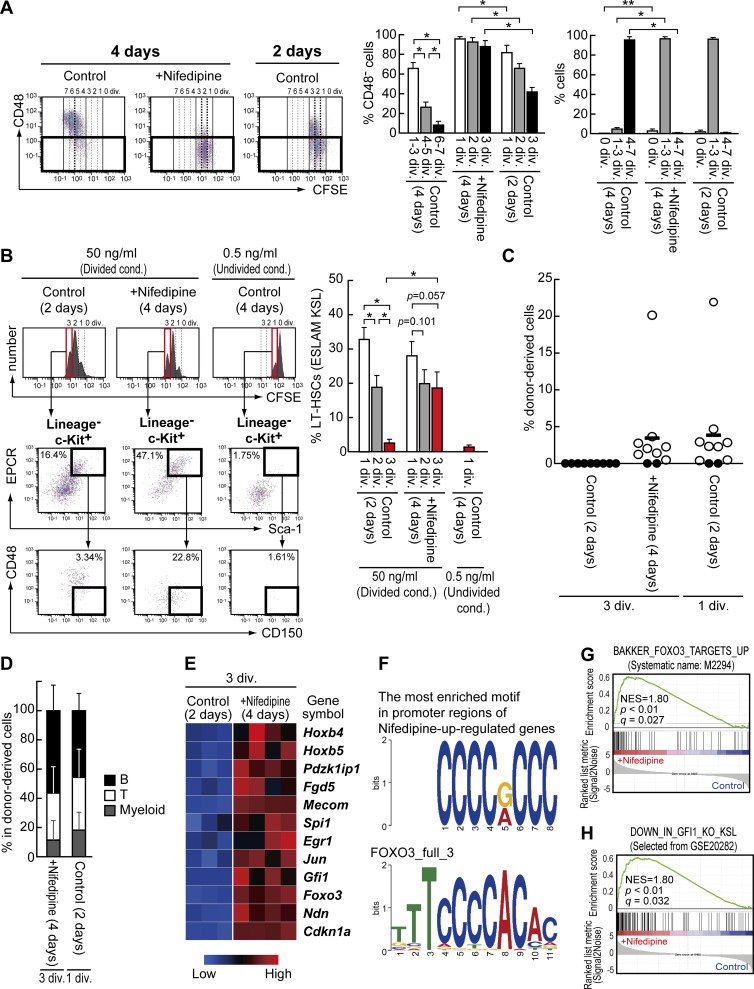
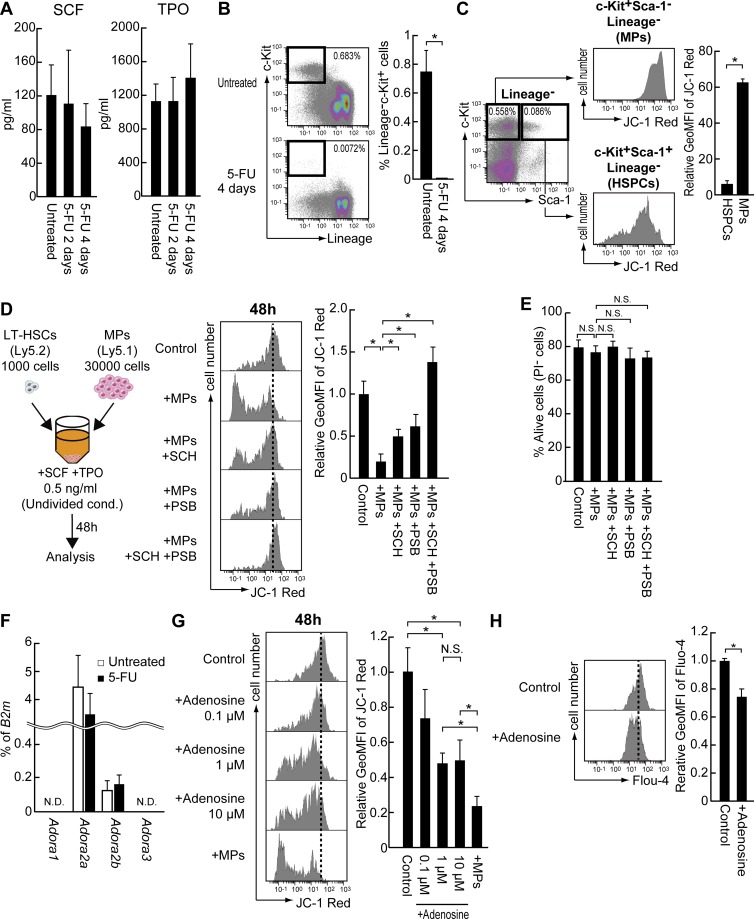
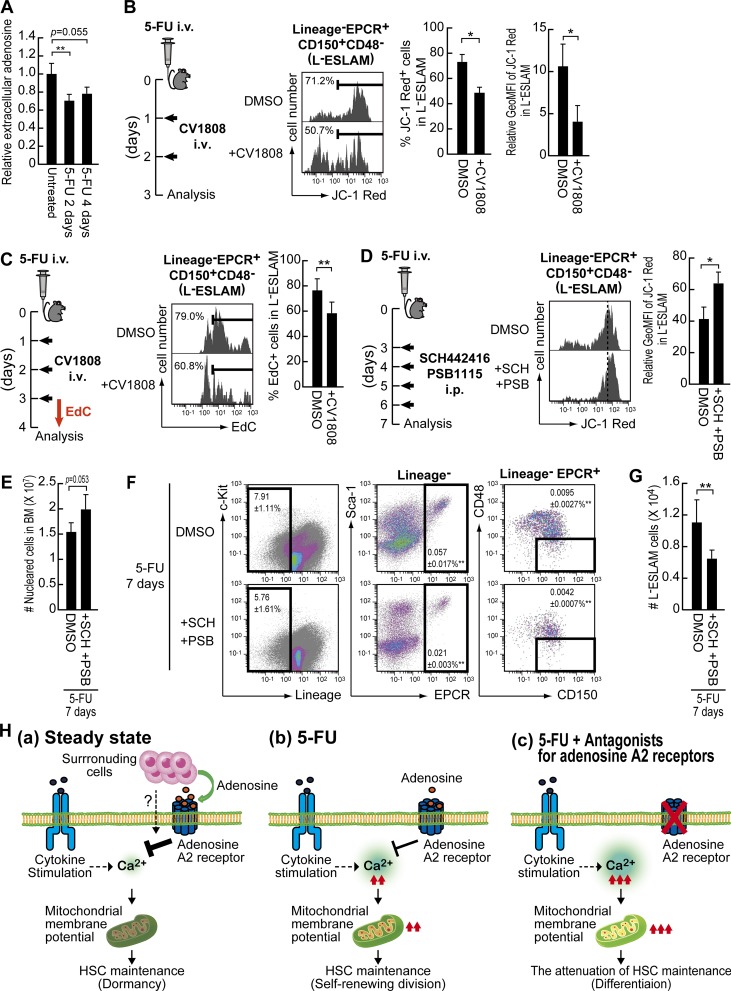
Most of the hematopoietic stem cells (HSCs) within the bone marrow (BM) show quiescent state with a low mitochondrial membrane potential (ΔΨm). In contrast, upon stress hematopoiesis, HSCs actively start to divide. However, the underlying mechanism for the initiation of HSC division still remains unclear. To elucidate the mechanism underlying the transition of cell cycle state in HSCs, we analyzed the change of mitochondria in HSCs after BM suppression induced by 5-fluoruracil (5-FU). We found that HSCs initiate cell division after exhibiting enhanced ΔΨm as a result of increased intracellular Ca2+ level. Although further activation of Ca2+-mitochondria pathway led to loss of HSCs after cell division, the appropriate suppression of intracellular Ca2+ level by exogenous adenosine or Nifedipine, a Ca2+ channel blocker, prolonged cell division interval in HSCs, and simultaneously achieved both cell division and HSC maintenance. Collectively, our results indicate that the Ca2+-mitochondria pathway induces HSC division critically to determine HSC cell fate.


Figures

None
Graphical abstract
Figure 1.
Figure 1.
Cycling HSCs appear in BM after 5-FU administration. (A and B) The frequency of SLAM KSL (A) or LESLAM fraction (B) within total BM in untreated mice or 5-FU–treated mice (250 mg/kg, i.v.; n = 4, two independent experiments). (C) Expression of Sca-1/c-Kit within LESLAM fraction in untreated mice or 5-FU–treated mice. Data are presented as means ± SD (n = 4, two independent experiments). (D–F) Experimental scheme for serial transplantation assay (D). After 20 wk from first or second transplantation, peripheral blood was analyzed. Each circle represents chimerism of donor-derived cells (% Ly5.2+ cells) in peripheral blood of each recipient mice in the plot, and bars indicate mean values (n > 9, two independent experiments; E). Graphs depict the frequency of each linage cells within donor-derived cells in the peripheral blood of recipient mice (F). Data are presented as means ± SD (n > 9, two independent experiments). (G and H) Kinetic changes of total nucleated cell number (G) and the absolute number of LESLAM HSCs (H) after 5-FU administration in BM obtained from both femurs and tibias (n = 5, three independent experiments). (I) The uptake of EdC for 24 h within LESLAM HSCs after the administration of EdC administration (150 mg/kg i.p.) into 5-FU–treated mice at indicated schedule. Data are presented as means ± SD (n = 4, four independent experiments; *, P < 0.01; **, P < 0.05 by t test).
Figure 2.
Figure 2.
HSCs show the enhancement of ΔΨm following increased intracellular Ca2+ level immediately before entering cell cycle. (A) GSEA following RNA-seq to compare between “cycling” HSCs derived from BM of 5-FU–treated mice (250 mg/kg, i.v. after 4 d) and “quiescent” HSCs derived from untreated mice (n = 4, two independent experiments). (B) Enrichment of energy metabolism–related genes within up-regulated gene in cycling HSCs. NES, normalized enrichment score; q value, false discovery rate. (C) Kinetic change of ΔΨm in LESLAM HSCs after 5-FU treatment. Histograms show the fluorescent intensity of JC-1 Red, which reflects the height of ΔΨm. Graphs depict the frequency of JC-1 Red+ cells (left) or relative fluorescent intensity of JC-1 Red (right) in LESLAM fraction (n = 4, four independent experiments). (D) Mitochondrial superoxide level in LESLAM HSCs of untreated or 5-FU–treated mice (250 mg/kg, i.v. after 4 d). Histograms show the fluorescent intensity of MitoSOX, a mitochondrial superoxide indicator (n = 4, two independent experiments). (E) ATP content in LESLAM HSCs in untreated or 5-FU–treated mice (250 mg/kg, i.v. after 4 d). Data are expressed as the mean ± SD (n = 4, two independent experiments). (F and G) Kinetic changes of intracellular (F) or mitochondrial Ca2+ concentration (G) in LESLAM HSCs after 5-FU administration. Histograms show the fluorescent intensity of Fluo-4 (intracellular Ca2+ level) or Rhod-2 (mitochondrial Ca2+ level). Data are expressed as the mean ± SD (n = 4, two independent experiments; *, P < 0.01; **, P < 0.05 by t test).
Figure 3.
Figure 3.
Ca2+ channel blocker suppresses cell division of HSCs through the down-regulation of ΔΨm. (A) The frequency of divided SLAM KSL HSCs after single cell culture for 24 or 48 h (n = 4, four independent experiments). (B and C) ΔΨm (B) or viability of HSCs (C) after the culture for 48 h under conditions as described above. Each value of ΔΨm was relative to the value of uncultured HSCs (n = 5, three independent experiments). (D and F) Intracellular (D) or mitochondrial Ca2+ level (F) of HSCs cultured under indicated conditions. Data are presented as means ± SD relative to the value of cells treated with SCF and TPO at 0.5 ng/ml (undivided conditions; n > 3, two independent experiments). (E) The plot showing the relationship between ΔΨm and intracellular Ca2+ level after 18 h culture under indicated conditions. R represents the correlation coefficient. (G and H) Intracellular Ca2+ level (G) or ΔΨm (H) of HSCs cultured with SCF and TPO at 50 ng/ml (divided conditions) in the absence (Control) or presence of 60 µM Nifedipine (+Nifedipine). Data are presented as means ± SD relative to the value of cells treated with SCF and TPO at 0.5 ng/ml (undivided conditions; n = 4, two independent experiments). (I and J) The effect of Nifedipine on HSC division. Single cell culture (I) and CFSE-dilution assay (J) were performed under conditions described above. Data are presented as means ± SD (n = 4, four independent experiments; *, P < 0.01; **, P < 0.05 by t test).
Figure 4.
Figure 4.
Expression of cell cycle related genes is altered by the treatment with Ca2+ channel blocker in HSCs. (A and B) After the culture of sorted CD150+CD48KSL HSCs for 18 h under undivided conditions (0.5 ng/ml SCF and TPO) or divided conditions (50 ng/ml SCF and TPO) in the absence (Control) or presence of 60 µM Nifedipine (+Nifedipine), expression of Cyclins or cyclin-dependent kinase (CDKs; A) and CDK inhibitors (B) was examined by RT-PCR. Graphs depict mRNA expression level normalized by B2m expression (n = 6, two independent experiments). (C) After culturing CD150+CD48KSL HSCs for 18 h under divided conditions (50 ng/ml SCF and TPO) in the absence (Control) or presence of 60 µM Nifedipine (+Nifedipine), phosphorylation of CDK4 at Thr172, CDK6 at Thr177 or Rb at Ser807/811 was examined by flow cytometry. Each graph depicts geometric mean fluorescence intensity (GeoMFI) relative to the value of cells stained with isotype control. Data are presented as means ± SD (n = 3, three independent experiments; *, P < 0.01; **, P < 0.05 by t test).
Figure 5.
Figure 5.
Ca2+ channel blocker maintains functional HSCs through up-regulating expression of HSC regulators. (A and B) HSC phenotypes after HSC divisions in the absence (Control) or presence of 60 µM Nifedipine (+Nifedipine) for 4 or 2 d. Graphs depict the frequency of CD48 cells (A; left), cell division number (A; right) or the frequency of ESLAM LSK cells (B). The percentage in each dot plot represent the frequency of indicated fractions within one cell–division or three cell–division populations (B). Data are presented as means ± SD (n = 4, four independent experiments). (C and D) Transplantation assay using 50 cells derived from three-divided populations (Ly5.1) after the culture as described above, along with 2 × 10⁵ competitor cells (Ly5.2). Open or closed circles represent donor cell chimerism in multilineage-reconstructed recipient mice or unreconstructed mice after 20 wk in the plot, respectively (C). Bars indicate mean values (n > 9, two independent experiments). The graph depicts the frequency of each linage cells within donor-derived cells (D). Data are presented as means ± SD (n = 8, two independent experiments). (E–H) Gene expression analyses of three-divided ESLAM LSK HSCs after the culture as described above. RNA-Seq (heat map) revealed expression level of indicated genes (n > 3, two independent experiments, P < 0.01 EdgeR, q < 0.05 by FDR; E). The most enriched motif in the promoters of genes up-regulated by nifedipine (F; upper, E value = 2.2 × 10−84) which significantly resembles the FOXO3 binding motif (F; lower, q = 0.0492). Enrichment of Foxo3-targeted gene set “BAKKER_FOXO3_TARGETS_UP” (G) or Gfi1-dependent gene set “DOWN_IN_GFI1_KO_KSL” (H) within Nifedipine-up-regulated genes.
Figure 6.
Figure 6.
Extracellular adenosine acts as a regulator to regulate Ca2+–mitochondria pathway. (A) The amount of SCF or TPO within BM in untreated or 5-FU–treated mice. Data are expressed as the mean ± SD (n = 4, two independent experiments). (B) The frequency of lineagec-kit+ cells within total BM cells after 5-FU treatment (250 mg/kg, i.v; n = 4, two independent experiments). (C) ΔΨm of indicated fractions in untreated mice. Numbers in dot plots represent the frequency of gated cells within total BM cells. Data are presented as means ± SD relative to the value of LESLAM HSCs. (n = 4, two independent experiments). (D and E) ΔΨm (D) or viability (E) of HSCs after the co-culture of MPs (linagec-Kir+Sca-1) for 48 h in the absence or presence of 10 µM SCH442416 (SCH: Adora2a antagonist) and/or 10 µM PSB1115 (PSB: Adora2b antagonist). Cells cultured without both MPs and antagonists serve as control. n = 4, four independent experiments. (F) Expression of adenosine receptors in HSCs before and after 5-FU administration. Data are expressed as the mean ± SD relative to B2m expression (n = 4, two independent experiments by t test). (G and H) ΔΨm (G) or intracellular Ca2+ level (H) in HSCs after the culture with adenosine for 48 h or immediately after the stimulation (10 µM adenosine), respectively. Cells cultured without adenosine serve as control. Data are presented as means ± SD (n = 5, three independent experiments, *, P < 0.01 by t test [G]; n = 4, two independent experiments, *, P < 0.01 by t test [H]). N.S., not significant.
Figure 7.
Figure 7.
Extracellular adenosine contributes to the maintenance of HSCs during cell divisions after 5-FU administration. (A) The amount of adenosine within BM in untreated or 5-FU–treated mice (250 mg/kg i.v.; n = 4). (B and C) The effect of treatment with CV1808 (an agonist of adenosine A2 receptors; 3 mg/kg/shot i.v.) on HSC ΔΨm (B) or EdC uptake (C). Graphs depict the frequency of JC-1 Red+ cells (B; left), geometric mean fluorescence intensity relative to the value of untreated HSCs (B; right) or EdC+ cells within LESLAM HSCs (C). n = 3, two independent experiments; *, P < 0.01 by t test (B); n = 6, three independent experiments; **, P < 0.05 by t test (C). (D–G) The effect of the combination between SCH442416 (Adora2a antagonist; 6 mg/kg/shot i.p.) and PSB1115 (Adora2b antagonist; 6 mg/kg/shot i.p.) on HSCs after 5-FU administration. The graph shows ΔΨm of LESLAM cells relative to the value of untreated HSCs (D), total number of nucleated cells (E), or the number of LESLAM HSCs (G) within BM. Numbers in dot plots represent the frequency of each fraction within total BM cells (F). Data are presented as means ± SD (n = 4, two independent experiments). (H) Our proposed model. At steady-state, Ca2+–mitochondria pathway in quiescent HSCs is suppressed through extracellular adenosine provided by surrounding cells (a). 5-FU administration leads to self-renewal division through appropriately loosed adenosine-dependent suppression of Ca2+–mitochondria pathway (b). However, further inhibition of adenosine-mediated suppression attenuates the maintenance of HSCs through more activation of Ca2+–mitochondria pathway (c).

Comment in

  • Ca2+tapulting HSCs into action.
    Guitart AV, Finch AJ, Kranc KR. Guitart AV, et al. J Exp Med. 2018 Aug 6;215(8):1971-1973. doi: 10.1084/jem.20181097. Epub 2018 Jul 12. J Exp Med. 2018. PMID: 30002075 Free PMC article.

References

    1. Akada H., Akada S., Hutchison R.E., Sakamoto K., Wagner K.U., and Mohi G.. 2014. Critical role of Jak2 in the maintenance and function of adult hematopoietic stem cells. Stem Cells. 32:1878–1889. 10.1002/stem.1711 - DOI - PMC - PubMed
    1. Bailey T.L. 2011. DREME: motif discovery in transcription factor ChIP-seq data. Bioinformatics. 27:1653–1659. 10.1093/bioinformatics/btr261 - DOI - PMC - PubMed
    1. Baldridge M.T., King K.Y., Boles N.C., Weksberg D.C., and Goodell M.A.. 2010. Quiescent haematopoietic stem cells are activated by IFN-gamma in response to chronic infection. Nature. 465:793–797. 10.1038/nature09135 - DOI - PMC - PubMed
    1. Bidaux G., Borowiec A.S., Gordienko D., Beck B., Shapovalov G.G., Lemonnier L., Flourakis M., Vandenberghe M., Slomianny C., Dewailly E., et al. 2015. Epidermal TRPM8 channel isoform controls the balance between keratinocyte proliferation and differentiation in a cold-dependent manner. Proc. Natl. Acad. Sci. USA. 112:E3345–E3354. 10.1073/pnas.1423357112 - DOI - PMC - PubMed
    1. Chen J.Y., Miyanishi M., Wang S.K., Yamazaki S., Sinha R., Kao K.S., Seita J., Sahoo D., Nakauchi H., and Weissman I.L.. 2016. Hoxb5 marks long-term haematopoietic stem cells and reveals a homogenous perivascular niche. Nature. 530:223–227. 10.1038/nature16943 - DOI - PMC - PubMed

Publication types

MeSH terms