. 2018 Jul 10;115(28):E6437-E6446.
doi: 10.1073/pnas.1721085115. Epub 2018 Jun 26.

Gene expression distribution deconvolution in single-cell RNA sequencing

Affiliations

Gene expression distribution deconvolution in single-cell RNA sequencing

Jingshu Wang et al. Proc Natl Acad Sci U S A. .

Abstract

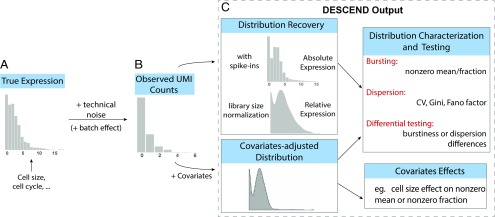
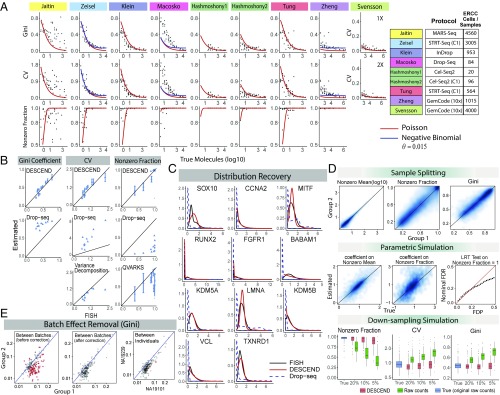
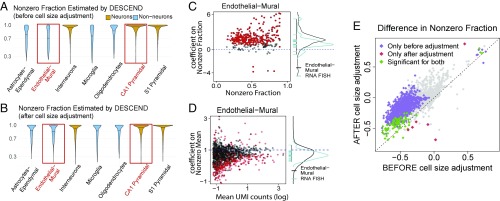
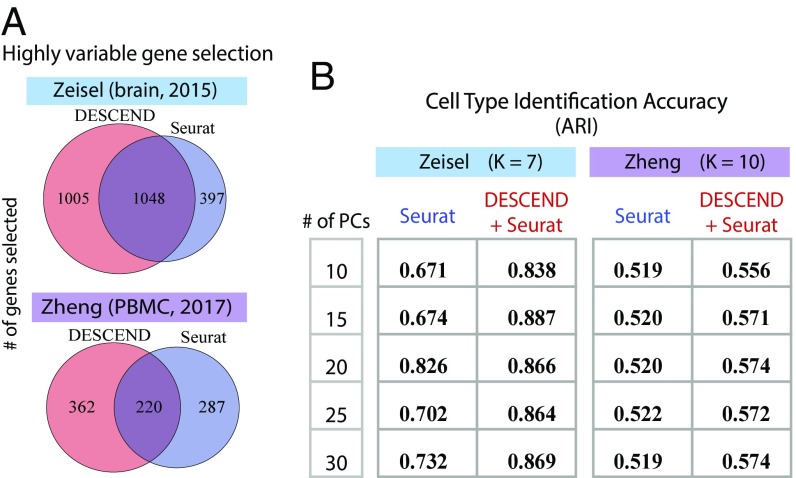
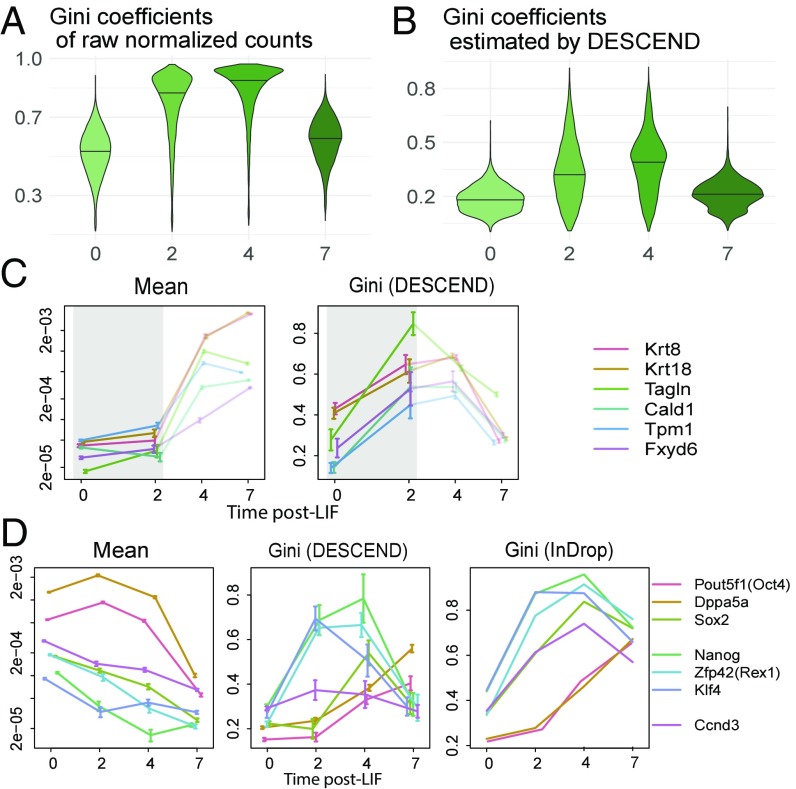
Single-cell RNA sequencing (scRNA-seq) enables the quantification of each gene's expression distribution across cells, thus allowing the assessment of the dispersion, nonzero fraction, and other aspects of its distribution beyond the mean. These statistical characterizations of the gene expression distribution are critical for understanding expression variation and for selecting marker genes for population heterogeneity. However, scRNA-seq data are noisy, with each cell typically sequenced at low coverage, thus making it difficult to infer properties of the gene expression distribution from raw counts. Based on a reexamination of nine public datasets, we propose a simple technical noise model for scRNA-seq data with unique molecular identifiers (UMI). We develop deconvolution of single-cell expression distribution (DESCEND), a method that deconvolves the true cross-cell gene expression distribution from observed scRNA-seq counts, leading to improved estimates of properties of the distribution such as dispersion and nonzero fraction. DESCEND can adjust for cell-level covariates such as cell size, cell cycle, and batch effects. DESCEND's noise model and estimation accuracy are further evaluated through comparisons to RNA FISH data, through data splitting and simulations and through its effectiveness in removing known batch effects. We demonstrate how DESCEND can clarify and improve downstream analyses such as finding differentially expressed genes, identifying cell types, and selecting differentiation markers.

Keywords: Gini coefficient; RNA sequencing; differential expression; highly variable genes; single-cell transcriptomics.


Conflict of interest statement

The authors declare no conflict of interest.

Figures

Fig. 1.
Fig. 1.
Illustration of the framework. (A and B) The cross-cell distribution of observed counts Ycg (B) is assumed to be a convolution of the distribution of true gene expression (A) and technical noise. (C) For each gene, the output of DESCEND includes the distribution of the absolute expression levels when spike-ins are available, the distribution of relative expression with library size normalization, the distribution of covariates-adjusted expression level if covariates are presented, estimates of the bursting and dispersion parameters, differential testing results comparing the change between two cell populations, and the effects of observed covariates on gene expression.
Fig. 2.
Fig. 2.
Validation of DESCEND. (A) Noise model. The Poisson-alpha model is tested using nine different ERCC UMI datasets. Svensson et al. (40) include datasets at two different concentrations. The black dots are estimated quantities (Gini, CV and nonzero fraction) from the deconvolved distribution of each spike-in gene. The two solid curves show expected values of these quantities under the Poisson distribution (red) and negative binomial distribution with fixed θ=0.015 (blue). (B) RNA FISH. Gini, CV, and nonzero fraction of 11 genes are compared between RNA FISH and the DESCEND estimates from Drop-seq counts (13). Values computed directly from observed counts and by other methods are also included. (C) FISH distribution recovery. Relative gene expression distribution is compared among RNA FISH distribution, DESCEND, and the distribution of Drop-seq observed counts. (D) Simulations. For sample splitting, estimated quantities are compared between the two split groups. For the parametric simulation, coefficients of the covariate cell are compared with the true values. The false discovery proportion (FDP) is compared with nominal FDR. For the down-sampling simulation, boxplots of estimated and “true” (original raw counts) values across genes are compared. (E) Batch effect removal in Tung et al. (29). The DESCEND-estimated Gini for each gene is compared between two replicates before (Left) and after (Center) adding batches as covariates and between two individuals (Right) after batch adjustment. The red dots are the significantly differential genes (of Gini) when FDR in controlled at level 5%.
Fig. 3.
Fig. 3.
Differential testing on nonzero fraction/mean as in Zeisel et al. (7). Violin plots of the estimated nonzero fractions are compared across cell types (A) before and (B) after adding cell size as a covariate. (C, Left) Estimated coefficients of cell size on nonzero fraction for genes whose nonzero fraction is significantly smaller than 1 and with estimated value less than 0.9 for the endothelial–mural cell population. (C, Right) Density of all of the dots in C, Left (black curve) aligned with the density curve of the coefficients of cell size on nonzero fraction for the RNA FISH data (blue). (D) Same as C, but for coefficients on nonzero mean and all of the genes. (E) Scatter plot for the difference of the estimated nonzero fraction between the endothelial–mural and CA1 pyramidal cells before and after cell-size adjustment. Significant genes are highlighted at FDR level 5%.
Fig. 4.
Fig. 4.
Selection of HVGs and cell type identification. (A) Venn diagram of the number of selected HVGs in Seurat and using DESCEND based on the Gini coefficient. (B) Comparison of cell type identification accuracy using Adjusted Rand Index (ARI) between the original Seurat and Seurat with the HVG selection step replaced by DESCEND.
Fig. 5.
Fig. 5.
Marker genes analysis using Gini as in Klein et al. (6). (A and B) Violin plots (with solid line indicating the 50% quantile) of Gini coefficients of raw normalized counts (A) and of the DESCEND-estimated Gini coefficients on each day (B). (C) Change of the mean relative expression and Gini coefficients for six epiblast marker genes across days. The colored error bars indicate 1 SE. (D) Change of the mean relative expression and Gini coefficients for pluripotency genes across days. For the Gini coefficients, one is estimated using DESCEND, and the other is calculated using raw normalized counts. The colored error bars indicate 1 SE.

References

    1. Spencer SL, Gaudet S, Albeck JG, Burke JM, Sorger PK. Non-genetic origins of cell-to-cell variability in TRAIL-induced apoptosis. Nature. 2009;459:428–432. - PMC - PubMed
    1. Raj A, van Oudenaarden A. Single-molecule approaches to stochastic gene expression. Annu Rev Biophys. 2009;38:255–270. - PMC - PubMed
    1. Tay S, et al. Single-cell NF-κB dynamics reveal digital activation and analog information processing in cells. Nature. 2010;466:267–271. - PMC - PubMed
    1. Loewer A, Lahav G. We are all individuals: Causes and consequences of non-genetic heterogeneity in mammalian cells. Curr Opin Genet Dev. 2011;21:753–758. - PMC - PubMed
    1. Shalek AK, et al. Single cell RNA Seq reveals dynamic paracrine control of cellular variation. Nature. 2014;510:363–369. - PMC - PubMed

Publication types