. 2018 Jul 10;115(28):E6526-E6535.
doi: 10.1073/pnas.1720798115. Epub 2018 Jun 26.

Evolutionary genomic dynamics of Peruvians before, during, and after the Inca Empire

Affiliations

Evolutionary genomic dynamics of Peruvians before, during, and after the Inca Empire

Daniel N Harris et al. Proc Natl Acad Sci U S A. .

Abstract

Native Americans from the Amazon, Andes, and coastal geographic regions of South America have a rich cultural heritage but are genetically understudied, therefore leading to gaps in our knowledge of their genomic architecture and demographic history. In this study, we sequence 150 genomes to high coverage combined with an additional 130 genotype array samples from Native American and mestizo populations in Peru. The majority of our samples possess greater than 90% Native American ancestry, which makes this the most extensive Native American sequencing project to date. Demographic modeling reveals that the peopling of Peru began ∼12,000 y ago, consistent with the hypothesis of the rapid peopling of the Americas and Peruvian archeological data. We find that the Native American populations possess distinct ancestral divisions, whereas the mestizo groups were admixtures of multiple Native American communities that occurred before and during the Inca Empire and Spanish rule. In addition, the mestizo communities also show Spanish introgression largely following Peruvian Independence, nearly 300 y after Spain conquered Peru. Further, we estimate migration events between Peruvian populations from all three geographic regions with the majority of between-region migration moving from the high Andes to the low-altitude Amazon and coast. As such, we present a detailed model of the evolutionary dynamics which impacted the genomes of modern-day Peruvians and a Native American ancestry dataset that will serve as a beneficial resource to addressing the underrepresentation of Native American ancestry in sequencing studies.

Keywords: Native American demography; fine-scale structure; gene flow; identity by descent; population history.


Conflict of interest statement

The authors declare no conflict of interest.

Figures

Fig. 1.
Fig. 1.
Population history of Peru. No later than 23,000 ya the Native American ancestral population diverged from East Asia and entered a period of isolation (7). Then, ∼16,000 ya the ancestral population began to populate the Americas (7). We inferred that the studied populations of the three geographic regions in Peru (Amazon, Andes, and coast) diverged from each other ∼12,000 ya. Before the Inca Empire, the Native American populations admixed with each other to form separate populations that would go on to form the mestizo populations. Migration did occur between all regions; however, we only represent the predominant asymmetrical patterns that shaped modern-day populations (Andes to other regions and coast to Amazon) and represent continuous migration starting during the pre-Inca timeframe and ending at Peruvian independence. The Spanish conquerors arrived in Peru in 1532; however, the majority of Spanish admixture did not occur until after Peruvian independence in 1824. At this time, the Spanish admixture was only with the prior admixed populations of different Native American ancestries to form the modern mestizo populations, while the Native American populations remained essentially isolated. The map at the right of the figure gives the sampling location of these populations and how they correspond to the three major areas indicated in the timeline. Purple shades represent Native American identifying populations and blue shades represent mestizo groups. The shapes on the map have no meaning.
Fig. 2.
Fig. 2.
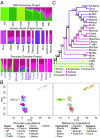
Peruvian population structure. (A) Admixture analysis (K = 7) of 1000 Genomes populations, Native American populations from the Human Genome Diversity Panel (HGDP), and all populations from the Peruvian Genome Project. The Peruvian Genome Project population labels are colored based on the self-identifying label of Native American (Purple) or mestizo (blue). The legend depicts our interpretation of the ancestry represented by each cluster. (B) ASPCA of combined Peruvian Genome Project samples with the HGDP. Samples are filtered by their Native American ancestral proportions: ≥50%. Each point represents one haplotype. (C) A tree, computed by TreeMix (47), using 1000 Genomes, HGDP, and Peruvian Genome Project samples is shown. Values represent the percent of bootstraps (n = 500) in which each node was formed. AP, Chopcc, Matsig, and Central Am are short for Afroperuvians, Chopccas, Matsiguenka, and Central America, respectively. The legend below the tree corresponds to the ancestry represented by each branch of the tree and our interpretation of each ancestral component in the ADMIXTURE analysis.
Fig. 3.
Fig. 3.
Admixture among Peruvian populations. (A) Colors represent contributions from donor populations into the genomes of Peruvian mestizo groups, as estimated by CHROMOPAINTER and GLOBETROTTER. The label within parentheses for each Peruvian Native American source population corresponds to their geographic region where Ama, And, and Coa represent Amazon, Andes, and coast, respectively. (B) Admixture time and proportion for the best fit three-way ancestry (AP, Trujillo and Lima) and two-way ancestry (Iquitos, Cusco, and Puno) TRACT models [European, African, and Native American (NatAm) ancestries] for six mestizo populations. (C) Network of individuals from Peruvian Native American and mestizo groups according to their shared IBD length. Each node is an individual and the length of an edge equals to (1/total shared IBD). IBD segments with different lengths are summed according to different thresholds representing different times in the past (52), with 7.8 cM, 9.3 cM, and 21.8 cM roughly representing the start of the Inca Empire, the Spanish conquest and occupation, and Peruvian independence. IBD networks are generated by Cytoscape (98) and only the major clusters in the network are shown for different cutoffs of segment length. AP, Central Am, and Matsig are short for Afroperuvians, Central American, and Matsiguenka, respectively. The header of each IBD network specifies the length of IBD segments used in each network.
Fig. 4.
Fig. 4.
Peruvian demography. (A) Effective diversity rates in Peru. Green represents areas of low diversity and purple high diversity. (B) Contemporary model of effective migration rates in Peru. Brown represents areas of low migration and blue areas of high migration. The legend details which populations are grouped into the different numbered demes on the map.

References

    1. Abecasis GR, et al. 1000 Genomes Project Consortium An integrated map of genetic variation from 1,092 human genomes. Nature. 2012;491:56–65. - PMC - PubMed
    1. Auton A, et al. 1000 Genomes Project Consortium A global reference for human genetic variation. Nature. 2015;526:68–74. - PMC - PubMed
    1. Gravel S, et al. 1000 Genomes Project Reconstructing Native American migrations from whole-genome and whole-exome data. PLoS Genet. 2013;9:e1004023. - PMC - PubMed
    1. Homburger JR, et al. Genomic insights into the ancestry and demographic history of South America. PLoS Genet. 2015;11:e1005602. - PMC - PubMed
    1. Skoglund P, et al. Genetic evidence for two founding populations of the Americas. Nature. 2015;525:104–108. - PMC - PubMed

Publication types

LinkOut - more resources