. 2018 Jul 25;38(30):6722-6736.
doi: 10.1523/JNEUROSCI.0324-18.2018. Epub 2018 Jun 26.

Endogenous Protection from Ischemic Brain Injury by Preconditioned Monocytes

Affiliations

Endogenous Protection from Ischemic Brain Injury by Preconditioned Monocytes

Lidia Garcia-Bonilla et al. J Neurosci. .

Abstract

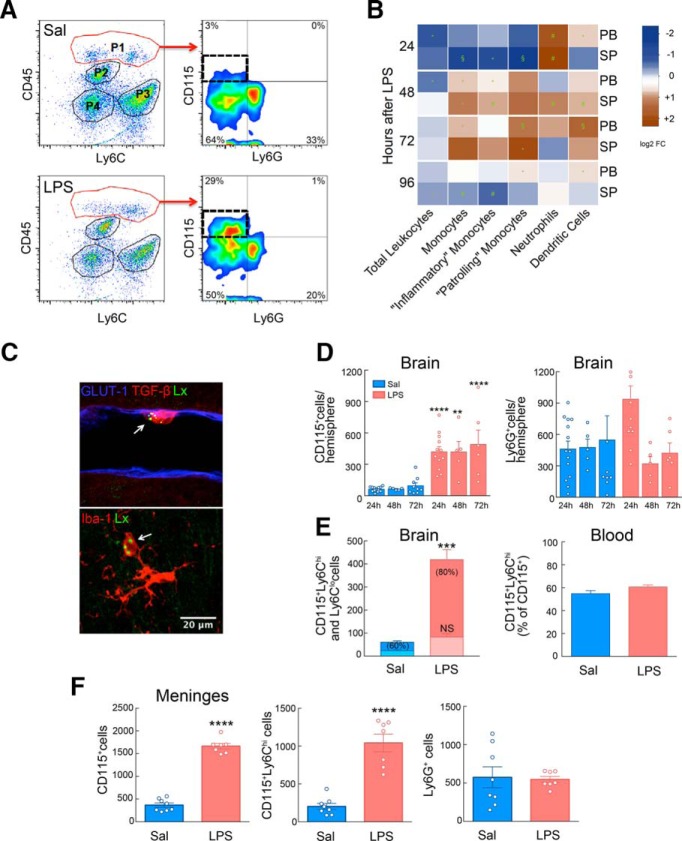
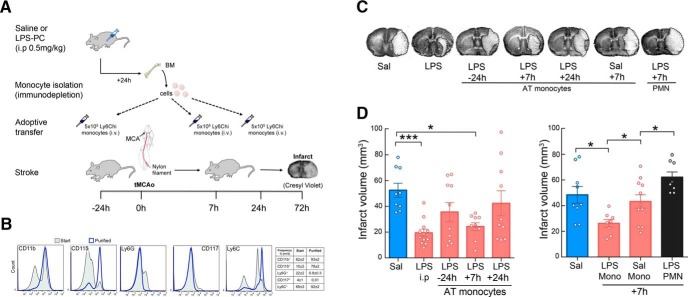
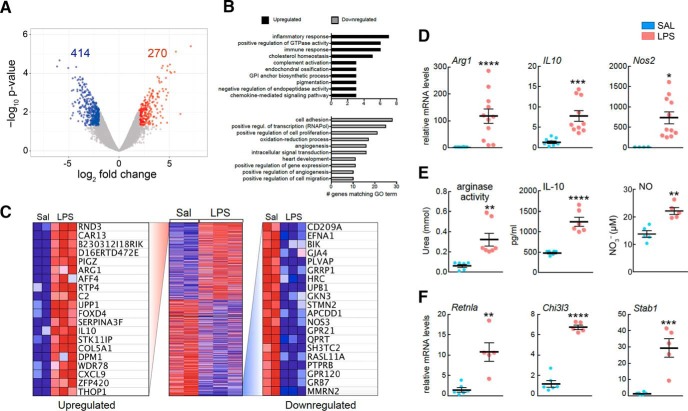
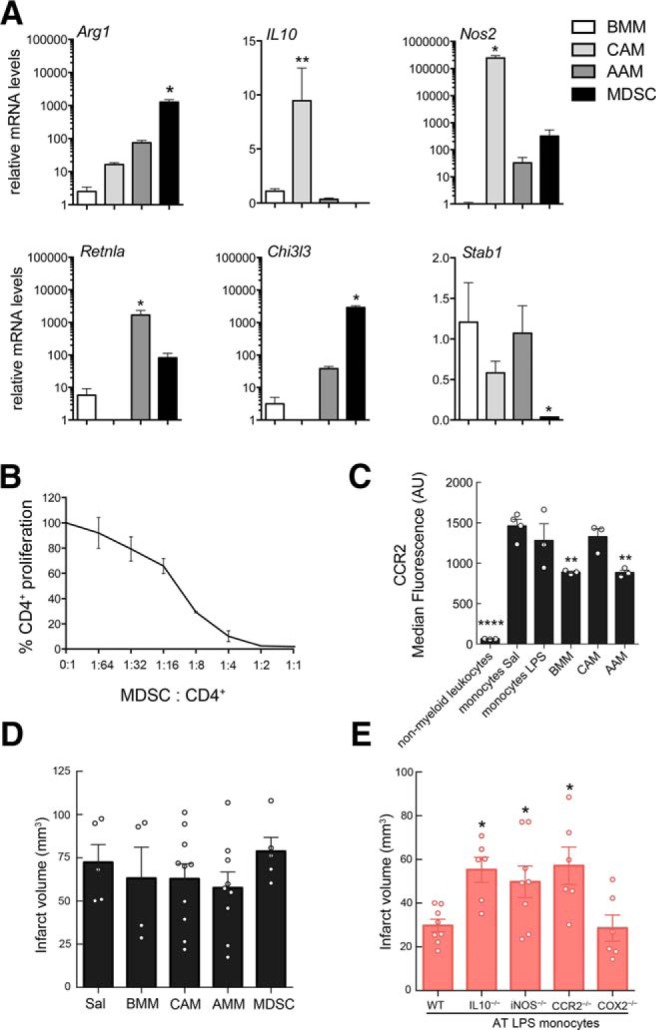
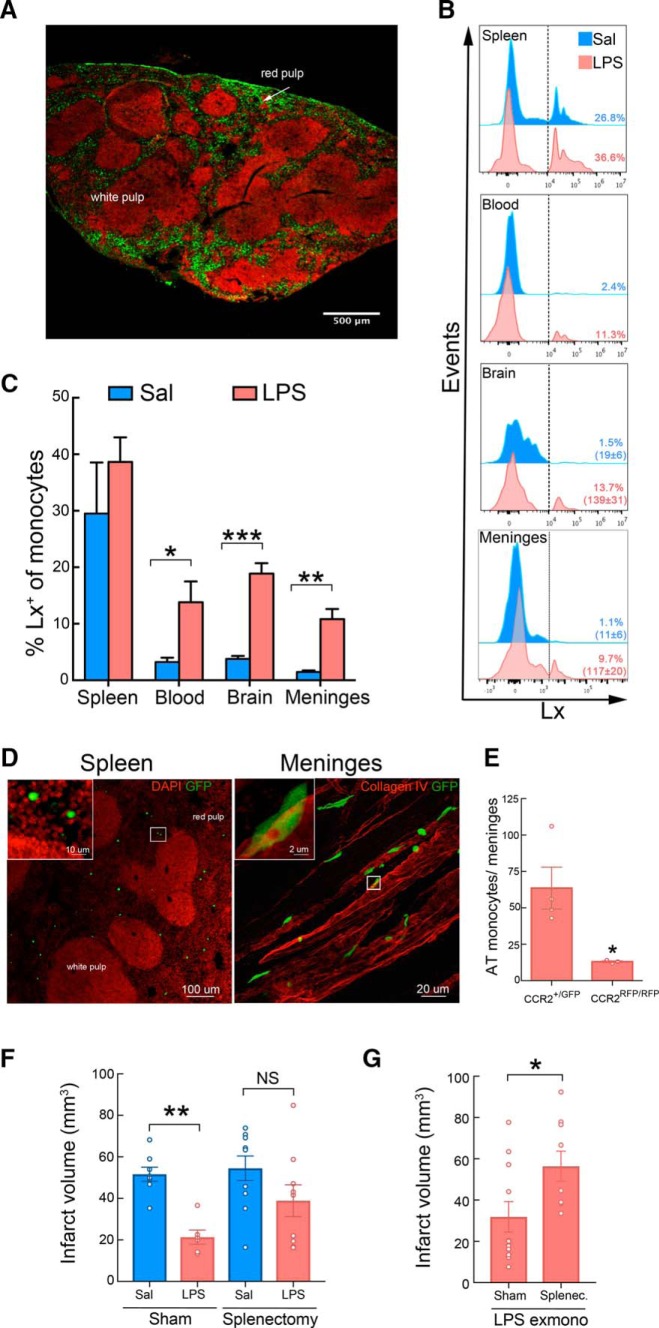
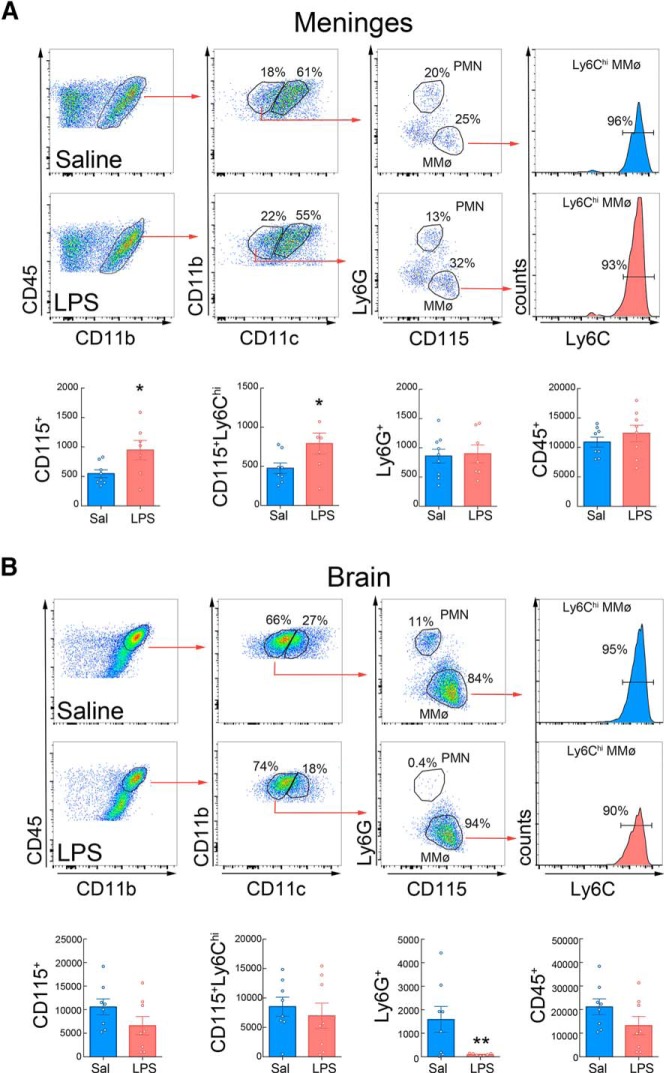
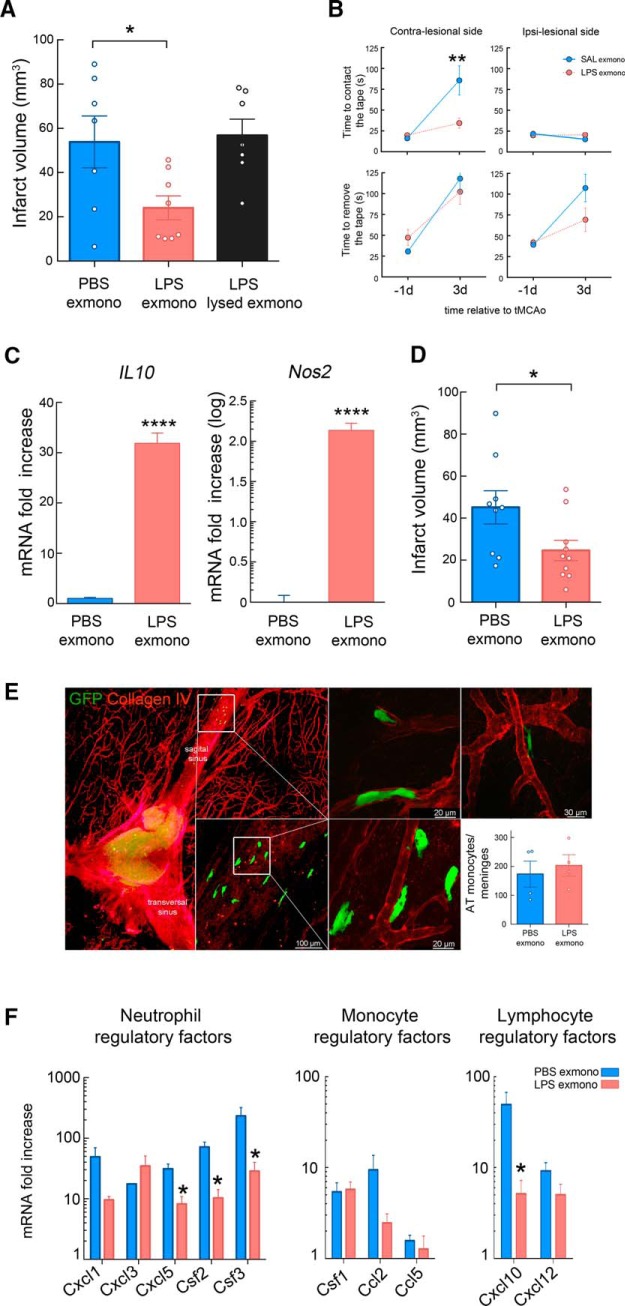
Exposure to low-dose lipopolysaccharide (LPS) before cerebral ischemia is neuroprotective in stroke models, a phenomenon termed preconditioning (PC). Although it is well established that LPS-PC induces central and peripheral immune responses, the cellular mechanisms modulating ischemic injury remain unclear. Here, we investigated the role of immune cells in the brain protection afforded by PC and tested whether monocytes may be reprogrammed by ex vivo LPS exposure, thus modulating inflammatory injury after cerebral ischemia in male mice. We found that systemic injection of low-dose LPS induces a Ly6Chi monocyte response that protects the brain after transient middle cerebral artery occlusion (MCAO) in mice. Remarkably, adoptive transfer of monocytes isolated from preconditioned mice into naive mice 7 h after transient MCAO reduced brain injury. Gene expression and functional studies showed that IL-10, inducible nitric oxide synthase, and CCR2 in monocytes are essential for neuroprotection. This protective activity was elicited even if mouse or human monocytes were exposed ex vivo to LPS and then injected into male mice after stroke. Cell-tracking studies showed that protective monocytes are mobilized from the spleen and reach the brain and meninges, where they suppress postischemic inflammation and neutrophil influx into the brain parenchyma. Our findings unveil a previously unrecognized subpopulation of splenic monocytes capable of protecting the brain with an extended therapeutic window and provide the rationale for cell therapies based on the delivery of autologous or allogeneic protective monocytes in patients after ischemic stroke.SIGNIFICANCE STATEMENT Inflammation is a key component of the pathophysiology of the brain in stroke, a leading cause of death and disability with limited therapeutic options. Here, we investigate endogenous mechanisms of protection against cerebral ischemia. Using lipopolysaccharide (LPS) preconditioning (PC) as an approach to induce ischemic tolerance in mice, we found generation of neuroprotective monocytes within the spleen, from which they traffic to the brain and meninges, suppressing postischemic inflammation. Importantly, systemic LPS-PC can be mimicked by adoptive transfer of in vitro-preconditioned mouse or human monocytes at translational relevant time points after stroke. This model of neuroprotection may facilitate clinical efforts to increase the efficacy of BM mononuclear cell treatments in acute neurological diseases such as cerebral ischemia.

Keywords: adoptive transfer; cerebral ischemia; lipopolysaccharide; monocytes; neuroprotection.


Figures

Figure 1.
Figure 1.
Systemic LPS-PC induces selective recruitment of inflammatory monocytes to brain and meninges. A, Flow cytometry analysis of isolated brain cells separated P1, P2, P3, and P4 populations based on CD45 and Ly6C expression. P1 identified infiltrating brain leukocytes (CD45hi) 24 h after LPS injection (0.5 mg/kg, i.p.); P2 corresponded to microglia (CD45intLy6C); P3 identified endothelial cells (CD45Ly6C+); and P4 corresponded to CD45Ly6C cells. Further analysis of CD115 and Ly6G expression on infiltrating leukocytes (P1) identified recruited monocytes (CD45hiCD115+Ly6G) and neutrophils (CD45hiCD115Ly6G+). An increase of infiltrating MMøs was observed in LPS-treated mice compared with saline-injected mice. B, Heat map analysis of leukocyte numbers in peripheral blood (PB) or spleen (SP) from LPS-treated mice over saline-injected mice. Frequencies of leukocyte populations were calculated for each tissue at 24, 48, 72, or 96 h after treatment. Log2 fold change was calculated for LPS over saline for each endpoint. Statistical analysis: unpaired two-tailed Student's t test, *p < 0.05; #p < 0.01; §p < 0.001. C, Representative images of CD115+Lx+ cells in the brain. Top image shows an Lx+ monocyte (green), stained for TGF-β (red), in close association to GLUT1-positive (blue) endothelial cells. Bottom image shows an Lx+ (green) and Iba1-intermediate (red) monocyte cell next to Iba1-high microglia with stellate morphology. D, CD115+ cells quantification in the brain indicated a sustained increase of MMøs in LPS-treated mice during the first 72 h after LPS injection. A transient increase in the Ly6G+ cell number was observed at 24 h in LPS-injected mice, although statistical changes were not found in brain neutrophils between saline and LPS treatment over the first 72 h (n = 5–14 mice/group). Statistical analysis: two-way ANOVA (interaction, F(2,44) = 0.07020, p = 0.9323; time, F(2,44) = 0.4909, p = 0.6154; treatment, F(1,44) = 55.76, p < 0.0001) followed by Sidak's post hoc test, **p < 0.05; ****p < 0.000. E, Left, Quantification of the total cell number of brain CD115+Ly6Chi (dark color) and CD115+Ly6Clo (light color) in saline- or LPS-treated mice 24 h after treatment. The percentage of CD115+Ly6Chi of the total CD115+ is given in brackets. Right, Percentage of blood inflammatory monocytes (CD115+Ly6Chi) in saline- or LPS-treated mice 24 h after treatment (n = 12–13 mice/group). Increased Ly6Chi number of MMøs was observed in the brains of LPS-treated mice. Statistical analysis: two-way ANOVA (interaction, F(1,46) = 31.16, p < 0.0001; treatment, F(1,46) = 69.33, p < 0.0001; subpopulation, F(1,46) = 37.92, p < 0.0001) followed by Sidak's post hoc test, ***p < 0.0001; NS, no statistical significance. F, Total MMø (CD115+) and inflammatory MMø (CD115+Ly6Chi) number was increased in meninges of mice 24 h after either saline (n = 8) or LPS (n = 7) injection. Neutrophils (Ly6G+) did not change. Statistical analysis: unpaired two-tailed Student's t test (t = 16.93, df = 13, ****p < 0.0001) for total CD115+ cells; unpaired two-tailed Student's t test (t = 7.207 df = 1, ****p < 0.0001) for CD115+Ly6Chi cells.
Figure 2.
Figure 2.
Adoptive transfer of LPS-primed monocytes isolated from preconditioned donors decreases infarct volume in stroke recipient mice. A, Experimental design for adoptive transfer of monocytes in stroke mice. Mice were injected with either LPS or saline and monocytes were isolated from BM by immunodepletion 24 h later. Saline or LPS monocytes (5 × 10⁵ monocytes/100 μl) were injected intravenously into stroke mice 24 h before transient MCAO or 7 or 24 h after MCAO. Infarct volume was determined by cresyl violet staining 72 h after MCAO. B, Isolated BM cells were stained for CD11b, CD115, Ly6G, CD117, and Ly6C markers before (start) and after (purified) immunodepletion. Stained cells were assayed by flow cytometry. Monocytes were isolated with high purity as evidenced by the expression of CD11b, CD115, and Ly6C markers and lack of expression of the neutrophil marker Ly6G and the hematopoietic stem cell marker CD117. C, Representative images of brain infarcts in saline-injected mice (SAL), LPS-preconditioned mice (LPS), or mice that received monocytes isolated from LPS-preconditioned mice 24 h before MCAO (−24 h) or 7 or 24 h after MCAO (+7 h and +24 h, respectively). Mice that received monocytes from saline-injected mice are indicated as SAL +7 h and mice that received neutrophils isolated from LPS-injected mice are indicated as PMN +7 h. The infarct (pale areas) is outlined in brain coronal sections stained with cresyl violet 72 h after MCAO. AT, Adoptive transfer. D, Infarct volume was significant smaller in either LPS-preconditioned mice (LPS i.p.) or in mice receiving adoptively transferred LPS-monocytes at +7 h (n = 9–12). Statistical analysis: Kruskal–Wallis (H = 15.65, p = 0.0035) followed by Dunn's post hoc test. *p < 0.05; ***p < 0.001. E, Adoptive transfer of monocytes isolated from saline-injected mice or neutrophils (PMN) from LPS-preconditioned mice at +7 h after MCAO did not reduce infarct volumes (n = 8–11). Statistical analysis: one-way ANOVA F(3,32) = 7.747, p = 0.0006, followed by Holm–Sidak's post hoc test, *p < 0.05.
Figure 3.
Figure 3.
Transcriptomic analysis of brain-associated monocytes from LPS-preconditioned mice. A, Log2 fold-change versus p-value plot of microarray data analysis of gene expression in isolated brain MMøs from LPS-preconditioned mice over saline-treated mice (n = 2–3, n = 8–12), highlighting downregulated genes (blue, <4-fold) and upregulated genes (red, >4-fold). B, Gene Ontology (GO) analysis of gene expression revealed upregulation of genes associated with immune and inflammatory response, regulation of GTPase activity, and cholesterol homeostasis and downregulation of genes that are members of cell adhesion, cell proliferation, positive transcriptional regulation, and angiogenesis pathways. C, Heat map showing the top 20 genes upregulated and the top 20 genes downregulated in LPS versus saline (SAL)-treated mice. D, Quantification of Arg1, IL-10, and iNOS gene (Nos2) expression by qRT-PCR in mouse BM monocytes. Monocytes were isolated 24 h after LPS or SAL injection. Data are expressed as relative n-fold changes over SAL group. Arg1, IL-10, and Nos2 mRNA were significantly upregulated in LPS-primed monocytes. Statistical analysis: Arg1, Mann–Whitney test (U = 0, ****p < 0.0001); IL-10, Mann–Whitney test (U = 0, ****p < 0.0001); Nos2, unpaired two-tailed Student's t test (t = 2.895, df = 13, *p = 0.0125). E, Quantification of arginase activity by determination of urea, IL-10 protein level by ELISA assay, and iNOS activity by Griess reaction showing increased activities or protein level in BM monocytes of LPS-preconditioned mice compared with BM monocytes of saline-treated mice. Statistical analysis: urea, Mann–Whitney test (U = 0, **p < 0.0012); IL-10, unpaired two-tailed Student's t test (t = 6.749, df = 10, ****p < 0.0001); NO, unpaired two-tailed Student's t test (t = 4.83, df = 8, **p = 0.0013), respectively. F, Quantification of genes associated with alternatively activated macrophage polarization showing upregulated mRNA levels in BM monocytes isolated 24 h after LPS treatment over saline treatment. Statistical analysis: Retnla, unpaired two-tailed Student's t test (t = 4.371, df = 9, **p = 0.0018); Chi3l3, unpaired two-tailed Student's t test (t = 13.71, df = 9, ****p < 0.0001), Stab1, unpaired two-tailed Student's t test (t = 5.426, df = 9, ***p = 0.0004).
Figure 4.
Figure 4.
IL-10, iNOS, and CCR2 are required for the neuroprotection induced by LPS-primed monocytes. A, Quantification of Arg1, IL-10, iNOS (Nos2), Retnla, Chi3l3, and Stab1 gene expression in cultured BMMs, classical or alternative activated BMMs (CAMs and AAMs, respectively), and MDSCs by qRT-PCR. Statistical analysis: Kruskal–Wallis followed by Dunn's test versus BMMs; Arg 1 (H = 8.291, p = 0.0013), *p = 0.05; IL-10 (H = 10.97, p < 0.0001), **p = 0.01; Nos2 (H = 9.859, p = 0.003), *p = 0.05; Retnla (H = 9.929, p = 0.0012), *p = 0.05; Chi3l3 (H = 10.24, p = 0.006), *p = 0.05; Stab1 (H = 7.750, *p = 0.0286), *p = 0.05; n = 3–4/group. B, Increment cell numbers of splenic CD4+ cells were stimulated with anti-CD3 and anti-CD28 antibodies in the presence of MDSCs. Percentage of CD4+ T-cell proliferation was calculated to assess suppressor function (n = 2). x-axis values represent MDSC/splenic CD4+cell ratio. C, Quantification of the median fluorescence of CCR2 signal analyzed by flow cytometry of in nonmyeloid leukocytes, BM monocytes from saline (SAL)- or LPS-treated mice, cultured BMMs, and classical or alternative activated BMMs (CAMs and AAMs, respectively). Statistical analysis: one-way ANOVA F(5,13) = 26.13, p < 0.0001) followed by Holm–Sidak's post hoc test, **p < 0.01; ****p < 0.0001; n = 3–4/group. D, Infarct volumes of mice receiving BMM (+7 h post-MCAO), BMMs that underwent either classical (CAMs) or alternative (AAMs) activation, or BMMs that were polarized to MDSCs were not different from those of mice treated with saline (SAL) (n = 4–10 mice/group). Statistical analysis: Kruskal–Wallis (H = 2.833, p = 0.7257). E, Mice receiving monocytes (7 h after MCAO) isolated from IL-10−/−, iNOS−/−, or CCR2−/− LPS-preconditioned mice, but not from COX2−/− LPS-preconditioned mice, had larger infarcts compared with the mice receiving monocytes isolated from WT LPS-preconditioned mice (n = 6–8 mice/group). AT, Adoptive transfer. Statistical analysis: one-way ANOVA (F(3,32) = 4.175, p = 0.0040) followed by Holm–Sidak's post hoc test, *p < 0.05.
Figure 5.
Figure 5.
LPS induces trafficking of splenic monocytes to the brain and meninges. A, Representative image of the localization of Lx+ in the spleen 24 h after intrasplenic injection (1.8 × 10⁹ particles). The beads (green) accumulated in the MZ and subcapsular red pulp. Fluorescent nuclear staining with the TO-PRO-3 (red) was used to reveal the structural anatomy of the spleen (transverse section). B, C, Representative flow cytometry histograms (B) and quantification (C) of MMøs (CD115+ cells) showing the percentage of MMøs containing Lx+ in the spleen, blood, brain, and meninges 24 h after either LPS-PC or saline injection in mice (n = 3–4/group). Total number of Lx+CD115+ cells in the brain and meninges are given in brackets. Lx+ was injected into the spleen 7 h after saline or LPS treatment. Statistical analysis: unpaired two-tailed Student's t test, blood (t = 2.77, df = 6, *p = 0.0321), brain (t = 7.81, df = 6, ***p = 0.0002) and meninges (t = 5.22, df = 6, **p = 0.0019). D, Representative image of the spleen (left) and meninges (right) from mice that underwent 24 h of MCAO and received GFP+ monocytes (5 × 10⁵ cells, i.v.) isolated from LPS-preconditioned mice at 7 h after MCAO. Transverse section of the spleen was stained with DAPI (red) for nuclear staining. Adoptively transferred monocytes accumulated in the red pulp of the spleen. In the meninges, monocytes were associated with meningeal blood vessel revealed by collagen IV (red) immunohistochemistry. E, Quantification of adoptively transferred monocytes (AT) in the meninges of WT mice 24 h after MCAO. Mice received either GFP+CCR2+/+ monocytes (CCR2+/GFP) or RFP+CCR2−/− monocytes (CCR2RFP/RFP; 5 × 10⁵ cells, i.v.) isolated from GFP-WT or CCR2RFP/RFP LPS-preconditioned mice, respectively. GFP or RFP fluorescence was used to track transferred BM monocytes (n = 4 mice/group). The genetic deletion of CCR2 resulted in a decrease of meninge-associated monocytes. Statistical analysis: unpaired two-tailed Student's t test, blood (t = 2.96, df = 5, *p = 0.0315). F, Infarct volume analysis in either sham-operated (Sham) or splenectomized (Splenectomy) mice that received saline or LPS treatment (i.p.) 24 h before MCAO. Sham-operated mice treated with LPS showed reduction of infarct volume, whereas no statistical significances were observed between splenectomized mice treated with saline (SAL) or LPS (n = 6–10 mice/group). Statistical analysis: one-way ANOVA (F(3,29) = 5.608, p = 0.0037) followed by Bonferroni's post hoc test, **p < 0.05. G, Infarct volume analysis in either sham-operated (Sham) or splenectomized (Splenectomy) mice that received ex vivo LPS-primed monocytes 7 h after MCAO (LPS exmono). Sham-operated mice had significant smaller infarcts than splenectomized mice (n = 9–11 mice/group). Statistical analysis: Mann–Whitney test (U = 0.03 *p < 0.05).
Figure 6.
Figure 6.
LPS-PC increases meningeal monocyte/macrophages and decreases brain neutrophil recruitment after MCAO. Flow cytometry analysis of immune cell infiltration in the meninges (A) and the brain (B) of saline or LPS-preconditioned mice 48 h after MCAO (n = 8 mice/group). Flow cytometry plots depict gating strategy. Infiltrating leukocytes (CD45hi) were phenotyped as MMøs (MMø) by high expression of CD11b and CD115 and low expression of CD11c and Ly6G (CD115+ cells). Inflammatory MMø were subclassified by high Ly6C expression (CD115+Ly6Chi). Neutrophils (PMN) were identified by high expression of CD11b and Ly6G and low expression of CD11c and CD115 (Ly6G+ cells). A, Graph plots show increased inflammatory MMø (CD115+ and CD115+Ly6Chi cells) in the meninges of LPS-preconditioned mice following MCAO. Statistical analysis: CD115+, unpaired two-tailed Student's t test, blood (t = 2.381, df = 13, *p = 0.0332); CD115+Ly6Chi, unpaired two-tailed Student's t test, blood (t = 2.186, df = 13, *p = 0.0477); B. Graph plots show decreased brain neutrophils (PMN) in LPS-preconditioned mice following MCAO. Statistical analysis: Ly6G+, unpaired two-tailed Student's t test, blood (t = 2.502, df = 13, *p = 0.0265).
Figure 7.
Figure 7.
Adoptive transfer of ex vivo LPS-primed mouse and human monocytes exerts protection in recipient mice after MCAO. A, Infarct volume analysis in mice that adoptively received ex vivo PBS-treated monocytes (PBS exmono), LPS-treated (LPS; 100 ng/ml, 2 h) monocytes (LPS exmonno), or lysed LPS-treated monocytes 7 h after MCAO (LPS lysed exmono). Mice receiving ex vivo LPS-primed monocytes showed reduction of infarct volume (n = 7–8 mice/group). Statistical analysis: one-way ANOVA F(2,19) = 4.933, p = 0.0188), followed by Bonferroni's post hoc test, *p < 0.05. B, Assessment of sensorimotor function by tape test performance revealed that mice receiving ex vivo LPS-primed monocytes had reduced latency to contact the tape on the impaired paw (contralesional side) than mice receiving PBS-treated monocytes at 3 d after MCAO (n = 13 mice/group). Statistical analysis: two-way ANOVA (interaction, F(1,49) = 7.828, p = 0.0073; treatment, F(1,49) = 5.915, p = 0.0187; time, F(1,49) = 18.4, p < 0.0001) followed by Sidak's post hoc test, **p < 0.01. C, Quantification of IL-10 and Nos2 (iNOS) expression by qRT-PCR of ex vivo PBS- or LPS-treated monocytes showed upregulation of both genes 2 h after LPS treatment (n = 4/group). Statistical analysis: unpaired two-tailed Student's t test, IL-10 (t = 15.19, df = 6, ****p < 0.0001) and Nos2 (t = 16, df = 5, ****p < 0.0001). D, Infarct volume analysis in stroke mice receiving ex vivo PBS- or LPS-treated human monocytes 7 h after MCAO. LPS-primed human monocytes significantly reduced infarct volumes after MCAO compared with mice receiving PBS-primed human monocytes (n = 9–10 mice/group). Statistical analysis: unpaired two-tailed Student's t test (t = 2.267, df = 17, *p = 0.0367). E, Histology of the meninges after adoptive transfer of GFP+ monocytes ex vivo treated with LPS. Monocytes transferred 7 h after MCAO were recruited to the meninges, where they associated with vessels (extravascular and intravascular localization) identified by collagen IV expression. The graph shows the number of adoptively transferred monocytes (AT) that accumulated in the meninges at 48 h MCAO of mice that received either PBS or LPS ex vivo-treated GFP+ monocytes. No difference in the number of accumulated monocytes was found between groups (n = 4 mice/group). Statistical analysis: unpaired two-tailed Student's t test (t = 0.5148, df = 6, p = 0.6251). F, Gene expression of inflammatory molecules in the meninges of mice receiving ex vivo PBS- or LPS-primed monocytes 48 h after MCAO. Decreased Cxcl5, Csf2, Csf3, and Cxcl10 gene upregulation was observed in the meninges of mice receiving LPS-primed monocytes (n = 10–11 mice/group). Statistical analysis: unpaired two-tailed Student's t test, Cxcl5 (t = 3.6298, df = 7, *p = 0.0084); Csf2 (t = 4.4886, df = 7, *p = 0.0028); Csf3 (t = 2.6324, df = 7, *p = 0.0337), and Cxcl10 (t = 2.7547, df = 7, *p = 0.0283).

Similar articles

Cited by

References

    1. A-Gonzalez N, et al. (2013) The nuclear receptor LXRα controls the functional specialization of splenic macrophages. Nat Immunol 14:831–839. 10.1038/ni.2622 - DOI - PMC - PubMed
    1. Ahmed SH, He YY, Nassief A, Xu J, Xu XM, Hsu CY, Faraci FM (2000) Effects of lipopolysaccharide priming on acute ischemic brain injury. Stroke 31:193–199. 10.1161/01.STR.31.1.193 - DOI - PubMed
    1. Ajmo CT Jr, Vernon DO, Collier L, Hall AA, Garbuzova-Davis S, Willing A, Pennypacker KR (2008) The spleen contributes to stroke-induced neurodegeneration. J Neurosci Res 86:2227–2234. 10.1002/jnr.21661 - DOI - PMC - PubMed
    1. Arnold L, Henry A, Poron F, Baba-Amer Y, van Rooijen N, Plonquet A, Gherardi RK, Chazaud B (2007) Inflammatory monocytes recruited after skeletal muscle injury switch into antiinflammatory macrophages to support myogenesis. J Exp Med 204:1057–1069. 10.1084/jem.20070075 - DOI - PMC - PubMed
    1. Auffray C, Fogg D, Garfa M, Elain G, Join-Lambert O, Kayal S, Sarnacki S, Cumano A, Lauvau G, Geissmann F (2007) Monitoring of blood vessels and tissues by a population of monocytes with patrolling behavior. Science 317:666–670. 10.1126/science.1142883 - DOI - PubMed

Publication types

Substances