. 2018 Sep;59(9):1671-1684.
doi: 10.1194/jlr.M085910. Epub 2018 Jun 26.

Host lipidome analysis during rhinovirus replication in HBECs identifies potential therapeutic targets

Affiliations

Host lipidome analysis during rhinovirus replication in HBECs identifies potential therapeutic targets

An Nguyen et al. J Lipid Res. 2018 Sep.

Abstract

In patients with asthma or chronic obstructive pulmonary disease, rhinovirus (RV) infections can provoke acute worsening of disease, and limited treatment options exist. Viral replication in the host cell induces significant remodeling of intracellular membranes, but few studies have explored this mechanistically or as a therapeutic opportunity. We performed unbiased lipidomic analysis on human bronchial epithelial cells infected over a 6 h period with the RV-A1b strain of RV to determine changes in 493 distinct lipid species. Through pathway and network analysis, we identified temporal changes in the apparent activities of a number of lipid metabolizing and signaling enzymes. In particular, analysis highlighted FA synthesis and ceramide metabolism as potential anti-rhinoviral targets. To validate the importance of these enzymes in viral replication, we explored the effects of commercially available enzyme inhibitors upon RV-A1b infection and replication. Ceranib-1, D609, and C75 were the most potent inhibitors, which confirmed that FAS and ceramidase are potential inhibitory targets in rhinoviral infections. More broadly, this study demonstrates the potential of lipidomics and pathway analysis to identify novel targets to treat human disorders.

Keywords: ceramidase; fatty acid synthase; human bronchial epithelial cells; lipidomics.


Conflict of interest statement

Additional support was provided by the National Heart and Lung Institute (student funding to A.G.) and Medical Research Council Centre Grant G10000758 (to the Medical Research Council and Asthma United Kingdom Centre in Allergic Mechanisms of Asthma of which A.M., A.G., D.S., and R.S. were members).

Figures
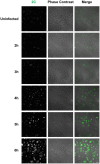
Fig. 1.
Fig. 1.
Infection of primary HBECs with RV-A1b. Confluent primary HBECs were infected with RV-A1b at an MOI of 20 for 1 h. After unbound virus removal, replication proceeded for up to 6 hpi. Cells were fixed and processed for confocal microscopy by staining with anti-RV 2C protein. Each column shows the 2C staining, the phase contrast, and merged images. Scale bar represents 50 μm.
Fig. 2.
Fig. 2.
Changes in PC (A) and FA (B) structures during the 6 h viral replication time course. The figure shows changes in both acyl chain length and saturation of PC and FA, concentrations were normalized in each group to cell number. Each time point represents the mean ± SEM from three independent experiments performed in triplicate (n = 9) per time point. *P < 0.05 by Student’s t-test.
Fig. 2.
Fig. 2.
Changes in PC (A) and FA (B) structures during the 6 h viral replication time course. The figure shows changes in both acyl chain length and saturation of PC and FA, concentrations were normalized in each group to cell number. Each time point represents the mean ± SEM from three independent experiments performed in triplicate (n = 9) per time point. *P < 0.05 by Student’s t-test.
Fig. 3.
Fig. 3.
Pathway analysis. A: FA synthesis pathways in infected cells demonstrated by comparing the 3 hpi time point to the 2 hpi time point. B: Active pathways in infected cells comparing 2 hpi to baseline (time 0). Green and red arrows show reactions with positive and negative Z-scores, respectively, thus showing pathways with increased and decreased reactivity. The boxes highlight potential changed pathways based on Z-scores.
Fig. 4.
Fig. 4.
Optimal subnetwork analysis. A subsection of the subnetwork analysis performed comparing the lipid composition at 2 hpi with that of uninfected cells. The red and yellow dots are, respectively, metabolites and proteins. The thickness of edges is proportional to their robustness scores.
Fig. 5.
Fig. 5.
Quantification of RV-A1b replication inhibition over full drug concentration-response curves. A, C, E: HBECs were pretreated for 1 h with increasing concentrations of compounds (0.1–20 μM) or DMSO followed by infection with RV-A1b at an MOI of 5 for 1 h. Replication proceeded for 7 h and cell lysates with supernatants were harvested and processed to measure virus titers by TCID50. The graphs show means (± SEM) of three independent repeats, each performed in duplicate. B, D, F: HBECs were incubated with drugs for 9 h and cell viability was determined using the ToxGlo assay. The graphs show the percent of cell viability compared with the control from three independent experiments. Viability of untreated cells is represented by the dotted line.
Fig. 6.
Fig. 6.
Effect on RV genome, protein and titer and LDL uptake. HBECs pretreated with a maximal noncytotoxic concentration (10 μM for Ceranib 1 and D609; 20 μM for 3-O-methyl-SM, SK-I, SK-II, VU 0155069, and C75) or DMSO for 1 h followed by infection with RV-A1b at an MOI of 5 for 1 h. After 7 h, viral genome replication was measured by qRT-PCR (A); viral protein synthesis was measured by Western blotting (B); and virus titer was measured by TCID50 (C). A: Viral RNA levels normalized to 18S rRNA levels in the different conditions. The dotted line represents cell-bound viral RNA at the start of the replication cycle. B: Western blots were scanned with ImageJ and are represented as percent of the 2C/lamin B1 ratio over control. C: Virus titers measured by endpoint titer determination (TCID50). D: BODIPY-nonacetylated LDL uptake in cells pretreated with inhibitors for 1 h. The graphs show the mean ± SEM of three independent experiments and the differences between DMSO and the different inhibitors estimated by one-way ANOVA with Dunnet’s post hoc test. *P < 0.001; ****P < 0.0001.

References

    1. Wessels E., Duijsings D., Lanke K. H., van Dooren S. H., Jackson C. L., Melchers W. J., and van Kuppeveld F. J.. 2006. Effects of picornavirus 3A proteins on protein transport and GBF1-dependent COP-I recruitment. J. Virol. 80: 11852–11860. - PMC - PubMed
    1. Hsu N. Y., Ilnytska O., Belov G., Santiana M., Chen Y. H., Takvorian P. M., Pau C., van der Schaar H., Kaushik-Basu N., Balla T., et al. . 2010. Viral reorganization of the secretory pathway generates distinct organelles for RNA replication. Cell. 141: 799–811. - PMC - PubMed
    1. Spickler C., Lippens J., Laberge M. K., Desmeules S., Bellavance E., Garneau M., Guo T., Hucke O., Leyssen P., Neyts J., et al. . 2013. Phosphatidylinositol 4-kinase III beta is essential for replication of human rhinovirus and its inhibition causes a lethal phenotype in vivo. Antimicrob. Agents Chemother. 57: 3358–3368. - PMC - PubMed
    1. Albulescu L., Strating J. R., Thibaut H. J., van der Linden L., Shair M. D., Neyts J., and van Kuppeveld F. J.. 2015. Broad-range inhibition of enterovirus replication by OSW-1, a natural compound targeting OSBP. Antiviral Res. 117: 110–114. - PubMed
    1. Arita M., Kojima H., Nagano T., Okabe T., Wakita T., and Shimizu H.. 2013. Oxysterol-binding protein family I is the target of minor enviroxime-like compounds. J. Virol. 87: 4252–4260. - PMC - PubMed

Publication types

Substances