. 2018 Jun 26;9(1):2476.
doi: 10.1038/s41467-018-04577-y.

Estimating spatiotemporally varying malaria reproduction numbers in a near elimination setting

Affiliations

Estimating spatiotemporally varying malaria reproduction numbers in a near elimination setting

Isobel Routledge et al. Nat Commun. .

Abstract

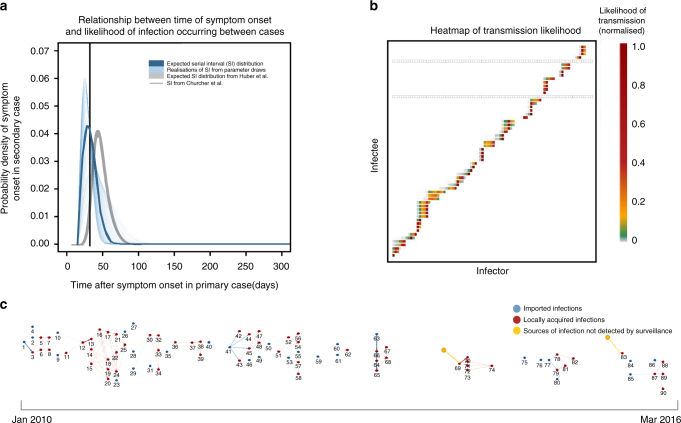
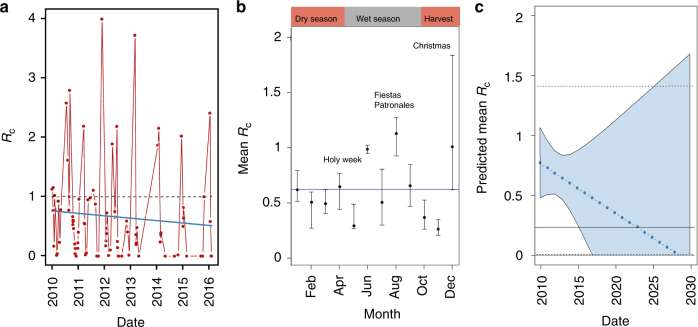
In 2016 the World Health Organization identified 21 countries that could eliminate malaria by 2020. Monitoring progress towards this goal requires tracking ongoing transmission. Here we develop methods that estimate individual reproduction numbers and their variation through time and space. Individual reproduction numbers, Rc, describe the state of transmission at a point in time and differ from mean reproduction numbers, which are averages of the number of people infected by a typical case. We assess elimination progress in El Salvador using data for confirmed cases of malaria from 2010 to 2016. Our results demonstrate that whilst the average number of secondary malaria cases was below one (0.61, 95% CI 0.55-0.65), individual reproduction numbers often exceeded one. We estimate a decline in Rc between 2010 and 2016. However we also show that if importation is maintained at the same rate, the country may not achieve malaria elimination by 2020.


Conflict of interest statement

The authors declare no competing interests.

Figures

Fig. 1
Fig. 1
a Serial interval (SI) distribution used in the analysis. Thin blue lines represent 300 realisations of the SI distribution resulting from draws from the distributions of the parameters determining the shape of the SI and incubation period. The serial interval distribution is the distribution of the time between the onset of symptoms (fever) in a case and the onset of symptoms in the case(s) it infects. The thicker blue line represents the expected SI distribution. For comparison, the grey line represents the SI distribution estimated for symptomatic, treated P. falciparum infection from and the black line shows the expected SI for P. falciparum from. b Heatmap showing likelihood of transmission occurring between infector and infectee pairs. The X axis represents all possible infectors (all reported cases) of the observed cases, organised by symptom onset date. The Y axis represents all possible infectees (all locally acquired cases, as by definition we assume imported cases were infected outside of the country). Each square represents a potential infector/infectee pair. The colours of the heatmap represent the normalised likelihood of infector j having been the infector of infectee i. where red is 1 and grey is 0. Grey squares show where cases were not likely to be infected by to any observed case, and therefore presumably infected by an individual who was not detected by surveillance. These could be asymptomatic or unreported clinical cases. c Reconstructed network, where numbers represent the ID of cases in temporal order. The strength of likelihood of connection represented by weight of edges linking cases. The two locally acquired cases identified to be infected by unobserved sources of infection are highlighted
Fig. 2
Fig. 2
a Individual reproduction numbers plotted over time. Individual, or case reproduction numbers (Rc) are the estimated number of individuals a given case is likely to have gone on to infect. Dashed line shows Rc = 1, blue line shows fitted Generalised Additive Model. b Posterior estimates of Rc by month of year. Bars show 95% credible interval. Blue line shows the mean estimated Rc, the individual reproduction number, for the observation period. Key holidays, seasons and agricultural patterns are labelled. c Extended trendline to 2030 showing predicted Rc Shaded area shows 95% credible interval from prediction and solid line shows mean threshold of P = 0.05 of cases occurring with an Rc above one. Dashed lines show 97.5 and 2.5th quartiles for this threshold from 10000 simulations
Fig. 3
Fig. 3
a Distribution of Rc values by location of residential address. Red points represent an Rc (individual reproduction number) below one, blue points represent an Rc value above 1. b Distribution of imported and locally acquired cases by location of residential address. Yellow points represent locally acquired cases, green points represent imported cases. c Map of risk of Rc exceeding 1 if a case were to occur in an area. Note this estimate does not consider risk of importation, but estimates receptivity to transmission if importation were to occur. d Standard deviation in risk estimates from c

References

    1. Cibulskis RE, et al. Malaria: global progress 2000–2015 and future challenges. Infect. Dis. Poverty. 2016;5:61. doi: 10.1186/s40249-016-0151-8. - DOI - PMC - PubMed
    1. Cohen JM, Moonen B, Snow RW, Smith DL. How absolute is zero? An evaluation of historical and current definitions of malaria elimination. Malar. J. 2010;9:213. doi: 10.1186/1475-2875-9-213. - DOI - PMC - PubMed
    1. Griffin JT, et al. Potential for reduction of burden and local elimination of malaria by reducing Plasmodium falciparum malaria transmission: a mathematical modelling study. Lancet Infect. Dis. 2016;16:465–472. doi: 10.1016/S1473-3099(15)00423-5. - DOI - PMC - PubMed
    1. World Health Organization. World Malaria Report 2016. (Geneva, 2016)
    1. Sturrock HJW, et al. Targeting asymptomatic malaria infections: active surveillance in control and elimination. PLoS Med. 2013;10:e1001467. doi: 10.1371/journal.pmed.1001467. - DOI - PMC - PubMed

Publication types