. 2018 Jun 26;8(1):9681.
doi: 10.1038/s41598-018-27682-w.

Pulmonary Arterial Hypertension Affects the Rat Gut Microbiome

Affiliations

Pulmonary Arterial Hypertension Affects the Rat Gut Microbiome

María Callejo et al. Sci Rep. .

Abstract

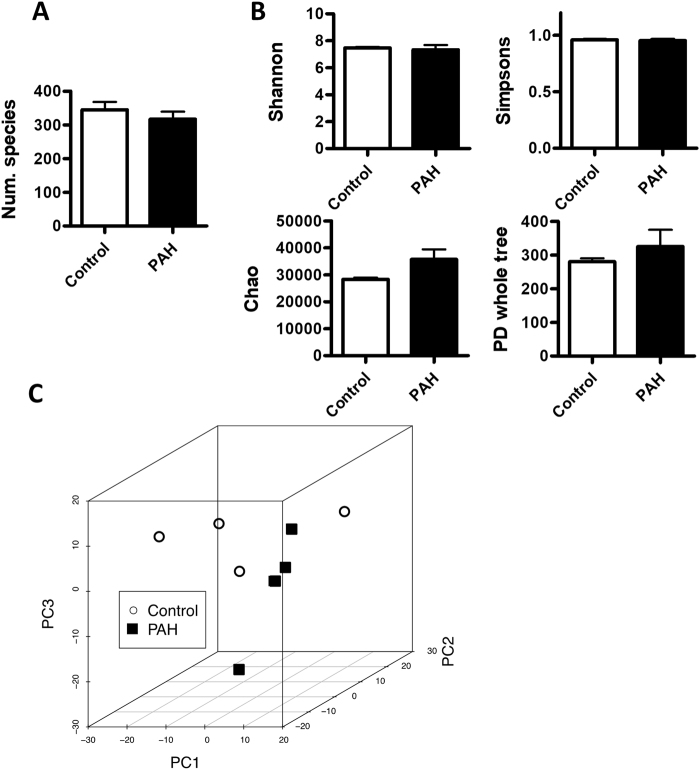
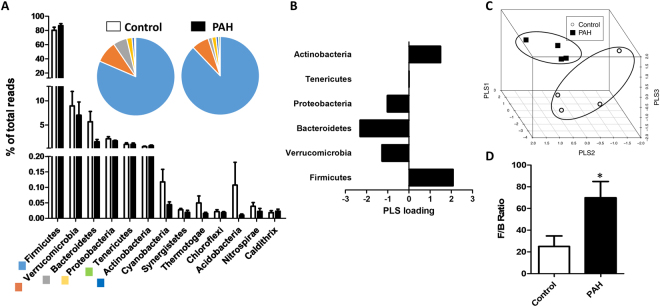
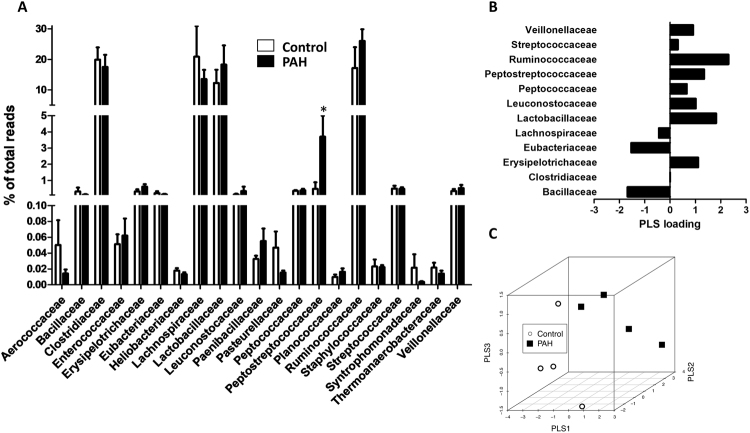
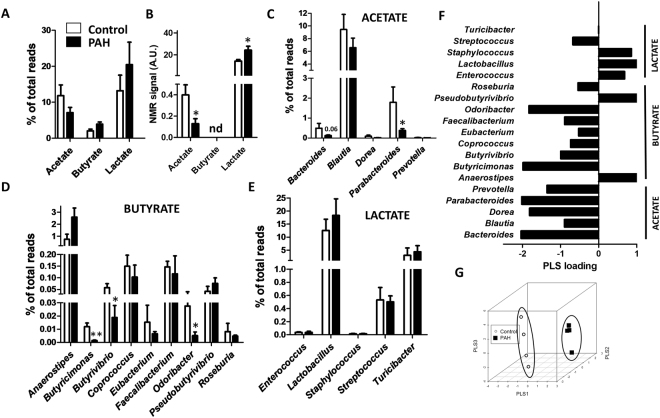
We have analysed whether pulmonary arterial hypertension (PAH) alters the rat faecal microbiota. Wistar rats were injected with the VEGF receptor antagonist SU5416 (20 mg/kg s.c.) and followed for 2 weeks kept in hypoxia (10% O2, PAH) or injected with vehicle and kept in normoxia (controls). Faecal samples were obtained and microbiome composition was determined by 16S rRNA gene sequencing and bioinformatic analysis. No effect of PAH on the global microbiome was found (α- or β-diversity). However, PAH-exposed rats showed gut dysbiosis as indicated by a taxonomy-based analysis. Specifically, PAH rats had a three-fold increase in Firmicutes-to-Bacteroidetes ratio. Within the Firmicutes phylum, there were no large changes in the relative abundance of the bacterial families in PAH. Among Bacteroidetes, all families were less abundant in PAH. A clear separation was observed between the control and PAH clusters based on short chain fatty acid producing bacterial genera. Moreover, acetate was reduced in the serum of PAH rats. In conclusion, faecal microbiota composition is altered as a result of PAH. This misbalanced bacterial ecosystem might in turn play a pathophysiological role in PAH by altering the immunologic, hormonal and metabolic homeostasis.


Conflict of interest statement

The authors declare no competing interests.

Figures

Figure 1
Figure 1
Hemodynamic and histological changes. (A) Systolic, diastolic and mean PAP, (B) Heart rate, (C) Body weight, (D) RV and LV+S weight, (E) Fulton index [RV/(LV+S)] and (F) percentage of arterial muscularization. (G) Typical hematoxilin-eosin staining of arterial sections (scale bar 50 µm), (H) Medial thickness, (I) An early obliterated lesion (scale bar 50 µm). Results are means ± s.e.m. of 4 animals, **p < 0.05 versus control (Students’ t test for panels A–E and Square Chi test for panel F).
Figure 2
Figure 2
Microbial richness and diversity in PH and Principal Coordinate analysis (PCA). (A) Number of species identified. (B) α-diversity in rats in control and PAH rats measured by the Shannon, Chao, Simpsons and PD whole tree indexes. Results are means ± s.e.m. of 4 animals. (C) Unsupervised PCA were carried out to analyse the differences between control and PAH groups. Each principal component describes most of the variation between samples.
Figure 3
Figure 3
Phyla composition. (A) Composition of the most abundant bacterial phyla (>0.01%) expressed as a percent of total bacteria (means ± s.e.m. of 4 animals). The inset shows the pie charts for control and PAH. (B) PLS loadings (data shown for phyla representing >0.1% of total bacteria) highlight variable significance to discriminate between PAH and control samples in PLS scores. (C) Tridimensional PLS scores plot. (D) The Firmicutes to Bacteroidetes ratio (F/B ratio) was calculated as a biomarker of gut dysbiosis (means ± s.e.m., n = 4, *p = 0.04 vs control with student’s t-test).
Figure 4
Figure 4
Bacterial families within the Firmicutes phylum. (A) Composition of the most abundant bacterial families (>0.01%) expressed as a percent of total bacteria in control and PAH rats (means ± s.e.m. of 4 animals, *p < 0.05 vs control with student’s t-test). (B) PLS loadings (data shown for phyla representing >0.1% of total bacteria) highlight variable significance to discriminate between PAH and control samples in PLS scores. (C) Tridimensional PLS scores plot.
Figure 5
Figure 5
Bacterial families within the Bacteroidetes phylum. (A) Composition of the bacterial families expressed as a percent of total bacteria in control and PAH rats (means ± s.e.m. of 4 animals, *p < 0.05 vs control with student’s t-test) (B) PLS loadings (data shown for phyla representing >0.1% of total bacteria) highlight variable significance to discriminate between PAH and control samples in PLS scores. (C) Tridimensional PLS scores plot. (D) Composition of the species within the Odoribacteraceae family and Porphyromonas (means ± s.e.m. of 4 animals, *p < 0.05 vs control with student’s t-test).
Figure 6
Figure 6
SCFA and SCFA-producing bacteria. (A) Composition of the acetate-, butyrate- and lactate-producing bacteria in control and PAH rats. Data is the sum of all SCFA-producing genera expressed as a percent of total bacteria (means ± SEM of 4 animals). (B) Acetate, butyrate and lactate in rat serum (AU = arbitrary units, nd = not detected, n = 4, *p < 0.05 vs control student’s t-test). (CE) Most abundant acetate-, butyrate- and lactate-producing genera (means ± s.e.m. of 4 animals, *p < 0.05 vs control with student’s t-test). (F) PLS loadings (data shown for phyla representing >0.1% of total bacteria) highlight variable significance to discriminate between PAH and control samples in PLS scores. (G) Tridimensional PLS scores plot.

Similar articles

Cited by

References

    1. Galie N, et al. 2015 ESC/ERS Guidelines for the diagnosis and treatment of pulmonary hypertension: The Joint Task Force for the Diagnosis and Treatment of Pulmonary Hypertension of the European Society of Cardiology (ESC) and the European Respiratory Society (ERS): Endorsed by: Association for European Paediatric and Congenital Cardiology (AEPC), International Society for Heart and Lung Transplantation (ISHLT) Eur. Heart J. 2016;37:67–119. doi: 10.1093/eurheartj/ehv317. - DOI - PubMed
    1. Rabinovitch M, Guignabert C, Humbert M, Nicolls MR. Inflammation and immunity in the pathogenesis of pulmonary arterial hypertension. Circ. Res. 2014;115:165–175. doi: 10.1161/CIRCRESAHA.113.301141. - DOI - PMC - PubMed
    1. Schermuly RT, Ghofrani HA, Wilkins MR, Grimminger F. Mechanisms of disease: pulmonary arterial hypertension. Nat. Rev. Cardiol. 2011;8:443–455. doi: 10.1038/nrcardio.2011.87. - DOI - PMC - PubMed
    1. D’Alessandro A, et al. Hallmarks of Pulmonary Hypertension: Mesenchymal and Inflammatory Cell Metabolic Reprogramming. Antioxid. Redox Signal. 2017;28:230–250. doi: 10.1089/ars.2017.7217. - DOI - PMC - PubMed
    1. Fu ZD, Cui JY. Remote Sensing between Liver and Intestine: Importance of Microbial Metabolites. Curr. Pharmacol. Rep. 2017;3:101–113. doi: 10.1007/s40495-017-0087-0. - DOI - PMC - PubMed

Publication types

Substances