. 2018 Jun 26;8(1):9711.
doi: 10.1038/s41598-018-28002-y.

Activation of the p53-MDM4 regulatory axis defines the anti-tumour response to PRMT5 inhibition through its role in regulating cellular splicing

Affiliations

Activation of the p53-MDM4 regulatory axis defines the anti-tumour response to PRMT5 inhibition through its role in regulating cellular splicing

Sarah V Gerhart et al. Sci Rep. .

Abstract

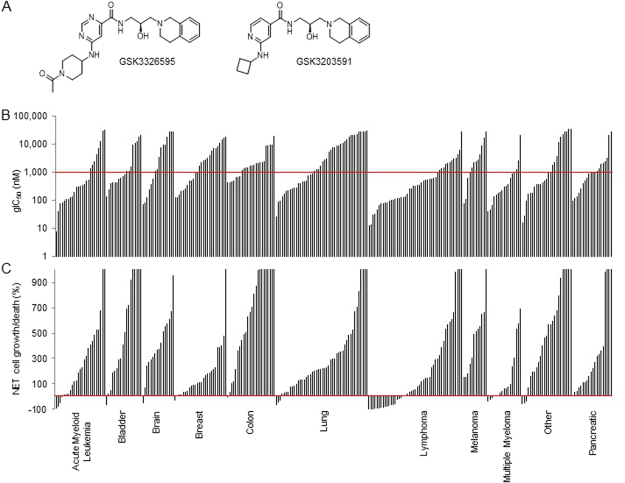
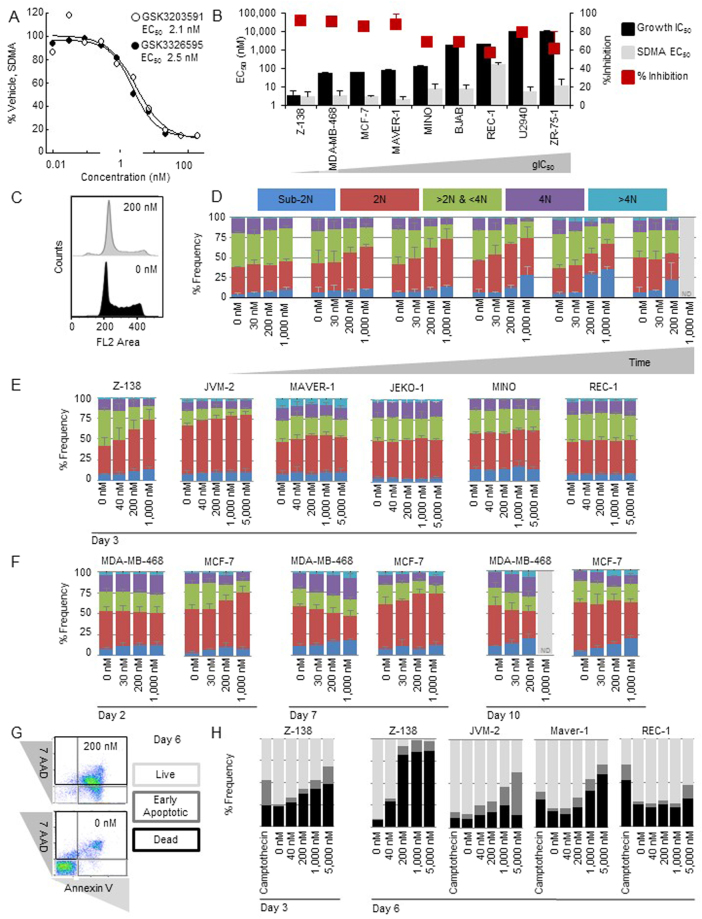
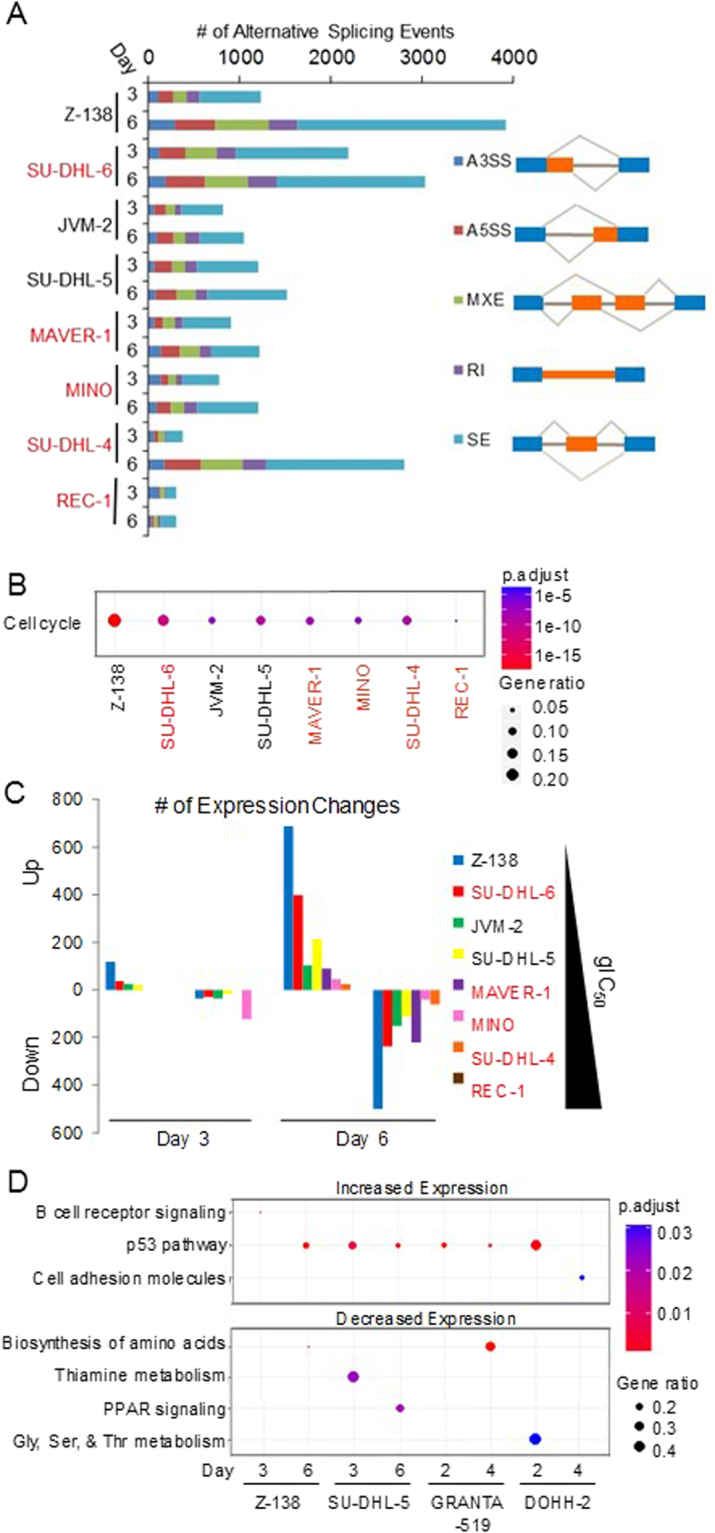
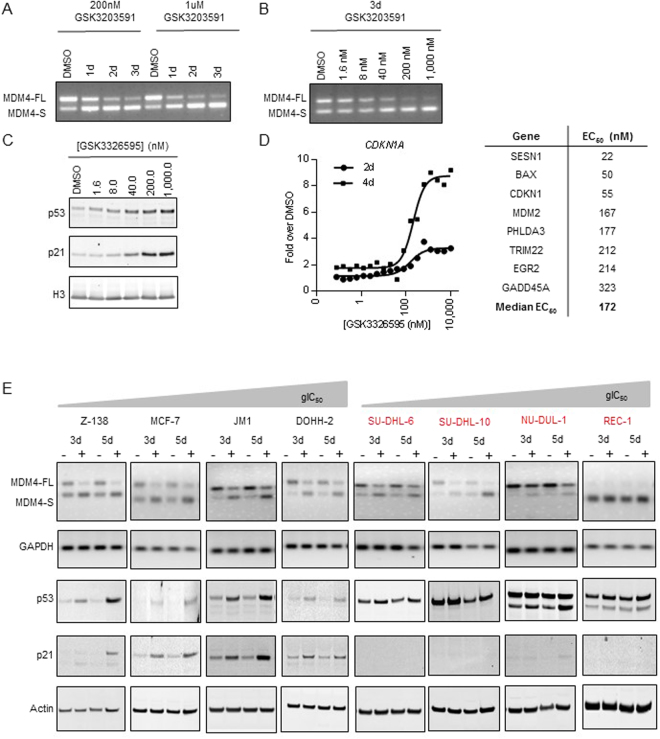
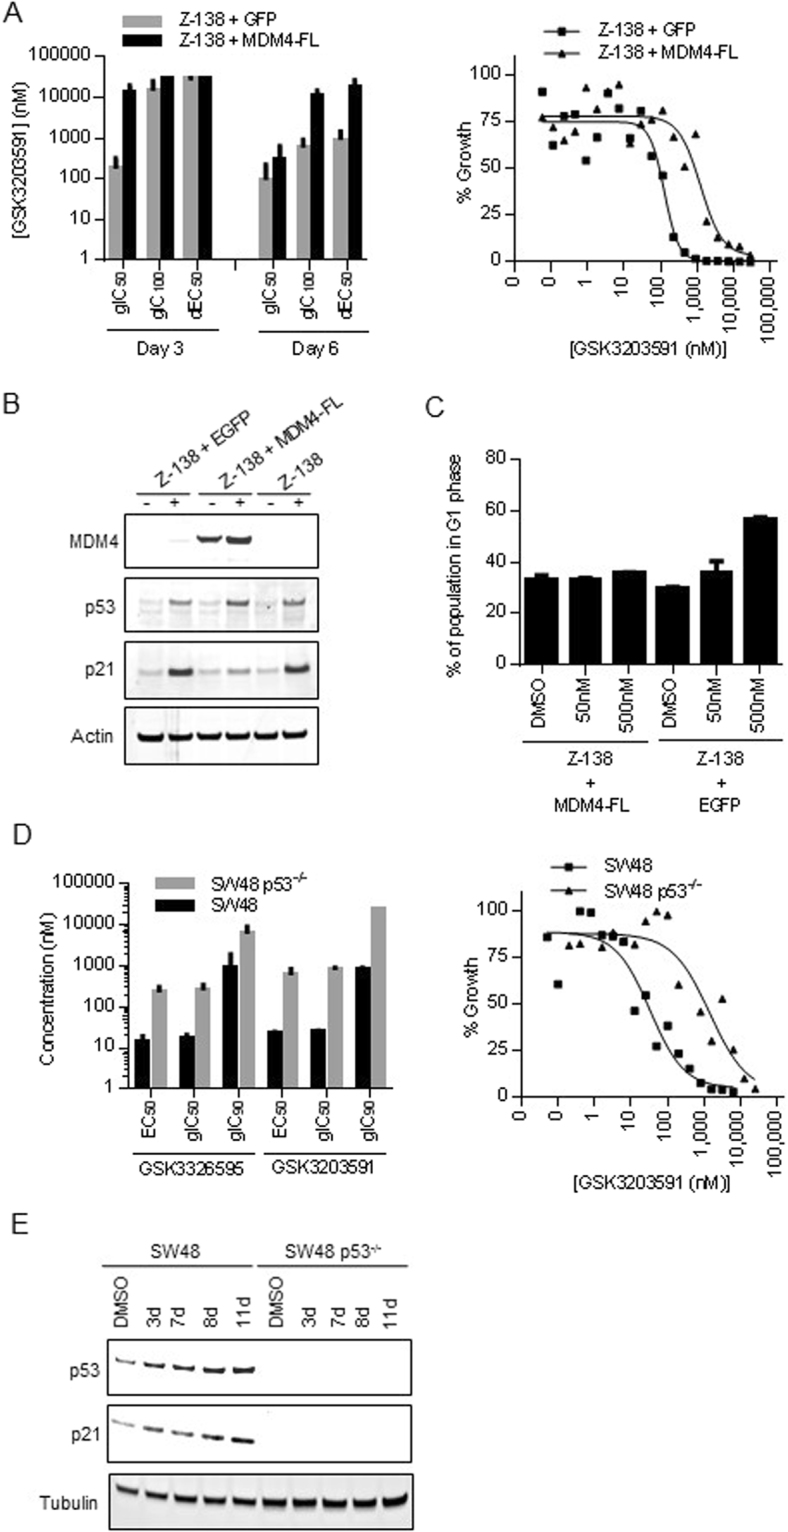
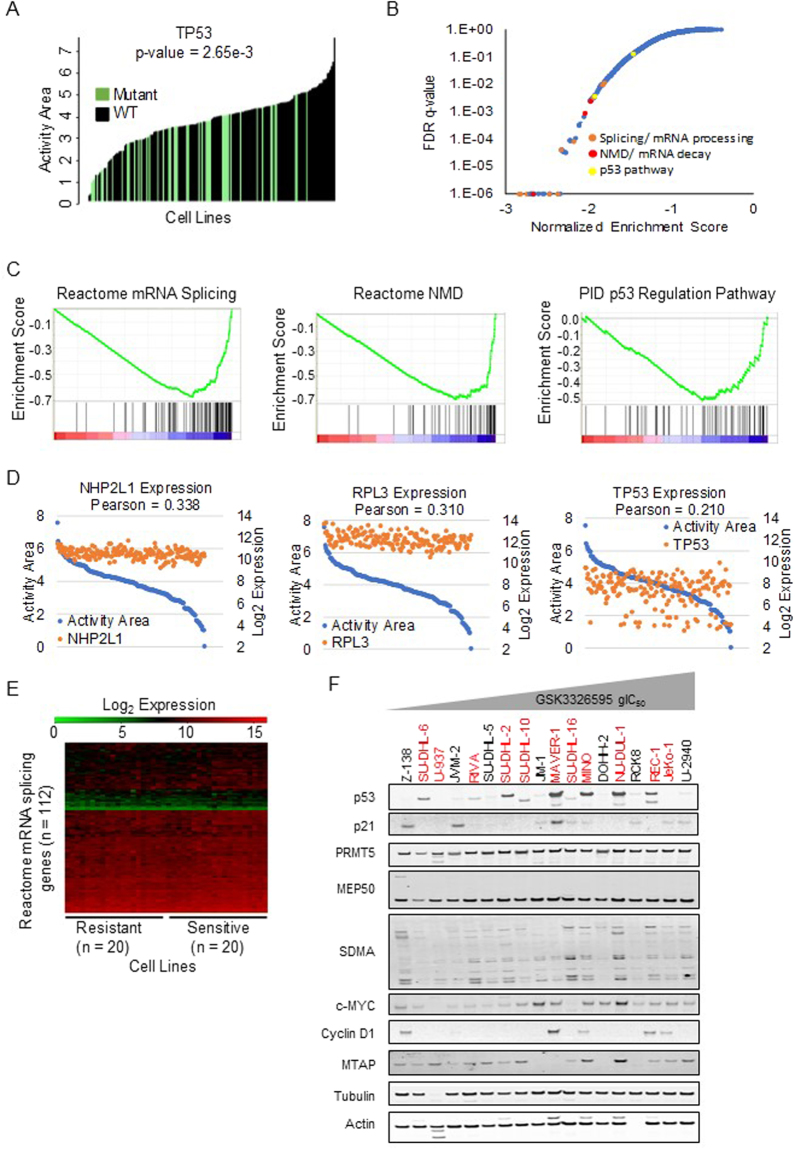
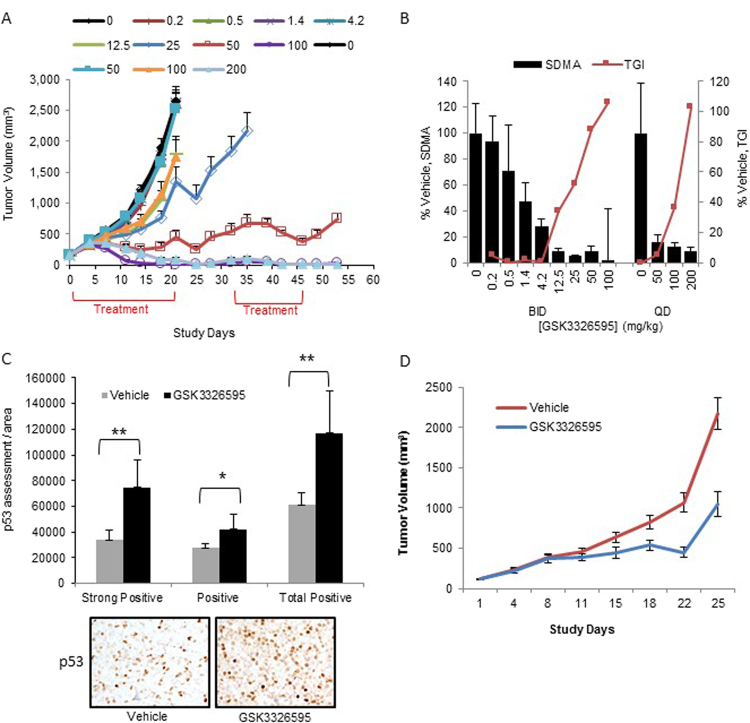
Evasion of the potent tumour suppressor activity of p53 is one of the hurdles that must be overcome for cancer cells to escape normal regulation of cellular proliferation and survival. In addition to frequent loss of function mutations, p53 wild-type activity can also be suppressed post-translationally through several mechanisms, including the activity of PRMT5. Here we describe broad anti-proliferative activity of potent, selective, reversible inhibitors of protein arginine methyltransferase 5 (PRMT5) including GSK3326595 in human cancer cell lines representing both hematologic and solid malignancies. Interestingly, PRMT5 inhibition activates the p53 pathway via the induction of alternative splicing of MDM4. The MDM4 isoform switch and subsequent p53 activation are critical determinants of the response to PRMT5 inhibition suggesting that the integrity of the p53-MDM4 regulatory axis defines a subset of patients that could benefit from treatment with GSK3326595.


Conflict of interest statement

SVG, WAK, CT, MBP, X-PZ, RMdO, BL, MM, CC, NJ, RK, OB are past or present employees and stakeholders of GlaxoSmithKline. EP, KD, AB, and CM are past or present employees and stakeholders of Epizyme.

Figures

Figure 1
Figure 1
PRMT5 inhibition attenuates growth and survival in cancer cell lines. (A) Chemical structure of GSK3326595 (left) and GSK3203591 (right). (B) gIC50 (nM) and (C) net cell growth/death (%) values following a 6-day treatment with GSK3203591 in a panel of cell lines representing various tumour types. Bars represent average values for individual cell lines. Top dose of assay 29 uM. Cell lines with average gIC50 < 1 uM and net cell growth/death <0% represent the most sensitive and cytotoxic cell lines, respectively.
Figure 2
Figure 2
PRMT5 inhibition decreases global cellular SDMA methylation and attenuates cell cycle and viability of cancer cell lines. (A) Representative SDMA dose-response curve (total SDMA normalized to SMD3) following 3 days of compound treatment. (B) Growth IC50 (6 days treatment) in comparison to SDMA EC50 and percent decrease in SDMA (maximum minus minimum at concentrations evaluated) in a panel of MCL cell lines (3 days treatment with GSK3326595). (C) Representative cell cycle histogram of Z-138 cells treated with 0 or 200 nM GSK3326595 for 3 days. Propidium iodide stained nuclei were evaluated by flow cytometry. (D) Cell cycle distribution of Z-138 cells treated with 30, 200 and 1,000 nM GSK3326595 for 1, 2, 3, 5, 7, or 10 days. ND, not determined. (E) Cell cycle distribution of a panel of MCL cell lines treated with 40, 200, 1,000, and 5,000 nM GSK3326595 for 3 days. (F) Cell cycle distribution of breast cancer cell lines treated with 30, 200, and 1,000 nM GSK3326595 for 2, 7, or 10 days. (G) Representative plot of early apoptosis (Annexin V) and cell death (7AAD) markers comparing cells treated with DMSO and cells treated with 200 nM GSK3326595 by flow cytometry. (H) Annexin V and 7AAD staining of MCL cell lines treated with 40 nM, 200 nM, 1,000 nM or 5,000 nM GSK3326595 for 3 or 6 days.
Figure 3
Figure 3
PRMT5 inhibition causes changes in gene expression and splicing. (A) The number of significant rMATS alternative splicing events (FDR < 0.01, SD < 0.2, junction coverage > 10, −0.2 < IncLevelDifference >0.2) in lymphoma cell lines treated with 200 nM GSK3326595 for 3 days. p53 mutant cell lines are highlighted in red. (B) Significantly alternatively spliced genes were submitted for enrichment of gene sets for each cell line using MsigDB where cell cycle was one of the top gene sets for all cell lines. This cell cycle gene set compiled from all cell lines was analyzed by ReactomePA. p53 mutant cell lines are highlighted in red. (C) The number of significant gene expression changes (FDR < 0.05) in lymphoma cell lines following treatment with 200 nM GSK3326595 for 3 or 6 days. Cell lines are sorted by decreasing sensitivity based on gIC50 values in a 6-day proliferation assay. p53 mutant cell lines are highlighted in red. (D) Significantly changed genes in p53 wild-type cell lines were submitted for MsigDB enrichment analysis (Broad) and the most significantly enriched gene set for each cell line is reported.
Figure 4
Figure 4
PRMT5 inhibition induces alternative splicing of MDM4 and p53 pathway activation. (A) MDM4 splicing time course evaluating relative abundances of MDM4-FL and MDM4-S isoforms in Z-138 following 1, 2, or 3 days of GSK3203591 treatment at concentrations of 200 nM or 1 μM using ethidium bromide gel electrophoresis. (B) MDM4 splicing dose response in Z-138 following 3 days of GSK3203591 treatment using ethidium bromide gel electrophoresis. (C) Western blot dose response for p53 and p21 protein levels in Z-138 following 3 days of GSK3326595 treatment. (D) Gene expression EC50 values in Z-138 cells treated with GSK3326595 for 2 or 4 days. Gene panel was selected based on results of RNA-sequencing. Representative dose-response curves for CDKN1A (days 2 and 4, left panel) and gene panel EC50 summary table (day 4, right panel) are shown. (E) MDM4 splicing analysis (via ethidium bromide gel electrophoresis) and p53/p21 induction analysis (via Western blot) in a panel of p53 wild-type (black text) and mutant (red text) breast and lymphoma cell lines treated with DMSO (−) or 200 nM GSK3326595 (+) for 3 or 5 days arranged in order of increasing gIC50 value in a 6-day proliferation assay with GSK3326595. MDM4-FL, full-length isoform of MDM4; MDM4-S, short isoform of MDM4 with skipped exon 6.
Figure 5
Figure 5
Sensitivity to PRMT5 inhibition is attenuated by overexpression of MDM4-FL or loss of p53. (A) (Left panel) Effect of MDM4-FL overexpression on proliferation of Z-138 cells following 3 or 6 days of GSK3203591 treatment with respect to gIC50, gIC100, and dEC50 parameters. Transduction of an EGFP construct was used as a negative control. (Right panel) Representative growth curves comparing % growth relative to Day 0 in Z-138 cells overexpressing MDM4-FL vs. EGFP treated with various doses of GSK3203591 for 6 days. (B) Western blot showing the effect of MDM4-FL overexpression on p53 and p21 protein levels in Z-138 cells following 4 days of 1 µM GSK3203591 (+) or DMSO (−) treatment. (C) Effect of MDM4-FL overexpression on G1 cell cycle phase in Z-138 cells following 4 days of treatment with DMSO, 50 nM, or 500 nM GSK3203591. (D) (Left panel) Effect of p53 knockout on proliferation in SW48 colon cancer cells following 10 days of GSK3203591 or GSK3326595 treatment with respect to EC50, gIC50, and gIC90 parameters. (Right panel) Representative growth curves comparing % growth relative to Day 0 in wild-type or p53 genetic knockout SW48 cells treated with various doses of GSK3203591 for 10 days. (E) Western blot showing the effect of p53 knockout on p53 and p21 protein levels in SW48 cells following a time course (3, 7, 8, or 11 days) of 500 nM GSK3203591 treatment.
Figure 6
Figure 6
p53 mutational status correlates with sensitivity to PRMT5 inhibition. (A) Correlations with activity area calculated from a 10-point dose curve 10 days post treatment with GSK3203591. TP53 mutation is one of the top predictors of resistance. (B) A pre-ranked list of Pearson correlation of gene expression with sensitivity was submitted to GSEA and the gene sets plotted by increasing FDR. (C) The lowest FDR gene set from each of the three categories of interest: Splicing, Nonsense mediated decay (NMD), and p53 pathway gene sets, are represented by enrichment plots from the GSEA outputs (top panel). The highest correlated gene by Pearson from each of the three represented gene sets is plotted by decreasing sensitivity. (bottom panel). (D) A hierarchical clustering of expression values for genes in the “Reactome_mRNA_splicing” gene set from the 20 most sensitive and resistant cell lines. (E) Western blot showing basal expression of a variety of proteins in lymphoma cell lines ranging in sensitivity to PRMT5i (most sensitive far left, least sensitive far right) and of various p53 mutational statuses. p53 mutant cell lines in red.
Figure 7
Figure 7
PRMT5 inhibition leads to tumour growth attenuation in lymphoma xenograft models. (A) Tumour volume in a Z-138 mouse tumour xenograft with 21 days of GSK3326595 treatment. Groups undergoing treatments that resulted in statistically significant decreases in tumour volume (i.e. 50 mg/kg BID, 100 mg/kg BID and 200 mg/kg QD) were placed on a treatment holiday for 10 days to assess the durability of the response. Treatment was re-instated on day 32 for 2 weeks followed by a 1 week holiday. The 25 mg/kg BID dose group was euthanized on day 35 due to tumour burden. BID doses evaluated include 0, 0.2, 0.5, 1.4, 4.2, 12.5, 25, 50, and 100 mg/kg. QD doses evaluated include 0, 50, 100, and 200 mg/kg. A statistically significant dose-dependent anti-tumour effect was observed for the 25 mg/kg BID, 50 mg/kg BID, 100 mg/kg BID, and 200 mg/kg QD treatment groups (corresponding percent tumor growth inhibition values, % TGI, of 52.1%, 88.03%, 106.05%, and 102.81%, respectively). (B) SDMA in Z-138 tumour xenograft model post 7 days treatment with GSK3326595 with twice daily oral dosing. Sampling 2 hours post last dose. Tumour growth inhibition is indicated from a parallel efficacy study. SDMA % vehicle: 94%, 71%, 47%, 28%, 9%, 5%, 8%, 2% in mice given 0.2 mg/kg, 0.5 mg/kg, 1.4 mg/kg, 4.2 mg/kg, 12.5 mg/kg, 25 mg/kg, 50 mg/kg, or 100 mg/kg GSK3326595 BID and SDMA % vehicle: 16%, 12%, and 9% in mice given 50 mg/kg, 100 mg/kg, 200 mg/kg GSK3326595 QD. (C) Effects of 100 mg/kg BID GSK3326595 treatment for 7 days on p53 protein levels in Z-138 tumours by immunohistochemistry. (D) Tumour volume in a REC-1 (p53 mutant) mouse tumour xenograft treated with 100 mg/kg BID GSK3326595 or vehicle.

Similar articles

Cited by

References

    1. Yang Y, et al. PRMT9 is a type II methyltransferase that methylates the splicing factor SAP145. Nat Commun. 2015;6:6428. doi: 10.1038/ncomms7428. - DOI - PMC - PubMed
    1. Karkhanis V, Hu YJ, Baiocchi RA, Imbalzano AN, Sif S. Versatility of PRMT5-induced methylation in growth control and development. Trends Biochem Sci. 2011;36:633–641. doi: 10.1016/j.tibs.2011.09.001. - DOI - PMC - PubMed
    1. Bezzi M, et al. Regulation of constitutive and alternative splicing by PRMT5 reveals a role for Mdm4 pre-mRNA in sensing defects in the spliceosomal machinery. Genes Dev. 2013;27:1903–1916. doi: 10.1101/gad.219899.113. - DOI - PMC - PubMed
    1. Tee WW, et al. Prmt5 is essential for early mouse development and acts in the cytoplasm to maintain ES cell pluripotency. Genes Dev. 2010;24:2772–2777. doi: 10.1101/gad.606110. - DOI - PMC - PubMed
    1. Pal S, et al. Low levels of miR-92b/96 induce PRMT5 translation and H3R8/H4R3 methylation in mantle cell lymphoma. EMBO J. 2007;26:3558–3569. doi: 10.1038/sj.emboj.7601794. - DOI - PMC - PubMed

MeSH terms