

Sodium orthovanadate overcomes sorafenib resistance of hepatocellular carcinoma cells by inhibiting Na+/K+-ATPase activity and hypoxia-inducible pathways
- PMID: 29946188
- PMCID: PMC6018801
- DOI: 10.1038/s41598-018-28010-y
Sodium orthovanadate overcomes sorafenib resistance of hepatocellular carcinoma cells by inhibiting Na+/K+-ATPase activity and hypoxia-inducible pathways
Abstract
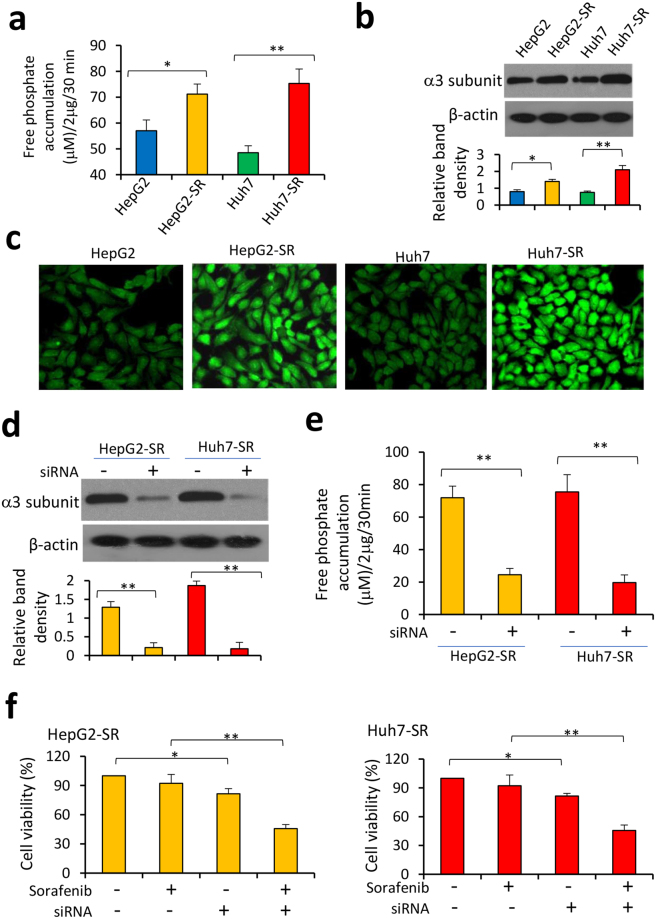
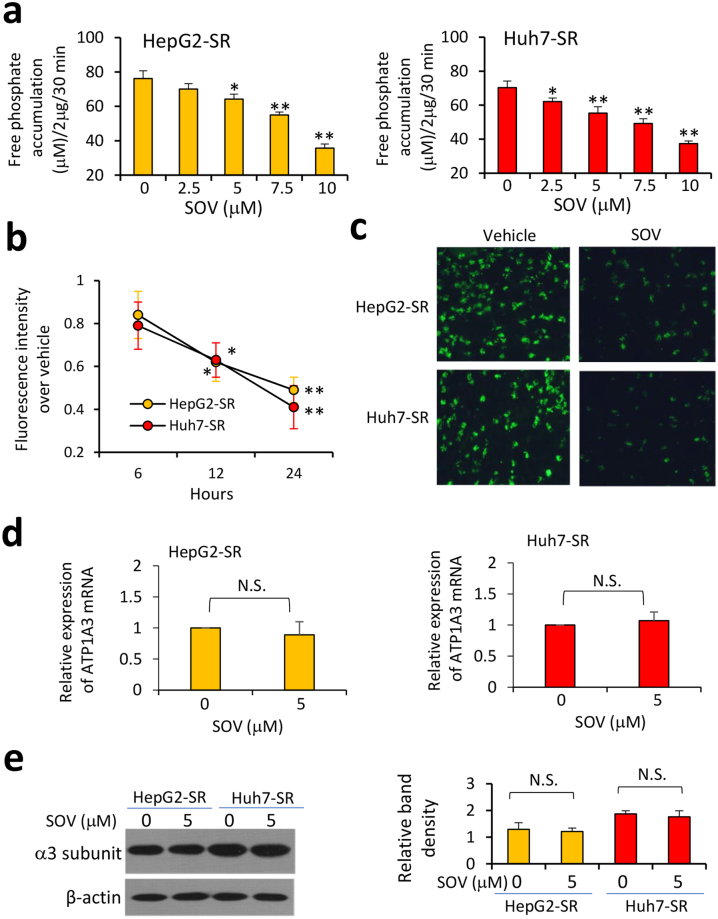
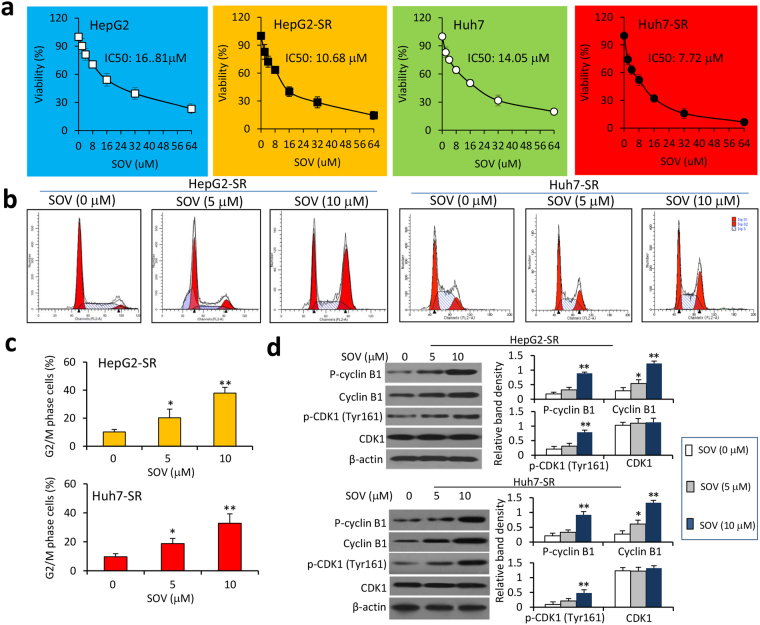
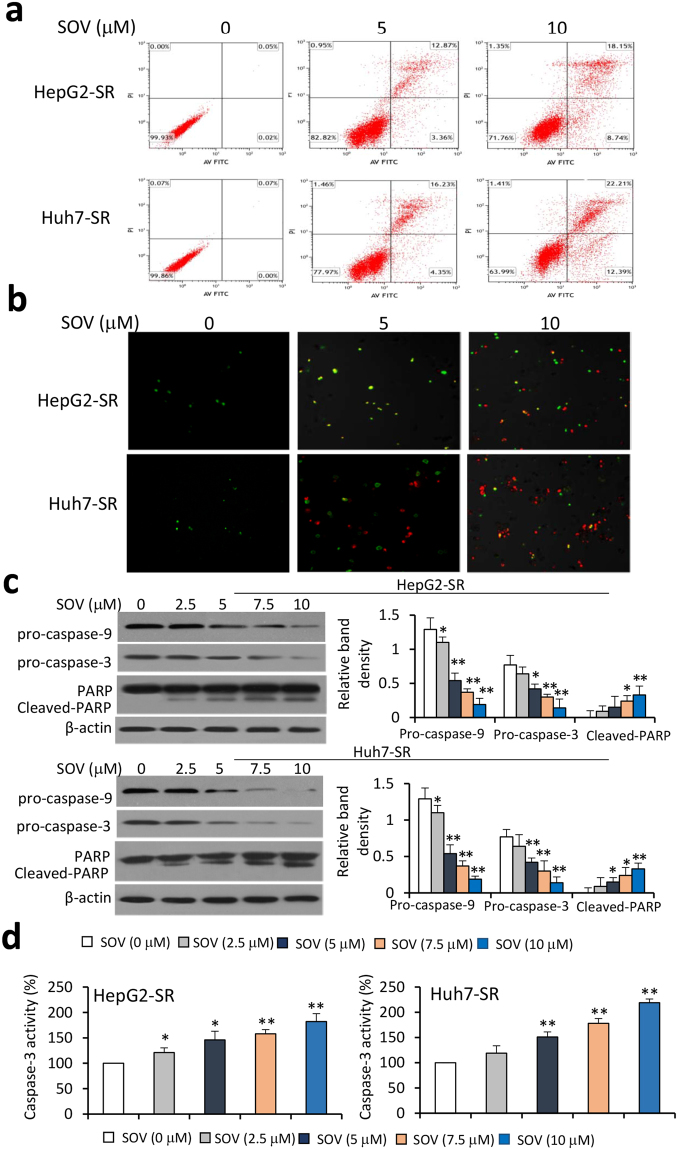
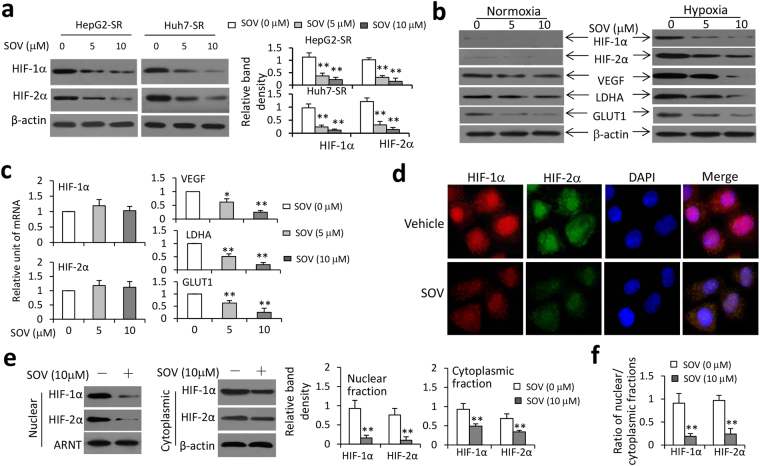
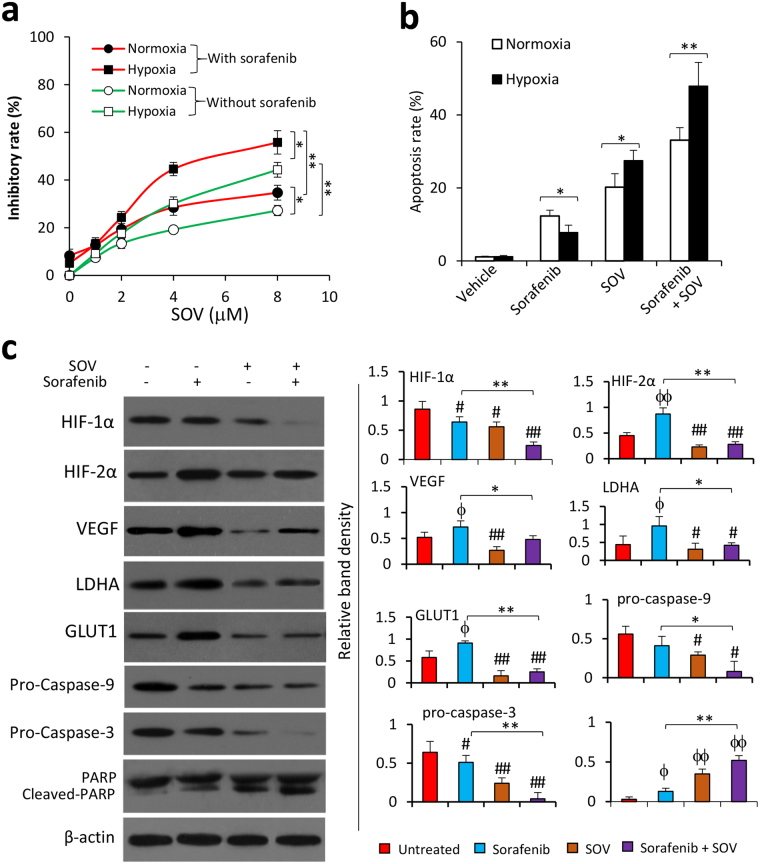
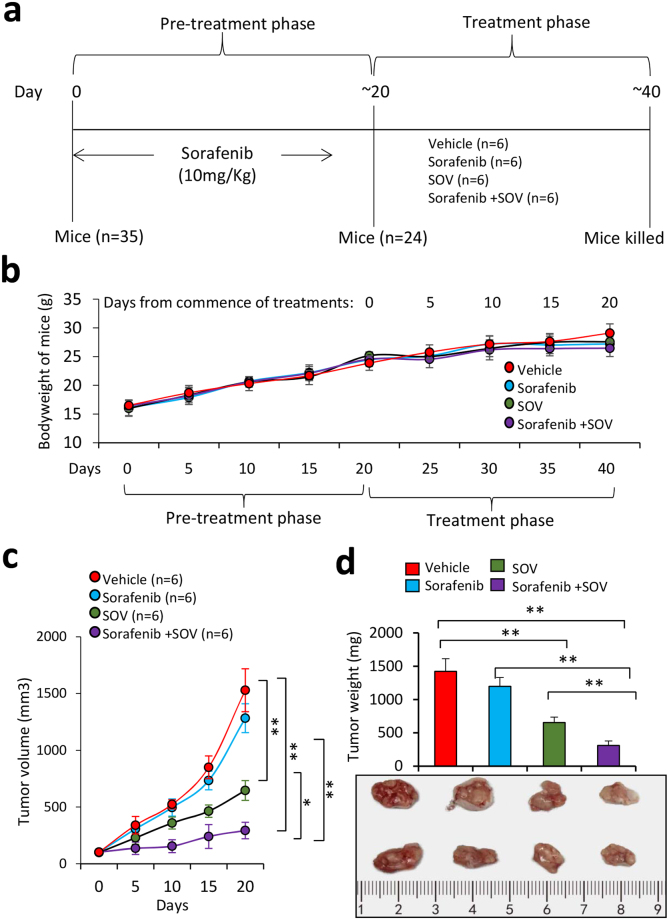
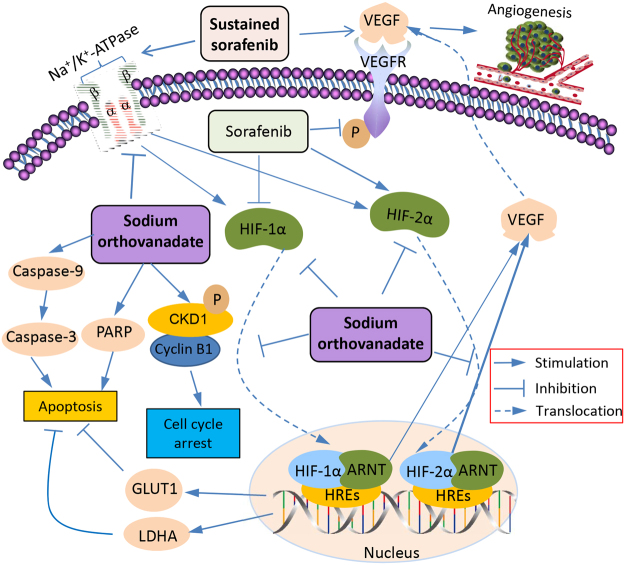
The resistance to sorafenib highly affects its clinical benefits for treating hepatocellular carcinoma (HCC). Sodium orthovanadate (SOV) is a phosphate analog that displays anti-cancer activities against various types of malignancies including HCC. The present study has demonstrated that SOV is able to overcome sorafenib resistance and strengthens sorafenib in suppressing sorafenib-resistant HCC cells in vitro and in animal models. Similar to its action on parental HCC cells, SOV induced cell cycle arrest at G2/M phases by regulating cyclin B1 and cyclin-dependent kinase 1, and apoptosis by reducing mitochondrial membrane potential, in sorafenib-resistant HCC cells. More importantly, SOV inhibited ATPase activity, which was significantly elevated in sorafenib-resistant HCC cells. SOV also reduced the expression of HIF-1α and HIF-2α and their nuclear translocation, resulting in downregulation of their downstream factors including vascular endothelial growth factor, lactate dehydrogenase-A and glucose transporter 1. Its ability to inhibit ATPase activity and hypoxia-inducible pathways enabled SOV to efficiently suppress both normoxic and hypoxic cells, which compose cancer cell populations inside sorafenib-resistant HCC tumors. The present results indicate that SOV may be a potent candidate drug for overcoming the resistance to sorafenib in treating HCC.
Conflict of interest statement
The authors declare no competing interests.
Figures
Similar articles
-
2-Methoxyestradiol synergizes with sorafenib to suppress hepatocellular carcinoma by simultaneously dysregulating hypoxia-inducible factor-1 and -2.Cancer Lett. 2014 Dec 1;355(1):96-105. doi: 10.1016/j.canlet.2014.09.011. Epub 2014 Sep 11. Cancer Lett. 2014. PMID: 25218350
-
Upregulation of HIF-2α induced by sorafenib contributes to the resistance by activating the TGF-α/EGFR pathway in hepatocellular carcinoma cells.Cell Signal. 2014 May;26(5):1030-9. doi: 10.1016/j.cellsig.2014.01.026. Epub 2014 Jan 29. Cell Signal. 2014. PMID: 24486412
-
Hypoxia-mediated sorafenib resistance can be overcome by EF24 through Von Hippel-Lindau tumor suppressor-dependent HIF-1α inhibition in hepatocellular carcinoma.Hepatology. 2013 May;57(5):1847-57. doi: 10.1002/hep.26224. Epub 2013 Mar 14. Hepatology. 2013. PMID: 23299930
-
Sorafenib resistance in hepatocarcinoma: role of hypoxia-inducible factors.Exp Mol Med. 2018 Oct 12;50(10):1-9. doi: 10.1038/s12276-018-0159-1. Exp Mol Med. 2018. PMID: 30315182 Free PMC article. Review.
-
Hypoxia inducible factor in hepatocellular carcinoma: A therapeutic target.World J Gastroenterol. 2015 Nov 14;21(42):12171-8. doi: 10.3748/wjg.v21.i42.12171. World J Gastroenterol. 2015. PMID: 26576101 Free PMC article. Review.
Cited by
-
Stabilization of Hypoxia-Inducible Factors and BNIP3 Promoter Methylation Contribute to Acquired Sorafenib Resistance in Human Hepatocarcinoma Cells.Cancers (Basel). 2019 Dec 9;11(12):1984. doi: 10.3390/cancers11121984. Cancers (Basel). 2019. PMID: 31835431 Free PMC article.
-
Link of sorafenib resistance with the tumor microenvironment in hepatocellular carcinoma: Mechanistic insights.Front Pharmacol. 2022 Aug 22;13:991052. doi: 10.3389/fphar.2022.991052. eCollection 2022. Front Pharmacol. 2022. PMID: 36071839 Free PMC article. Review.
-
Sorafenib-associated translation reprogramming in hepatocellular carcinoma cells.RNA Biol. 2025 Dec;22(1):1-11. doi: 10.1080/15476286.2025.2483484. Epub 2025 Mar 24. RNA Biol. 2025. PMID: 40116042 Free PMC article.
-
TINAGL1 promotes hepatocellular carcinogenesis through the activation of TGF-β signaling-medicated VEGF expression.Cancer Manag Res. 2019 Jan 15;11:767-775. doi: 10.2147/CMAR.S190390. eCollection 2019. Cancer Manag Res. 2019. PMID: 30697069 Free PMC article.
-
LncRNA SNHG1 contributes to sorafenib resistance by activating the Akt pathway and is positively regulated by miR-21 in hepatocellular carcinoma cells.J Exp Clin Cancer Res. 2019 May 3;38(1):183. doi: 10.1186/s13046-019-1177-0. J Exp Clin Cancer Res. 2019. PMID: 31053148 Free PMC article.
References
-
- Siegel RL, Miller KD, Jemal A. Cancer Statistics, 2017. CA: a cancer journal for clinicians. 2017;67:7–30. - PubMed
Publication types
MeSH terms
Substances
LinkOut - more resources
Full Text Sources
Other Literature Sources
Medical
Molecular Biology Databases
