. 2018 Jun 12:9:763.
doi: 10.3389/fpls.2018.00763. eCollection 2018.

Elicitor-Based Biostimulant PSP1 Protects Soybean Against Late Season Diseases in Field Trials

Affiliations

Elicitor-Based Biostimulant PSP1 Protects Soybean Against Late Season Diseases in Field Trials

Nadia R Chalfoun et al. Front Plant Sci. .

Abstract

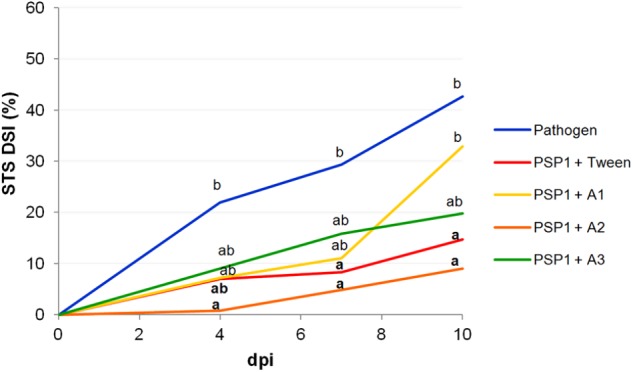
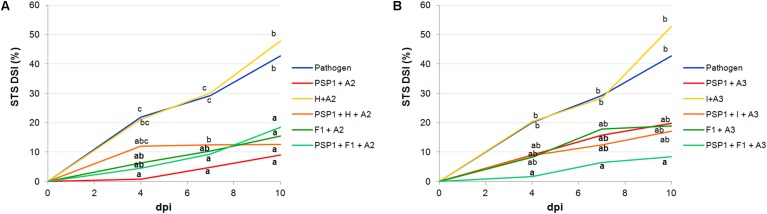
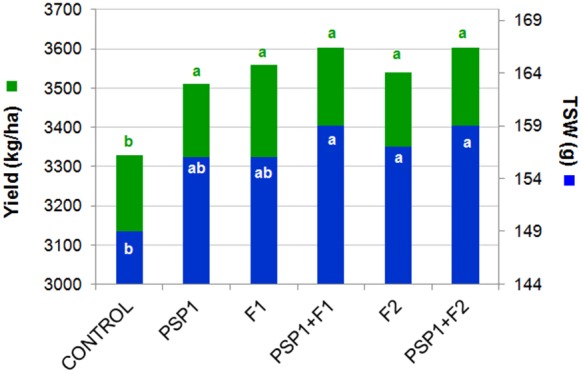
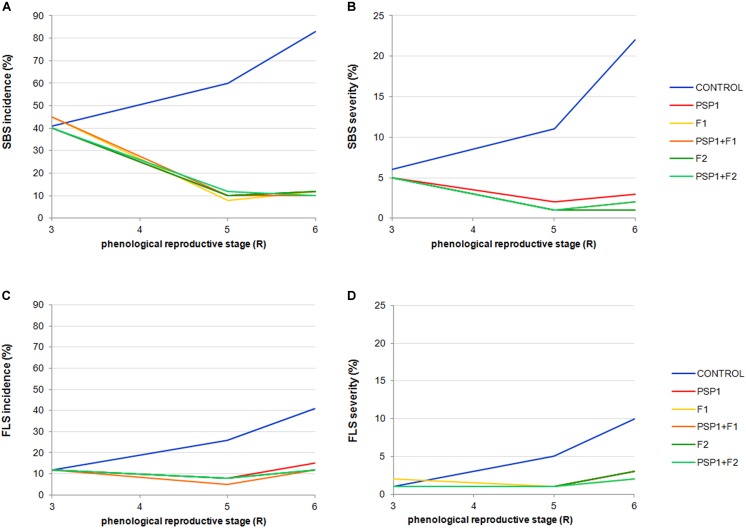
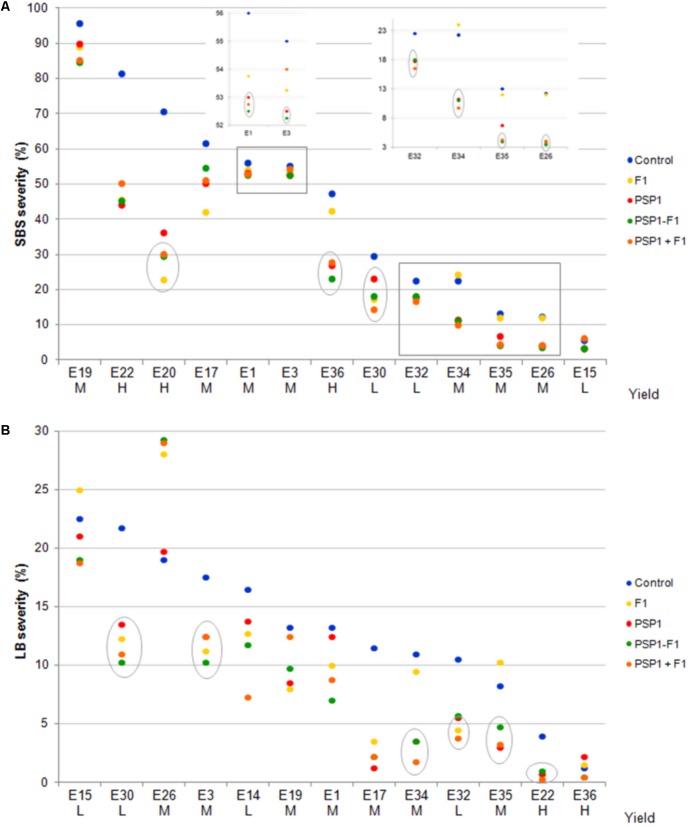
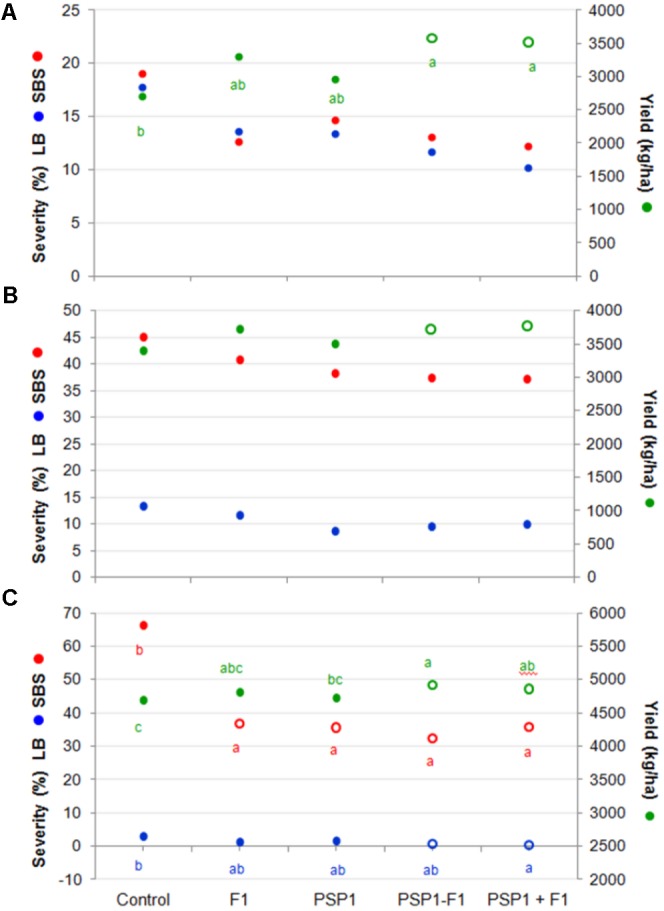
Currently, fungicide application in soybean production accounts for an important amount of global pesticide use, and it is therefore most desirable to find new healthier and more environmental friendly alternatives for the phytosanitary management in this crop. In this study, we present convincing evidence for effective induction of disease protection by the agricultural biostimulant PSP1, a formulation based on the plant-defense eliciting activity of the fungal protease AsES (Acremonium strictum elicitor subtilisin), in multiple field trials in Argentina. PSP1 was shown to combine well with commercial spray adjuvants, an insecticide, a herbicide and fungicides used in Argentinian soybean production without losing any defense-inducing activity, indicating an easy and efficient adaptability to conventional soybean production and disease management in the region. Results from multiple soybean field trials conducted with different elite genotypes at several locations during two consecutive growing seasons, showed that PSP1 is able to induce an enhanced pathogen defense which effectively reduced late season disease (LSD) development in field-grown soybean. This defense response seems to be broad-range as disease development was clearly reduced for at least three different fungi causing LSDs in soybean (Septoria glycines, Cercospora kikuchii and Cercospora sojina). It was noteworthy that application of PSP1 in soybean alone gave a similar protection against fungal diseases as compared to the commercial fungicides included in the field trials and that PSP1 applied together with a fungicide at reproductive stages enhanced disease protection and significantly increased grain yields. PSP1 is the first example of an elicitor-based strategy in order to efficiently control multiple fungal diseases under field conditions in the soybean crop. These results show the feasibility of using induced resistance products as complements or even full-good replacements to currently used chemical pesticides, fulfilling a role as important components of a more sustainable crop disease management system.

Keywords: AsES; Cercospora kikuchii; Cercospora sojina; Corynespora cassiicola; Septoria glycines; crop protection.


Figures

FIGURE 1
FIGURE 1
Effect of surfactant adjuvants on the defense-eliciting activity of PSP1 against C. cassiicola in soybean. Aqueous solutions of PSP1 (0.5 U ml-1), combined with Tween 20, A1 [nonylphenol ethoxylates (NPEs) + chelating and acidifying agents], A2 (NPEs + silicone and anti-evaporation agent) and A3 [fatty acid methyl esters (FAME)], were sprayed on soybean plants grown under controlled conditions 3 days prior to inoculation with the virulent strain C4 of C. cassiicola (5 × 10⁴ conidia/ml) and induced resistance against soybean target spot (STS) was determined. Nine biological replicates (potted plants) were assessed for each treatment and the experiment was carried out twice. Factorial ANOVA test indicated no significant differences between the two experimental repetitions (P > 0.05) and results from one representative experiment are shown. STS severity was evaluated on V3 and V4 trifoliate leaves of soybean plants treated with a product or mock (pathogen control) as the percentage of leaf area covered with disease symptoms and calculated as disease severity index (DSI) at 4, 7, and 10 days post-inoculation (dpi). Mean values of DSI at different time points are reported for each treatment calculated from one representative experiment with nine biological replicates. Values followed by different letters are significantly different according to Tukey’s HSD test (P < 0.05). Bold letters indicate statistically significant differences in STS protection of PSP1-treated plants as compared to mock-treated soybean plants, both infected with pathogenic strain C4 (Dunnett’s test; P < 0.05).
FIGURE 2
FIGURE 2
PSP1 compatibility with commercial agrochemical products: insecticide (I), herbicide (H) and fungicide (F1) combined with different adjuvants. The tested mixtures with adjuvant A2 are shown in (A): PSP1+A2, H+A2, PSP1+H+A2, F1+A2 and PSP1+F1+A2; and those with adjuvant A3 are shown in (B): PSP1+A3, I+A3, PSP1+I+A3, F1+A3 and PSP1+F1+A3. These mixtures were applied in soybean plants grown under controlled conditions 3 days prior to inoculation with the virulent strain C4 of C. cassiicola (5 × 10⁴ conidia/ml) and induced resistance against sobean target spot (STS) was determined. Nine biological replicates (potted plants) were assessed for each treatment and the experiment was carried out twice. Factorial ANOVA test indicated no significant differences between the two experimental repetitions (P > 0.05) and results from one representative experiment are shown. STS severity was evaluated on V3 and V4 trifoliate leaves of soybean plants treated with a product or mock (pathogen control) as the percentage of leaf area covered with disease symptoms and calculated as disease severity index (DSI) at 4, 7, and 10 days post-inoculation (dpi). Mean values of DSI at different time points are reported for each treatment calculated from one representative experiment with nine biological replicates. Values followed by different letters are significantly different according to Tukey’s HSD test (P < 0.05). Bold letters indicate statistically significant differences in STS protection of PSP1-treated plants as compared to mock-treated soybean plants, both infected with pathogenic strain C4 (Dunnett’s test; P < 0.05).
FIGURE 3
FIGURE 3
Soybean field trial in Tandil during growing season 2013/14. Yield (kg/ha) and TSW (g) were determined. All treatments were performed when soybean crop had reached the reproductive phenological stage R3. Control plants received standard soybean crop management without foliar fungicide application. F1 dosage = 150 ml/ha, F2 dosage = 400 ml/ha and PSP1 dosage = 2,000 ml/ha. Different letters in each column indicate statistically significant differences (according to Tukey’s HSD test; p < 0.05).
FIGURE 4
FIGURE 4
Soybean field trial conducted in Tandil during growing season 2013/14. Incidence and severity of SBS evaluated at phenological stages R3, R5, and R6 are shown in (A,B), respectively. Incidence and severity of FPS evaluated at phenological stages R3, R5, and R6 are shown in (C,D), respectively. Treatments were control (received standard soybean crop management without foliar fungicide or biocontrol treatment), PSP1, fungicide F1, fungicide F2, PSP1 plus fungicide F1 and PSP1 plus fungicide F2. The collected data, although highly informative, was not sufficient to perform a thorough statistical analysis.
FIGURE 5
FIGURE 5
Soybean field trials at 14 different locations in the central region of Argentina during growing season 2014-15. Severities (%) of SBS (S. glycines) and LB (C. kikuchii) assessed 40 days after R3 application are shown in (A,B), respectively. Trials (named E) are ranked according to decreasing severity values in the control treatment for each disease and classified according grain yield in low (L), medium M and high yield (H). Treatments were control (standard soybean crop management without foliar fungicide or biocontrol treatment), F1 (fungicide F1 alone at R3), PSP1 (PSP1 alone at V6), PSP1-F1 (PSP1 at V6 plus fungicide F1 at R3 one at the time) and PSP1+F1 (PSP1 plus fungicide F1 at R3 at the same time). Symbols in gray circles indicate treatments significant different to the correspondent control treatment (according to Dunnet test; p < 0.05) and gray boxes are enlarged on the inserted graphics for better view. SBS or LB severity were not evaluated for E14 and E20, respectively. L, low yield; M, medium yield; H, high yield.
FIGURE 6
FIGURE 6
Soybean field trials at 14 different locations in the central region of Argentina during the 2014-15 growing season. Trials were divided in (A) low yield (L; < 3,000 kg/ha), (B) medium yield (MY; >3,000 and <4,500 kg/ha), and (C) high yield (H; >4,500 kg/ha). SBS severity (%), LB severity (%) and yield (kg/ha) in each subset of trials were evaluated. Treatments were control (received standard soybean crop management without foliar fungicide or biocontrol treatment), F1 (fungicide F1 at R3), PSP1 (PSP1 alone at V6), PSP1-F1 (PSP1 at V6 plus fungicide F1 at R3) and PSP1+F1 (combined application of PSP1 plus fungicide F1 at R3). Letters indicate significant differences among treatments (according to Tukey’s HSD test; p < 0.05). Hollow symbols indicate treatments demonstrating significant statistical difference compared to the control treatment (according to Dunnet test; p < 0.05).

References

    1. Abdel-Monaim M. F., Ismail M. E., Morsy K. M. (2012). Induction of systemic resistance in soybean plants against Fusarium wilts disease by seed treatment with benzothiadiazole and humic acid. Afr. J. Biotechnol. 11 2454–2465. 10.5897/AJB10.1628 - DOI - PMC - PubMed
    1. Accamando A. K., Cronin J. T. (2012). Costs and benefits of jasmonic acid induced responses in soybean. Environ. Entomol. 41 551–561. 10.1603/EN11277 - DOI - PubMed
    1. Arsenault-Labrecque G., Menzies J. G., Bélanger R. R. (2012). Effect of silicon absorption on soybean resistance to Phakopsora pachyrhizi in different cultivars. Plant Dis. 96 37–42. 10.1094/PDIS-05-11-0376 - DOI - PubMed
    1. Aslam S. N., Erbs G., Morrissey K. L., Newman M. A., Chinchilla D., Boller T., et al. (2009). Microbe-associated molecular pattern (MAMP) signatures, synergy, size and charge: influences on perception or mobility and host defence responses. Mol. Plant Pathol. 10 375–387. 10.1111/j.1364-3703.2009.00537.x - DOI - PMC - PubMed
    1. Bradford M. M. (1976). A rapid and sensitive method for the quantitation of microgram quantities of protein utilizing the principle of protein-dye binding. Anal. Biochem. 72 248–254. 10.1016/0003-2697(76)90527-3 - DOI - PubMed

LinkOut - more resources