. 2018 Jun 22;7(3):18.
doi: 10.1167/tvst.7.3.18. eCollection 2018 Jun.

Neonatal Contrast Sensitivity and Visual Acuity: Basic Psychophysics

Affiliations

Neonatal Contrast Sensitivity and Visual Acuity: Basic Psychophysics

Angela M Brown et al. Transl Vis Sci Technol. .

Abstract

Purpose: This research was prospectively designed to determine whether a 0.083 cycles per degree (cy/deg) (20/7200) square-wave stimulus is a good choice for clinical measurement of newborn infants' contrast sensitivity and whether the contrast sensitivity function (CSF) of the newborn infant is band-pass. The results were retrospectively analyzed to determine whether the method of constant stimuli (MCS) and the descending method of limits (dLIM) yielded similar results.

Methods: In across-subjects experimental designs, a pilot experiment used MCS (N = 47 visual acuity; N = 38 contrast sensitivity at 0.083 cy/deg), and a main experiment used dLIM (N = 22 visual acuity; N = 22 contrast sensitivity at 0.083 cy/deg; N = 21 at 0.301 cy/deg) to measure visual function in healthy newborn infants. Three candidate CSFs estimated maximum neonatal contrast sensitivity. MCS and dLIM psychometric functions were compared while taking the stimulus presentation protocols into account.

Results: The band-pass CSF fit the data best, with a peak sensitivity near 0.31 at 0.22 cy/deg. However, the 0.083 cy/deg square-wave stimulus underestimated the best performance of newborn infants by less than 0.15 log10 units. MCS and dLIM data agreed well when the stimulus presentation contingencies were taken into account.

Conclusions: Newborn contrast sensitivity is well measured using a 0.083 cy/deg square-wave target, regardless of which CSF shape is correct. MCS and dLIM yield wholly comparable results, with no evidence to suggest effects of other factors such as infant inattention or examiner impatience.

Translational relevance: These measurements open the way for clinical behavioral measurement of infant visual acuity and contrast sensitivity in the neonatal period.

Keywords: acuity; contrast sensitivity; method of constant stimuli; method of limits; newborn infant.


Figures

Figure 1
Figure 1
Examples of the Newborn Acuity Cards and Newborn Contrast Cards. (A) The “easy” contrast card (0.083 cy/deg, 0.86 contrast); (B) a typical contrast card (0.303 cy/deg, 0.50 contrast); (C, D) acuity cards (0.50 and 1 cy/deg, both at 0.86 contrast). The luminance mismatch between the grating and the surrounding gray in this figure is an artifact of reproduction. In the actual stimuli, the space-averaged luminance match was excellent.
Figure 2
Figure 2
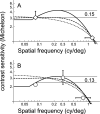
Results of experiment I (A) and experiment II (B). The data points are the medians and the error bars are the 95% confidence intervals of the medians. Continuous curves: the standard model of the adult CSF applied to square-waves., Dashed curves: the same model, only with the Minkowski pooling exponent set to 1 instead of 4. Dotted curves: a generic low-pass CSF, with log10(CS) being a linear function of the linear spatial frequency. The difference between the maximum of the CSF and the measured contrast sensitivity at 0.083 cy/deg was no more than 0.15 log10 units (a factor of 1.41), regardless of which model is correct. The fit of the standard (band-pass) model is much better than either low-pass model (see Discussion for details).
Figure 3
Figure 3
Threshold comparisons. The data points are the medians of individual subjects' thresholds (medians in panels A and C are also shown in Fig. 2). Error bars (when visible) are 95% sampling confidence intervals of the thresholds. Diamonds: MCS data. Circles: dLIM data. Squares: Predicted dLIM data (see Discussion). (A) Contrast sensitivities at 0.083 cy/deg from experiments I and II. (B) contrast sensitivities from Brown et al. (C) Visual acuities from experiments I and II. (D) Visual acuities from Brown and Yamamoto. Horizontal dashed lines: averages of all predicted or measured dLIM contrast sensitivity (A, B) and predicted or measured dLIM visual acuity (C, D).
Figure 4
Figure 4
The present dLIM data (larger black disks: contrast data at 0.301 cy/deg, acuity data at 0.86 contrast) compared to data from the literature on infants age 4 months or younger (lines extending to the right indicate other data on infants over age 4 months). Black symbols, card data; white or gray symbols, forced-choice preferential looking (FPL) data. Data that were scored as the last-seen stimulus (e.g., see McDonald et al.) are shown as one half “step” (typically, 0.075 log10 units) above their reported values so that all the data in both panels are defined at 75% correct (FPL) or 50% seeing (“yes/no”). For clarity, superimposed data points have been displaced by 2 days along the age axis. (A) Contrast sensitivity. Gray symbols, the maximum of the CSF is a lower bound on contrast sensitivity because the CSF was low-pass over the range of spatial frequencies tested. Data from Adams et al. (black squares); Adams and Courage (black diamond); Brown et al. (smaller black circle); Slater and Sykes (gray square); Atkinson et al. (white and gray circles); Banks and Salapatek (white and gray upright triangles); and Banks et al. (gray inverted triangles). (B) Visual acuity. Data from Allen (white circles,); Van Hof-Van Duin and Mohn (white diamonds); Gwiazda et al. (white triangles); McDonald et al. (black diamonds); Mayer et al. (black triangles), (black squares); Dobson (small black diamonds); Ipata et al. (small black inverted triangle), present data (black circle); Brown and Yamamoto (smaller black circle).
Figure 5
Figure 5
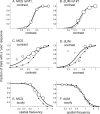
Group psychometric functions. Data collected using dLIM (right panels) are compared to data collected using MCS (left panels). White circles indicate pooled data on all infants (including incomplete data sets), with the area of each data point proportional to the number of observations. Bold smooth curves are weighted logistic functions fitted to the white data points. Black dots indicate predicted dLIM performance from simulations based on MCS data. Dashed lines in left panels are the analytic predictions from Eq. 5, fine smooth curves fitted to the simulations. (A, B) Results from Brown et al.; (C–F) results of the present experiment.

References

    1. Brown AM, Lindsey DT, Cammenga JG, Giannone PJ, Stenger MR. . The contrast sensitivity of the newborn human infant newborn contrast sensitivity. Invest Ophthalmol Vis Sci. 2015; 56: 625– 632. - PMC - PubMed
    1. Campbell F, Robson J. . Application of Fourier analysis to the visibility of gratings. J Physiol. 1968; 197: 551– 566. - PMC - PubMed
    1. Hopkins GR, Douherty BE, Brown AM. . The Ohio Contrast Cards: visual performance in a pediatric low-vision site. Optom Vis Sci. 2017; 94: 946. - PMC - PubMed
    1. Brown AM, Yamamoto M. . Visual acuity in newborn and preterm infants measured with grating acuity cards. Am J Ophthalmol. 1986; 102: 245– 253. - PubMed
    1. McDonald M, Dobson V, Sebris SL, Daich L, Varner D, Teller DY. . The acuity card procedure: a rapid test of infant acuity. Invest Ophthalmol Vis Sci. 1985; 26: 1158– 1162. - PubMed

LinkOut - more resources