

Single-cell membrane drug delivery using porous pen nanodeposition
- PMID: 29946596
- PMCID: PMC6528655
- DOI: 10.1039/c8nr02600a
Single-cell membrane drug delivery using porous pen nanodeposition
Abstract
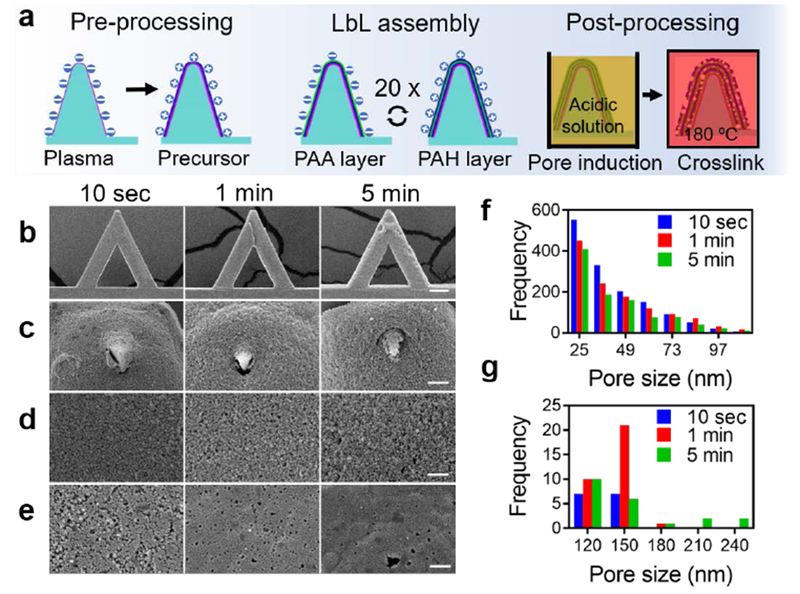
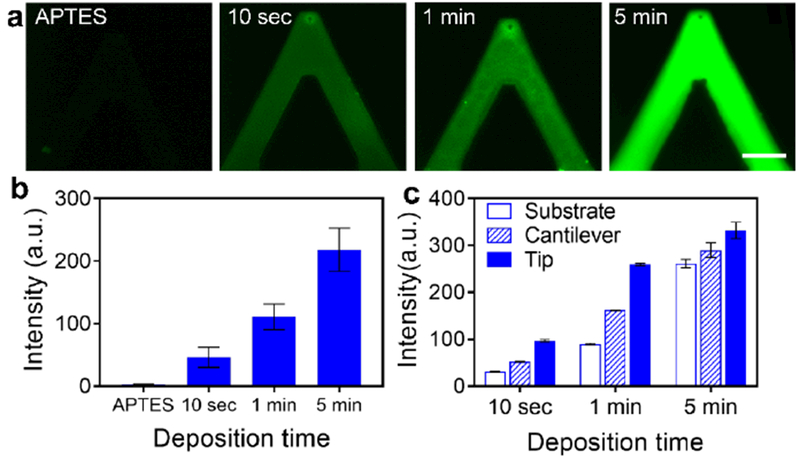
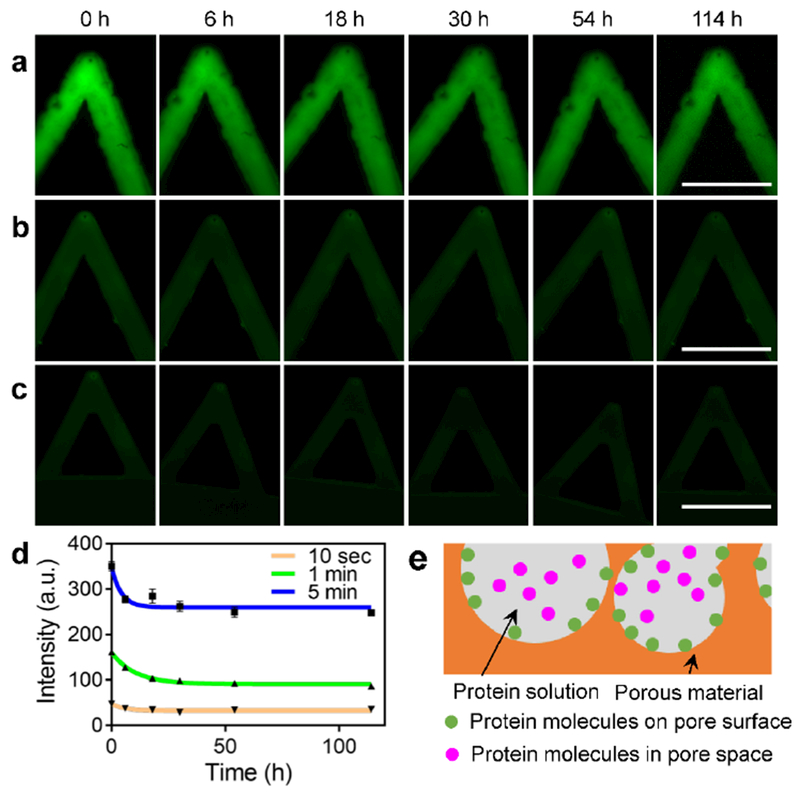
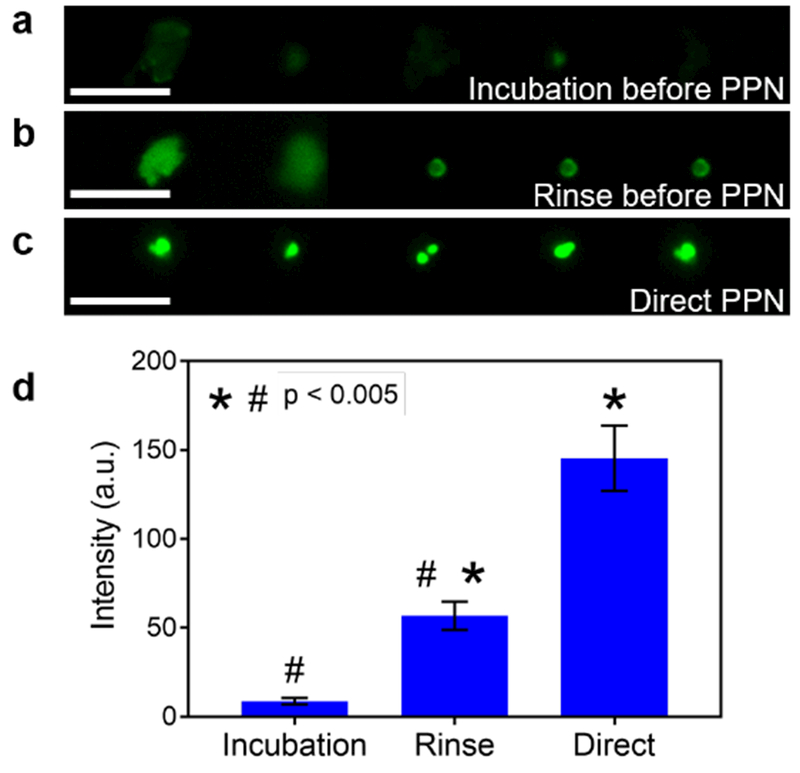
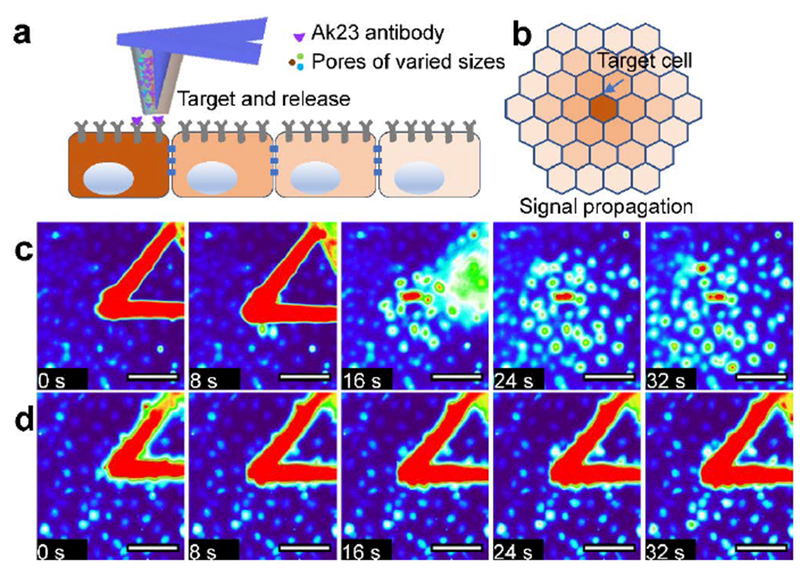
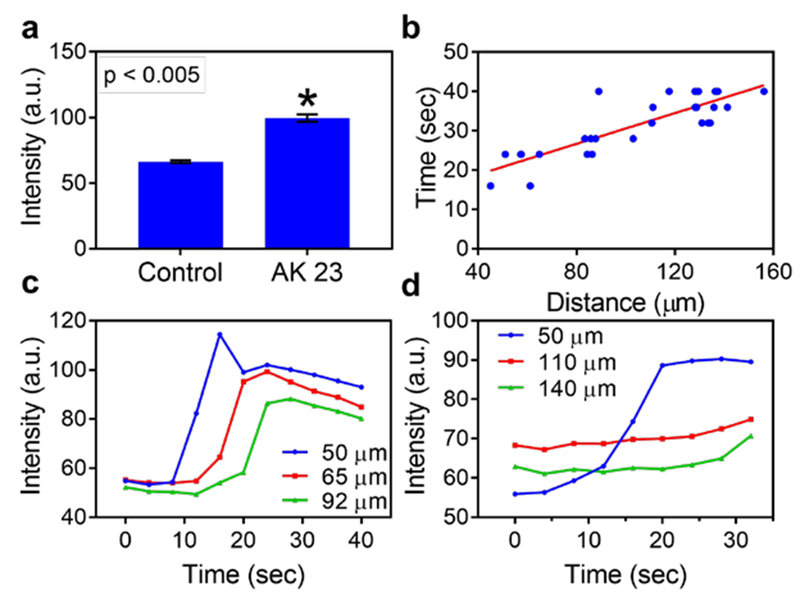
Delivering molecules onto the plasma membrane of single cells is still a challenging task in profiling cell signaling pathways with single cell resolution. We demonstrated that a large quantity of molecules could be targeted and released onto the membrane of individual cells to trigger signaling responses. This is achieved by a porous pen nanodeposition (PPN) method, in which a multilayer porous structure, serving as a reservoir for a large amount of molecules, is formed on an atomic force microscope (AFM) tip using layer-by-layer assembly and post processing. To demonstrate its capability for single cell membrane drug delivery, PPN was employed to induce a calcium flux triggered by the binding of released antibodies to membrane antigens in an autoimmune skin disease model. This calcium signal propagates from the target cell to its neighbors in a matter of seconds, proving the theory of intercellular communication through cell-cell junctions. Collectively, these results demonstrated the effectiveness of PPN in membrane drug delivery for single cells; to the best of our knowledge, this is the first technique that can perform the targeted transport and delivery in single cell resolution, paving the way for probing complex signaling interactions in multicellular settings.
Conflict of interest statement
COMPETING FINANCIAL INTERESTS
The authors declare no conflict of interests.
Figures
Similar articles
-
Porous multilayer-coated AFM tips for dip-pen nanolithography of proteins.J Am Chem Soc. 2009 Jun 10;131(22):7526-7. doi: 10.1021/ja901756a. J Am Chem Soc. 2009. PMID: 19441834
-
Atomic force microscopy study of the antigen-antibody binding force on patient cancer cells based on ROR1 fluorescence recognition.J Mol Recognit. 2013 Sep;26(9):432-8. doi: 10.1002/jmr.2287. J Mol Recognit. 2013. PMID: 23836471
-
Quantitative analysis of drug-induced complement-mediated cytotoxic effect on single tumor cells using atomic force microscopy and fluorescence microscopy.IEEE Trans Nanobioscience. 2015 Jan;14(1):84-94. doi: 10.1109/TNB.2014.2370759. Epub 2014 Nov 20. IEEE Trans Nanobioscience. 2015. PMID: 25420270
-
Applications of biosensing atomic force microscopy in monitoring drug and nanoparticle delivery.Expert Opin Drug Deliv. 2014 Aug;11(8):1237-53. doi: 10.1517/17425247.2014.917078. Epub 2014 May 8. Expert Opin Drug Deliv. 2014. PMID: 24809228 Review.
-
Simultaneous AFM topography and recognition imaging at the plasma membrane of mammalian cells.Semin Cell Dev Biol. 2018 Jan;73:45-56. doi: 10.1016/j.semcdb.2017.08.025. Epub 2017 Aug 12. Semin Cell Dev Biol. 2018. PMID: 28807883 Review.
Cited by
-
Multiplexed high-throughput localized electroporation workflow with deep learning-based analysis for cell engineering.Sci Adv. 2022 Jul 22;8(29):eabn7637. doi: 10.1126/sciadv.abn7637. Epub 2022 Jul 22. Sci Adv. 2022. PMID: 35867793 Free PMC article.
-
Versatile Nanoplatforms with enhanced Photodynamic Therapy: Designs and Applications.Theranostics. 2020 Jun 5;10(16):7287-7318. doi: 10.7150/thno.46288. eCollection 2020. Theranostics. 2020. PMID: 32641993 Free PMC article. Review.
-
A paintbrush for delivery of nanoparticles and molecules to live cells with precise spatiotemporal control.Nat Methods. 2024 Mar;21(3):512-520. doi: 10.1038/s41592-024-02177-x. Epub 2024 Feb 12. Nat Methods. 2024. PMID: 38347139 Free PMC article.
-
Optimization of Protein-Protein Interaction Measurements for Drug Discovery Using AFM Force Spectroscopy.IEEE Trans Nanotechnol. 2019;18:509-517. doi: 10.1109/tnano.2019.2915507. Epub 2019 May 14. IEEE Trans Nanotechnol. 2019. PMID: 32051682 Free PMC article.
-
From Biophysics to Biomedical Physics.ACS Bio Med Chem Au. 2024 Dec 19;5(3):320-333. doi: 10.1021/acsbiomedchemau.4c00096. eCollection 2025 Jun 18. ACS Bio Med Chem Au. 2024. PMID: 40556778 Free PMC article. Review.
References
-
- Kensler TW, Wakabayashi N, Biswal S, Annu. Rev. Pharmacol. Toxicol 2007, 47, 89. - PubMed
-
- Josic D, Clifton JG, Proteomics 2007, 7, 3010. - PubMed
-
- Rask-Andersen M, Almén MS, Schiöth HB, Nat. Rev. Drug Discov 2011, 10, 579. - PubMed
-
- Noack M, Miossec P, Autoimmun. Rev 2014, 13, 668. - PubMed
-
- Heupel W-M, Zillikens D, Drenckhahn D, Waschke J, J. Immunol 2008, 181, 1825. - PubMed
MeSH terms
Grants and funding
LinkOut - more resources
Full Text Sources
Other Literature Sources
Miscellaneous