

The Cost of Complications Following Major Resection of Malignant Neoplasia
- PMID: 29946953
- PMCID: PMC6224301
- DOI: 10.1007/s11605-018-3850-6
The Cost of Complications Following Major Resection of Malignant Neoplasia
Abstract
Background: Rising healthcare costs have led to increased focus on the need to achieve a higher "value of care." As value-maximization efforts expand to include more complex surgical patients, evidence to support meaningful implementation of complication-based initiatives is lacking. The objective of this study was to compare incremental costs of complications following major gastrointestinal (GI) resections for organ-specific malignant neoplasia using nationally representative data.
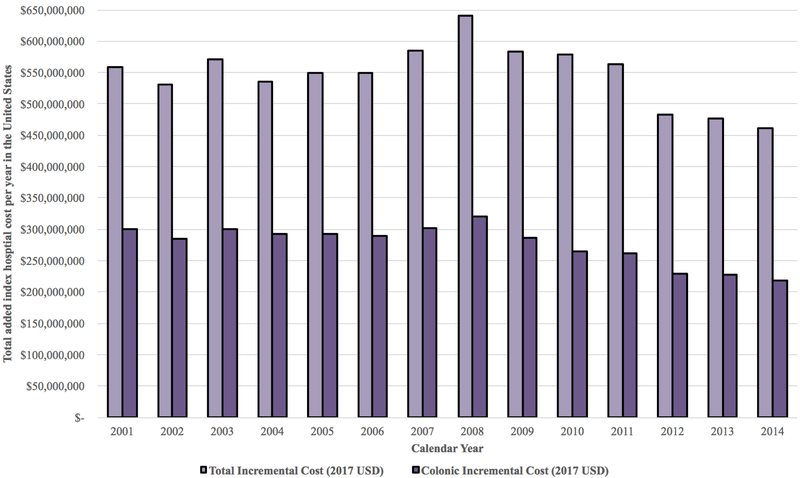
Methods: National (Nationwide) Inpatient Sample data, 2001-2014, were queried for adult (≥ 18 years) patients undergoing major resections for malignant neoplasia. Based on system-based complications considered relevant to the long-term treatment of GI disease, stratified differences in risk-adjusted incremental hospital costs and complication probabilities were compared. Differences in surgical outcomes and costs over time were also assessed.
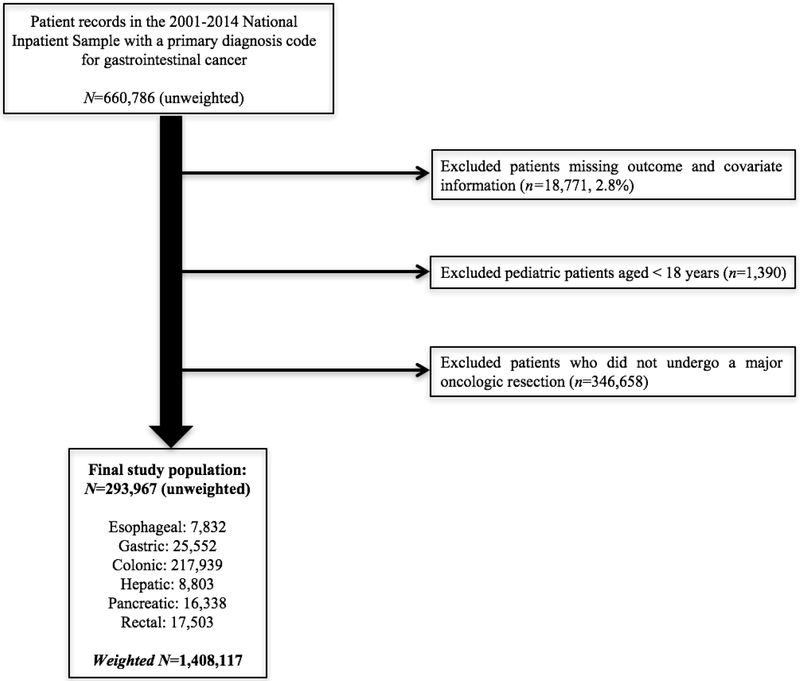
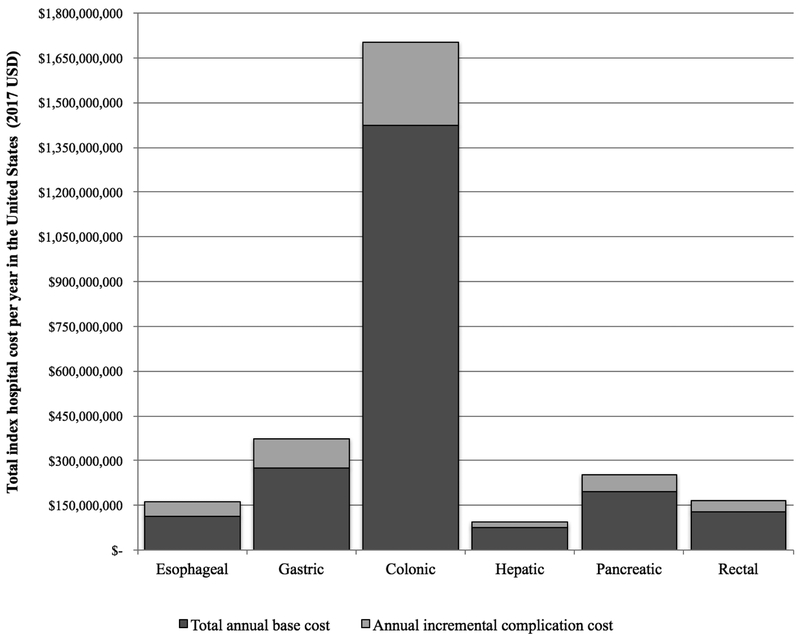
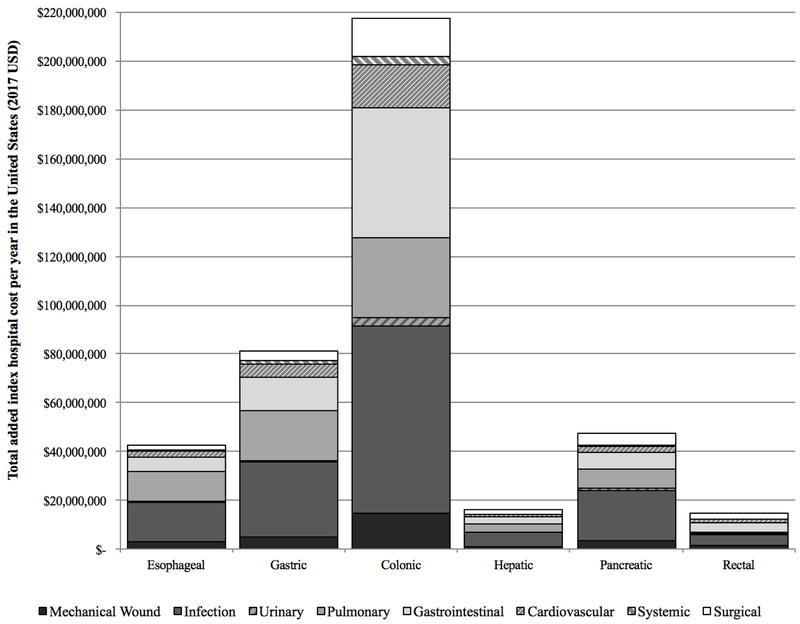
Results: A total of 293,967 patients were included, weighted to represent 1,408,117 patients nationwide. One fourth (26.1%; 95% CI, 25.7-26.4%) experienced ≥ 1 pre-discharge complication (range, 45.3% esophagectomy to 24.0% rectal resection). Resultant annual risk-adjusted incremental hospital costs totaled $540 million nationwide (19.5% of the overall cost of care and an average of $20,900 per patient). Costs varied substantially with both cancer/resection type and complication group, ranging from $76.7 million for colectomies with infectious complications to $0.2 million for rectal resections with urinary complications. For each resection type, infectious ($154.7 million), GI ($85.5 million), and pulmonary ($77.9 million) complications were among the most significant drivers of increased hospital cost.
Conclusions: Quantifying and comparing the impact of complications on an indication-specific level in more complex patients offers an important step toward allowing providers/payers to meaningfully prioritize the design of novel and adaptation of existing value-maximization approaches.
Keywords: Cancer; Complication; Cost; Infection; Oncology; Quality; Value.
Conflict of interest statement
Figures
References
-
- Health Expenditures Data for the U.S. May 2017, Centers for Disease Control and Prevention, National Center for Health Statistics. Available at: https://www.cdc.gov/nchs/fastats/health-expenditures.htm. Accessed January 1, 2018.
-
- National Health Expenditure Projections 2015-2025 Centers for Medicare and Medicaid Services (CMS). Available at: https://www.cms.gov/Research-Statistics-Data-and-Systems/Statistics-Tren.... Accessed January 1, 2018.
-
- GDP per capita growth (annual %): United States 2017, The World Bank Group. Available at: http://data.worldbank.org/indicator/NY.GDP.PCAP.KD.ZG?locations=US. Accessed January 1, 2018.
-
- Porter ME. What is value in health care? N Engl J Med 2010; 363(26):2477–81. - PubMed
Publication types
MeSH terms
Grants and funding
LinkOut - more resources
Full Text Sources
Other Literature Sources
Medical
Research Materials
