

T cell receptor repertoire profiling predicts the prognosis of HBV-associated hepatocellular carcinoma
- PMID: 29947152
- PMCID: PMC6089190
- DOI: 10.1002/cam4.1610
T cell receptor repertoire profiling predicts the prognosis of HBV-associated hepatocellular carcinoma
Abstract
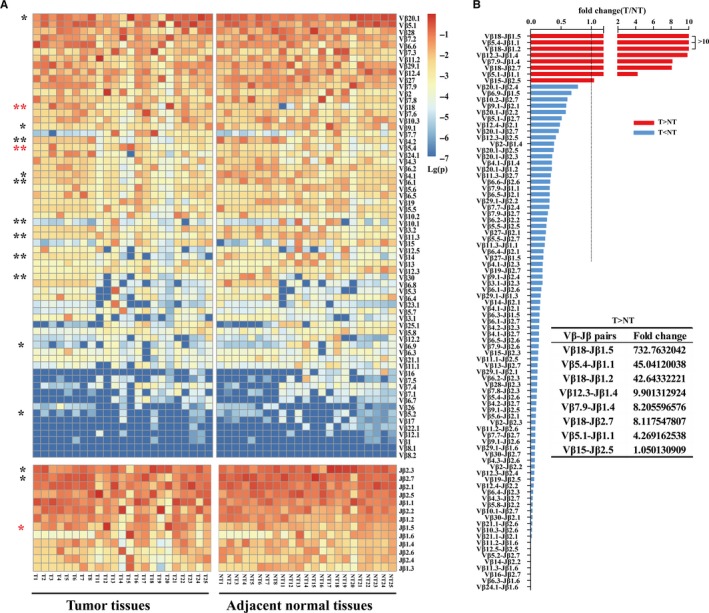
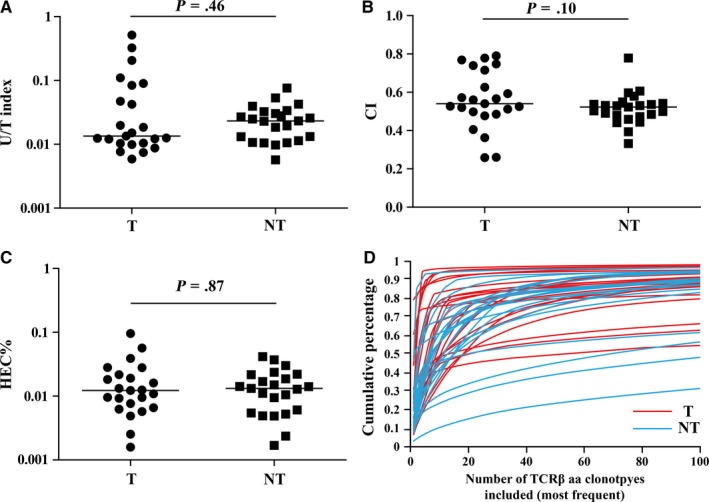
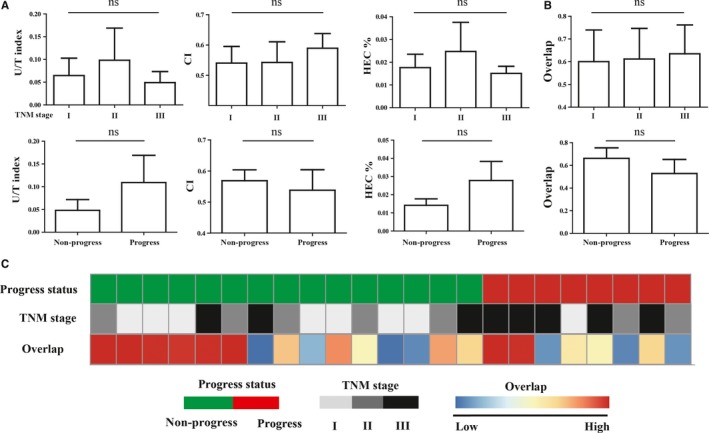
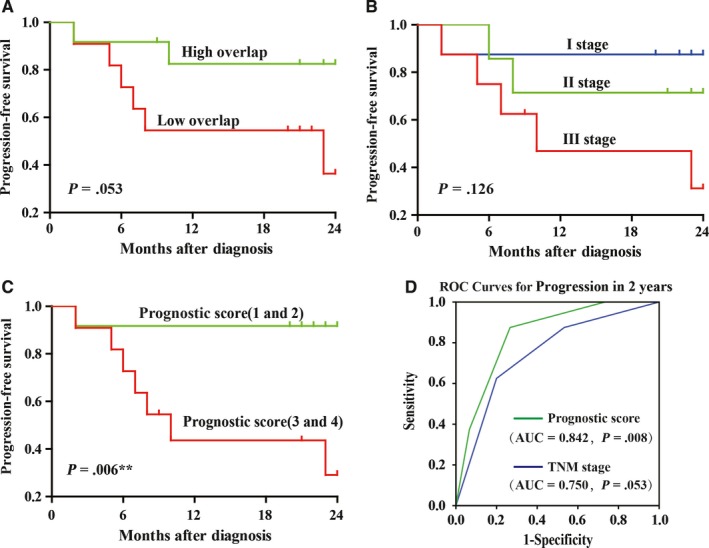
Tumor-infiltrating T cell repertoire has been demonstrated to be closely associated with anti-tumor immune response. However, the relationship between T cell repertoire in tumor tissue and prognosis has never been reported in Hepatocellular carcinoma (HCC). We performed the high-throughput T cell receptor (TCR) sequencing to systematically characterize the infiltrating T cell repertoires of tumor and matched adjacent normal tissues from 23 HBV-associated HCC patients. Significant differences on usage frequencies of some Vβ, Jβ, and Vβ-Jβ paired genes have been found between the 2 groups of tissue samples, but no significant difference of TCR repertoire diversity could be found. Interestingly, the similarity of TCR repertoires between paired samples or the TNM stage alone could not be helpful to evaluate the prognosis of patients very well, but their combination could serve as an efficient prognostic indicator that the patients with early stage and high similarity showed a better prognosis. This is the first attempt to assess the potential value of TCR repertoire in HCC prognosis, and our findings could serve as a complement for the characterization of TCR repertoire in HCC.
Keywords: TCR repertoire; hepatocellular carcinoma; high throughput sequencing; infiltrating T lymphocyte; prognosis.
© 2018 The Authors. Cancer Medicine published by John Wiley & Sons Ltd.
Figures
References
-
- El‐Serag HB, Rudolph KL. Hepatocellular carcinoma: epidemiology and molecular carcinogenesis. Gastroenterology. 2007;132:2557‐2576. - PubMed
-
- Arzumanyan A, Reis HM, Feitelson MA. Pathogenic mechanisms in HBV‐ and HCV‐associated hepatocellular carcinoma. Nat Rev Cancer. 2013;13:123‐135. - PubMed
-
- Bolondi L, Gramantieri L. From liver cirrhosis to HCC. Intern Emerg Med. 2011;6(Suppl 1):93‐98. - PubMed
-
- Rosen HR. Clinical practice. Chronic hepatitis C infection. N Engl J Med. 2011;364:2429‐2438. - PubMed
-
- Bruix J, Boix L, Sala M, Llovet JM. Focus on hepatocellular carcinoma. Cancer Cell. 2004;5:215‐219. - PubMed
Publication types
MeSH terms
Substances
LinkOut - more resources
Full Text Sources
Other Literature Sources
Medical
