. 2018 Jul;27(7):1047-1067.
doi: 10.1177/0963689718779346. Epub 2018 Jun 27.

The impact of in vitro cell culture duration on the maturation of human cardiomyocytes derived from induced pluripotent stem cells of myogenic origin

Affiliations

The impact of in vitro cell culture duration on the maturation of human cardiomyocytes derived from induced pluripotent stem cells of myogenic origin

Jarosław Lewandowski et al. Cell Transplant. 2018 Jul.

Abstract

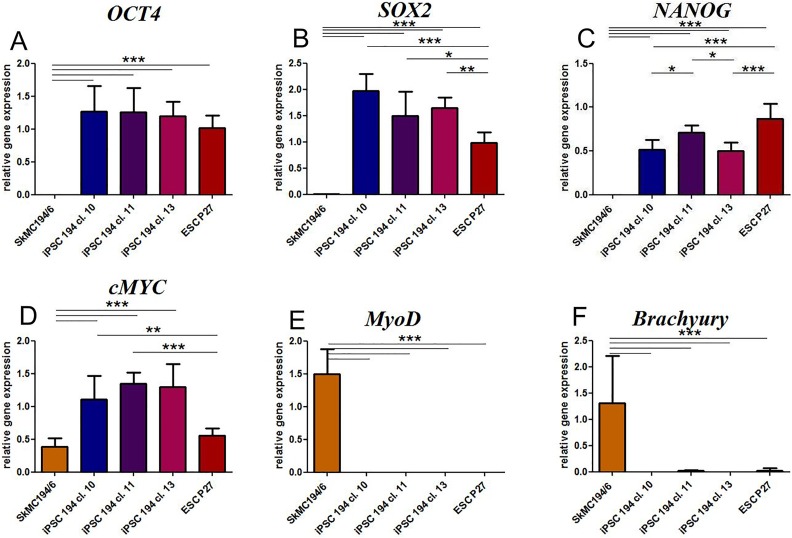
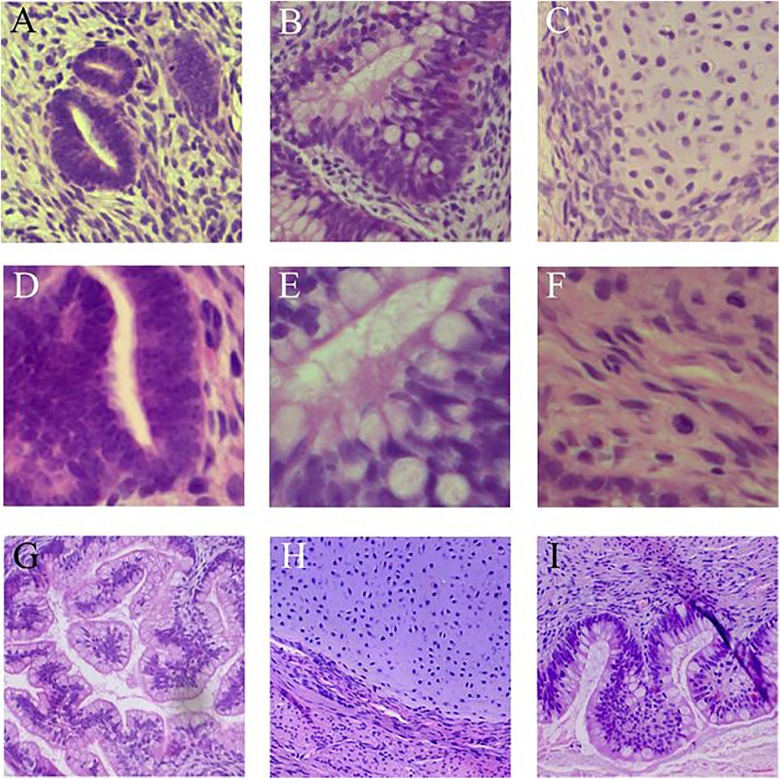
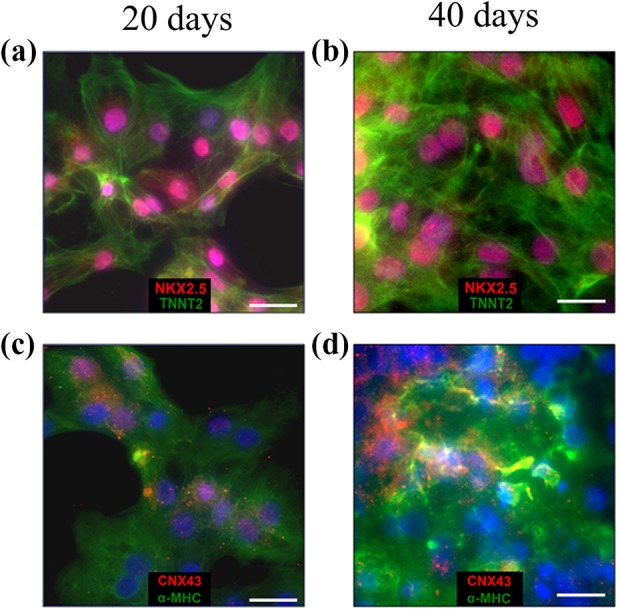
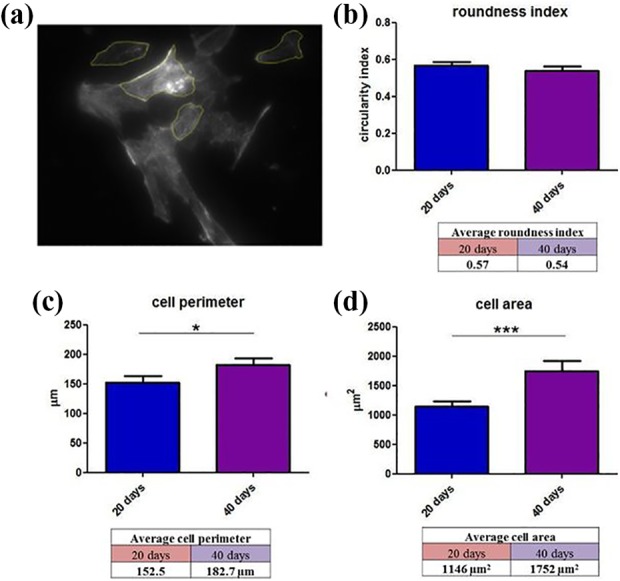
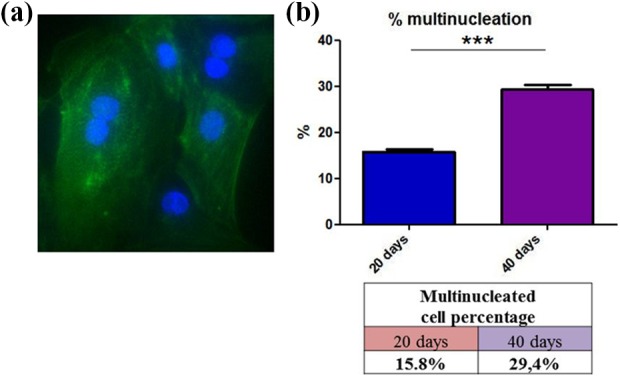
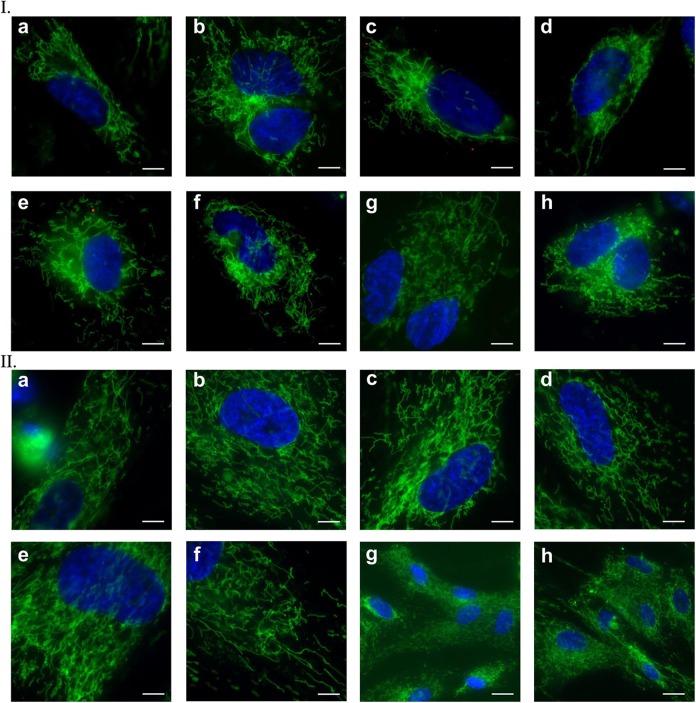
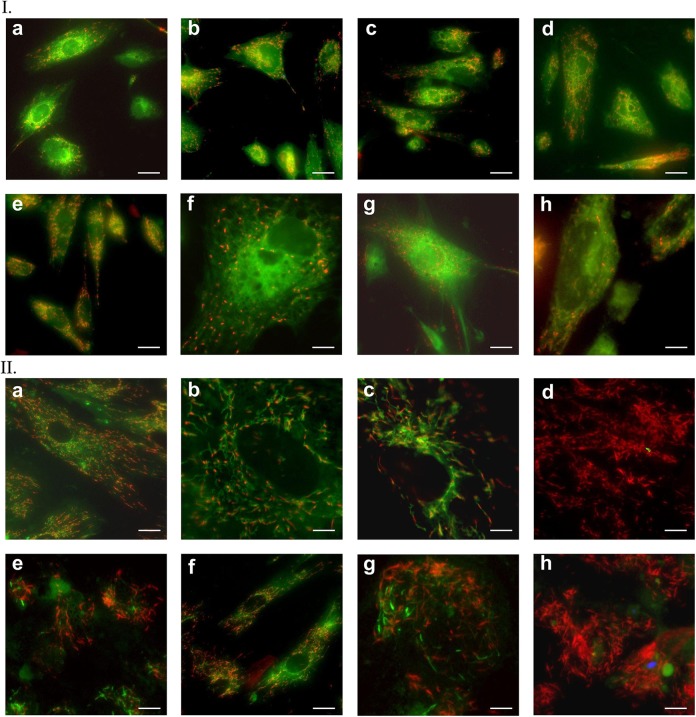
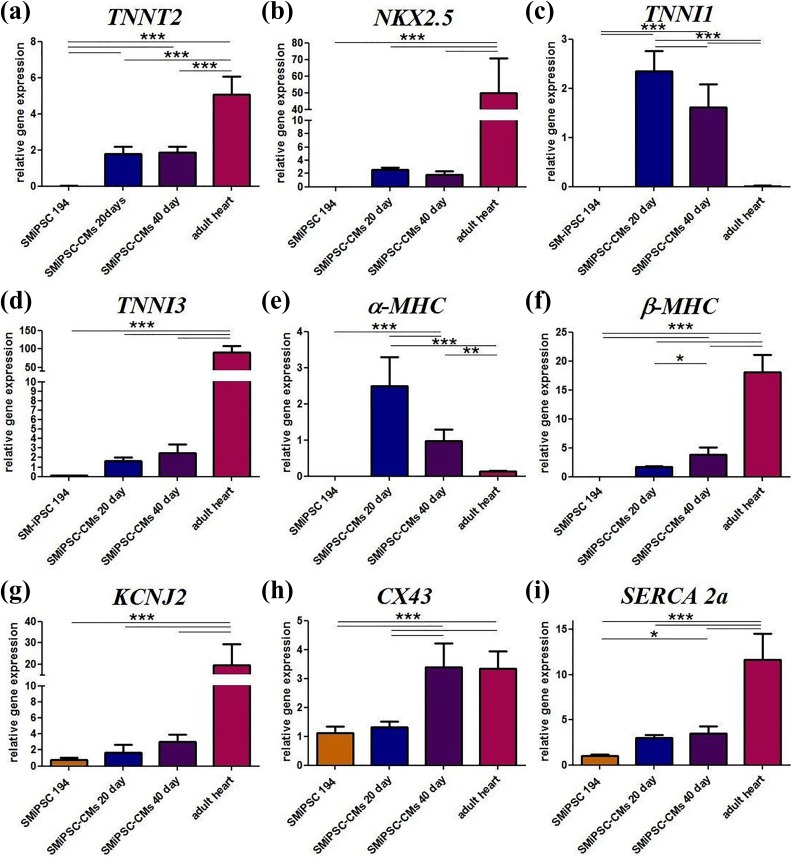
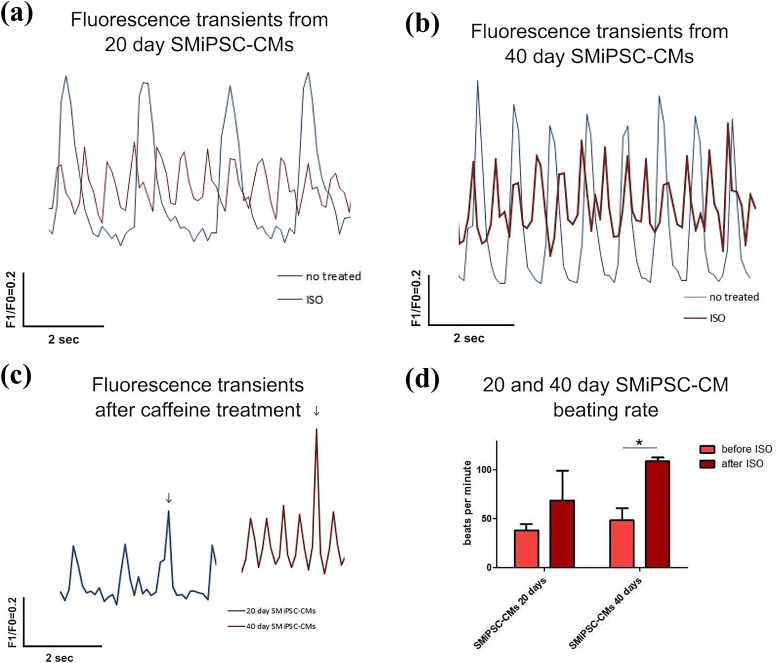
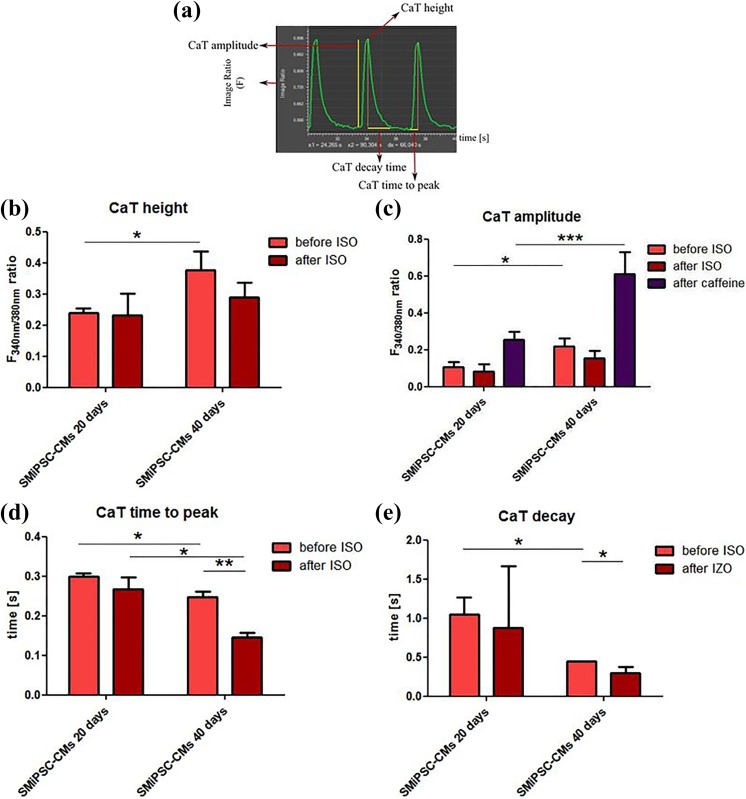
Ischemic heart disease, also known as coronary artery disease (CAD), poses a challenge for regenerative medicine. iPSC technology might lead to a breakthrough due to the possibility of directed cell differentiation delivering a new powerful source of human autologous cardiomyocytes. One of the factors supporting proper cell maturation is in vitro culture duration. In this study, primary human skeletal muscle myoblasts were selected as a myogenic cell type reservoir for genetic iPSC reprogramming. Skeletal muscle myoblasts have similar ontogeny embryogenetic pathways (myoblasts vs. cardiomyocytes), and thus, a greater chance of myocardial development might be expected, with maintenance of acquired myogenic cardiac cell characteristics, from the differentiation process when iPSCs of myoblastoid origin are obtained. Analyses of cell morphological and structural changes, gene expression (cardiac markers), and functional tests (intracellular calcium transients) performed at two in vitro culture time points spanning the early stages of cardiac development (day 20 versus 40 of cell in vitro culture) confirmed the ability of the obtained myogenic cells to acquire adult features of differentiated cardiomyocytes. Prolonged 40-day iPSC-derived cardiomyocytes (iPSC-CMs) revealed progressive cellular hypertrophy; a better-developed contractile apparatus; expression of marker genes similar to human myocardial ventricular cells, including a statistically significant CX43 increase, an MHC isoform switch, and a troponin I isoform transition; more efficient intercellular calcium handling; and a stronger response to β-adrenergic stimulation.

Keywords: Cardiac differentiation; cardiomyocyte maturation; cardiomyogenesis; iPSCs; skeletal myoblasts.


Conflict of interest statement

Declaration of Conflicting Interests: The authors declared no potential conflicts of interest with respect to the research, authorship, and/or publication of this article.

Figures

Figure 1.
Figure 1.
Endogenous gene expression markers in established cell clones of the iPSC 194 cell line: (a) OCT4, (b) SOX2, (c) NANOG, (d) c-MYC (typical of pluripotent cells), (e) MyoD (skeletal myoblast marker), and (f) BRACHYURY (mesoderm marker). Human embryonal cells (ESC P27) served as a positive control. The expression of the studied genes was normalized to the expression of two housekeeping genes (ACTB and GAPDH). Samples: SkMC 194/6: skeletal myoblast cells from patient no. 194 after the sixth passage; iPSC 194 cl. 10/11/13: clones 10, 11, and 13 of the induced pluripotent stem cell line no. 194 of myoblastoid origin; ESC P27: embryonal stem cell line after the 27th passage. Values are given as means ± SD; *p < 0.05, **p < 0.01, ***p < 0.001. ACTB: β-actin; c-MYC: cellular c-Myc oncogene product; ESCs: embryonic stem cells; GAPDH: glyceraldehyde 3-phosphate dehydrogenase; iPSCs: induced pluripotent stem cells; MyoD: myogenic differentiation 1; OCT4: octamer-binding transcription factor 4; SOX2: sex determining region Y - box 2.
Figure 2.
Figure 2.
Immunostaining of: (a) SMiPSCs with the pluripotency markers located in nuclei (OCT4 and SOX2) and on the surface (TRA1-60, TRA-81, and SSEA-4 antigens); (b) ESC (P27) line with the nuclear markers OCT4 and c-MYC and the surface markers TRA1-60 and TRA-81; (c) human myoblasts as a primary cell suspension with SOX2, NANOG, and c-MYC (pluripotency markers), desmin (muscle marker), BRACHYURY (mesoderm indicator), and NKX2-5 (cardiac marker). Scale bar: 50 μm.
Figure 3.
Figure 3.
A normal male karyotype was obtained from the generated SMiPSC 194 line.
Figure 4.
Figure 4.
Images taken from spontaneous in vitro differentiation via embryoid bodies: (a) SMiPSC-derived embryoid bodies on day 5 of in vitro suspension culture; (b) outgrowing embryoid body in adherent cell culture; (c) immunolabeled EBs demonstrated α-fetoprotein (AFP), smooth muscle actin (SMA), and neural class III β-tubulin (TUJ-1) expression. Magnification of (a) and (b) pictures at 10×. Scale is 50 μm.
Figure 5.
Figure 5.
Tissue-like structures specific for derivatives of three germ layers in SMiPSC-derived teratoma sections: (a) and (d): neural tube; (b), (e), (g), (i): endodermal originated secretory cells; (c), (f), (h): mesodermal derivatives: chondroid tissue (c), connective tissue (f), and chondroid tissue surrounded by smooth muscle cells (h). Images acquired at 40× ((a) to (c)), 63× ((d) to (f), and 20× ((g) to (i)) magnification with a Leica DMi8 fluorescence microscope.
Figure 6.
Figure 6.
Immunostaining on days 20 and 40 of cardiac differentiation in in vitro culture of NKX2.5 (an early cardiac differentiation marker), TNNT2 (cardiac troponin) ((a) and (b)) and α-MHC (myosin heavy chain α) (cardiac-specific marker), CNX43 (intercellular junction marker) ((c) and (d)). Scale bar is 50 μm.
Figure 7.
Figure 7.
Developing sarcomeres in SMiPSC-CMs: (a) Sarcomere measurements using LAS X software from a DMi8 fluorescence microscope. (b) The results of sarcomere length measurements for 55 cardiac cells on days 20 and 40 of in vitro differentiation. (c) and (d) α-actinin immunostaining at two analyzed cardiac differentiation time points. Plots: mean value + SEM. Scale bar is 50 μm.
Figure 8.
Figure 8.
Morphological parameters measured in cardiac myocytes (n=70) in in vitro cell differentiation culture: (a) Image included for measurement with LAS X software. Calculations were given as follows: (b) roundness index, (c) cell perimeter, and (d) cell area. Plots: mean value + SEM.
Figure 9.
Figure 9.
The binucleated cell content in differentiated cardiomyocytes on days 20 and 40 of in vitro culture: (a) Image showing α-actinin staining on day 40. (b) Percentage of multinucleated cells in the 200 cells counted for each analyzed time point.
Figure 10.
Figure 10.
Mitochondrial staining with MitoTracker Green after days 20 (I) and 40 (II) of cardiomyocyte differentiation in vitro. (a) to (h) Pictures of both analyzed time points refer to selected stained areas of in vitro cell culture. Scale bar: 50 μm and 150 μm for II(g) and II(h) images, respectively.
Figure 11.
Figure 11.
Mitochondrial staining with JC-1 dye on the 20th (I) and 40th (II) day of SMiPSC-CM in vitro differentiation culture. (a) to (h) Pictures of both analyzed time points refer to selected stained areas of in vitro cell culture. Scale bar: 50 μm and 150 μm for II(g) and II(h) images, respectively.
Figure 12.
Figure 12.
Cardiac gene expression in generated SMiPSC-CMs on days 20 and 40 of in vitro culture: (a) TNNT2, (b) NKX2.5, (c) TNNI1, (d) TNNI3, (e) α-MHC, (f) β-MHC, (g) KCNJ2, (h) CX43, and (i) SERCA 2a. ACTB and GAPDH gene expression was used to normalize the examined gene expression levels. Samples: SMiPSC 194: 194 line of induced pluripotent stem cells of skeletal myoblast origin as a negative control; SMiPSC-CMs 20/40 day: differentiated SMiPSC-derived cardiomyocytes on days 20 and 40 of in vitro cell differentiation culture; adult heart: sample collected from ventricular heart muscle as a positive reference. Plot: mean value + SD.
Figure 13.
Figure 13.
Calcium transients recorded before and after isoproterenol administration on days 20 and 40 of cardiac in vitro differentiation: (a) Isoproterenol treatment of 20-day cardiomyocytes reduced the amplitude of intracellular Ca2+ concentration [Ca2+]i transients, which at an increased rate of [Ca2+]i transients may be the cause of the decrease in voltage-gated L-type Ca2+ current (ICaL) or systolic SR Ca2+ content (i.e., impaired RyR functioning). (b) 40-day cardiomyocytes had a higher basal [Ca2+]i amplitude level than did 20-day cells in in vitro differentiation culture. (c) The fluorescence peak in caffeine-treated 20-day and 40-day SMiPSC-CM suspensions quickly reverted to the previous calcium transient rate, suggesting improperly activated RyR receptors. The time resolution of the signal collected with a Leica DMi8 fluorescence microscope was approx. 10 times per second. F1/F0 represents the normalized FURA-2 emission fluorescence ratio from excitation at 340 nm and 380 nm. (d) The beating rate of 20- and 40-day SMiPSC-CMs before and after isoproterenol treatment. The beating frequency of SMIPSC-CMs was measured as an average value from three cell culture wells (triplicate); five beating areas were considered within each well. * Statistically significant increase of the beating rate after ISO administration on day 40 (p<0.05)
Figure 14.
Figure 14.
Parameters of transient calcium turnover in the 194 cell line of SMiPSC-derived cardiomyocytes after 20 and 40 days of cell differentiation in vitro. (a) Demonstration of calcium parameters: CaT height is the maximum value of the F340 nm/F380 nm ratio at which Ca2+ triggers cell contraction. At this point, the calcium quantity in the cytoplasm reaches the highest level, and on the graph, the CaT height is denominated in a peak point; the CaT amplitude of the F1/F0 ratio refers to the magnitude of fluorescence changes from diastole (calcium residing in SR stores) until systole (triggered by calcium ions released to the cytoplasm); CaT time to peak is the time to reach the maximal F1/F0 ratio after Ca2+ release from the SR; CaT decay is the time needed to take up Ca2+ from the cytoplasm prior to diastole. (b) Average height of the fluorescence signal (F340nm/F380 nm ratio) refers to the intracellular calcium pool during contraction and before and after isoproterenol (ISO) administration. (c) Amplitude of fluorescence changes during SMiPSC-CM contraction, before and after isoproterenol administration and after caffeine treatment (activating RyR receptor and preventing Ca ion uptake into SR stores). (d) Time-to-peak F340nm/F380 nm ratio shortening before and after ISO addition. (e) The time of calcium decay before and after isoproterenol administration. The calcium measurements were taken in three cell culture areas, and the mean values originated from five repeats for each area examined.
Figure 15.
Figure 15.
Comparison of diverse transient kinetics of Ca2+ in 20-day SMiPSC-CMs under isoproterenol treatment. (a) Demonstration of a faulty calcium turnover pattern in 20-day iPSC-derived cardiomyocytes after isoproterenol stimulation in two analyzed cell culture areas. Clusters with slowed contractions (36 beats per minute on average) and disturbed calcium flow, including its uptake from the cytoplasm, a long plateau phase (lasting up to 1 second), and a slower calcium decay time reflect impairment of the contractile machinery. (b) The normal course of calcium transient morphology for another fragment of the examined cell culture surface. Measurements were conducted within 1 minute of fluorescent signal registration.

References

    1. Finegold JA, Asaria P, Francis DP. Mortality from ischaemic heart disease by country, region, and age: Statistics from World Health Organisation and United Nations. Int J Cardiol. 2013;168(2):934–45. - PMC - PubMed
    1. Dimmeler S, Burchfield J, Zeiher AM. Cell-based therapy of myocardial infarction. Arterioscler Thromb Vasc Biol. 2008;28(2):208–16. - PubMed
    1. Blin G, Nury D, Stefanovic S, Neri T, Guillevic O, Brinon B, Bellamy V, Rücker-Martin C, Barbry P, Bel A, Bruneval P, Cowan C, Pouly J, Mitalipov S, Gouadon E, Binder P, Hagège A, Desnos M, Renaud J-F, Menasché P, Pucéat M. A purified population of multipotent cardiovascular progenitors derived from primate pluripotent stem cells engrafts in postmyocardial infarcted nonhuman primates. J Clin Invest. 2010;120(4):1125–39. - PMC - PubMed
    1. Takahashi K, Yamanaka S. Induction of pluripotent stem cells from mouse embryonic and adult fibroblast cultures by defined factors. Cell. 2006;126(4):663–76. - PubMed
    1. Thomson JA, Shapiro SS, Waknitz MA, Marshall VS. Embryonic stem cell lines derived from human blastocysts. Science. 1998;282(5391):1145–7. - PubMed

Publication types

LinkOut - more resources