. 2018;14(8):1404-1418.
doi: 10.1080/15548627.2018.1461294. Epub 2018 Jul 28.

Age- and disease-dependent increase of the mitophagy marker phospho-ubiquitin in normal aging and Lewy body disease

Affiliations

Age- and disease-dependent increase of the mitophagy marker phospho-ubiquitin in normal aging and Lewy body disease

Xu Hou et al. Autophagy. 2018.

Abstract

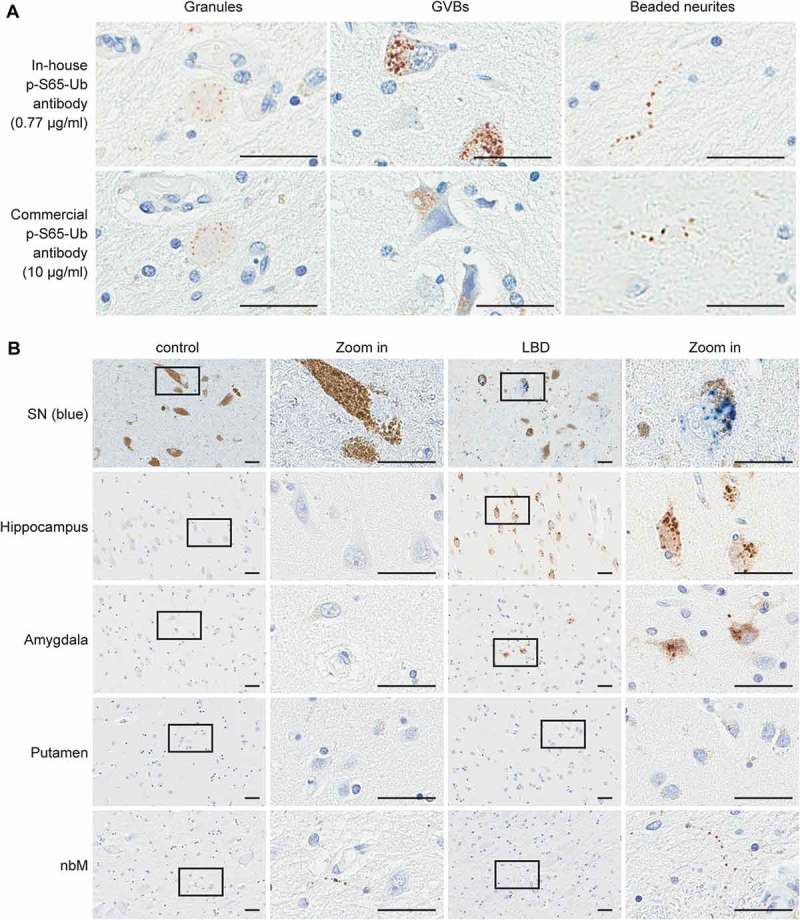
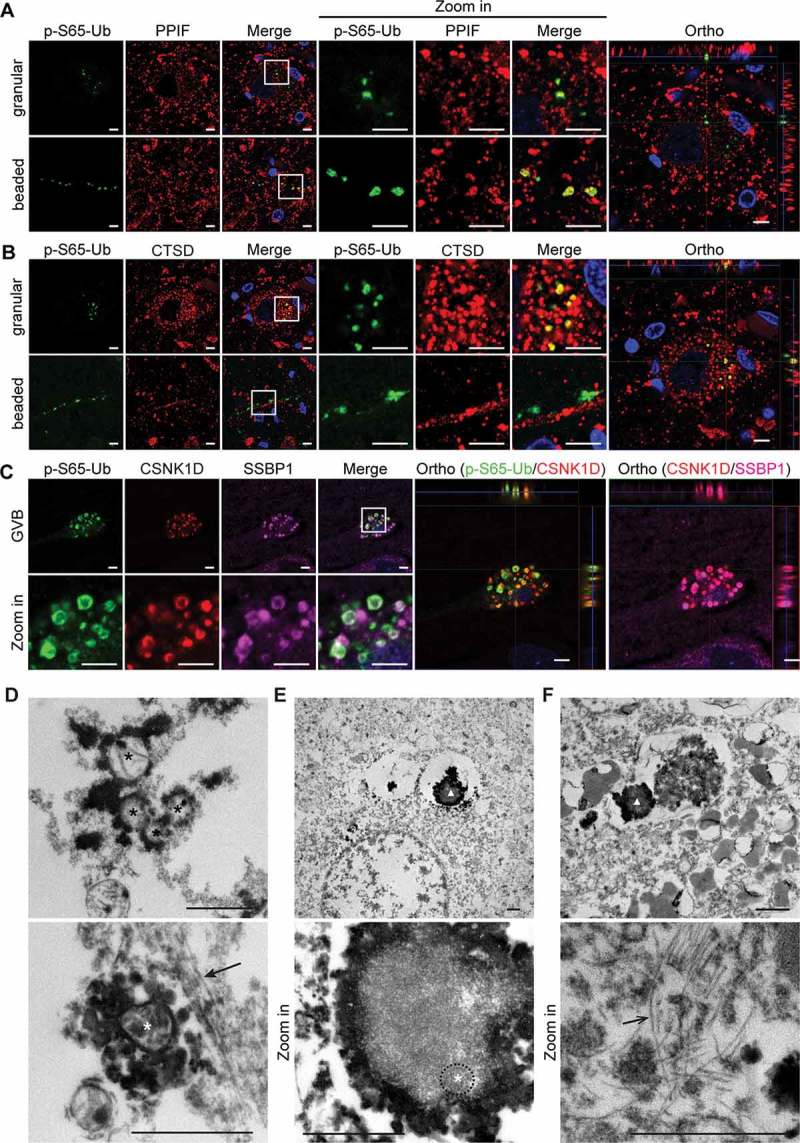
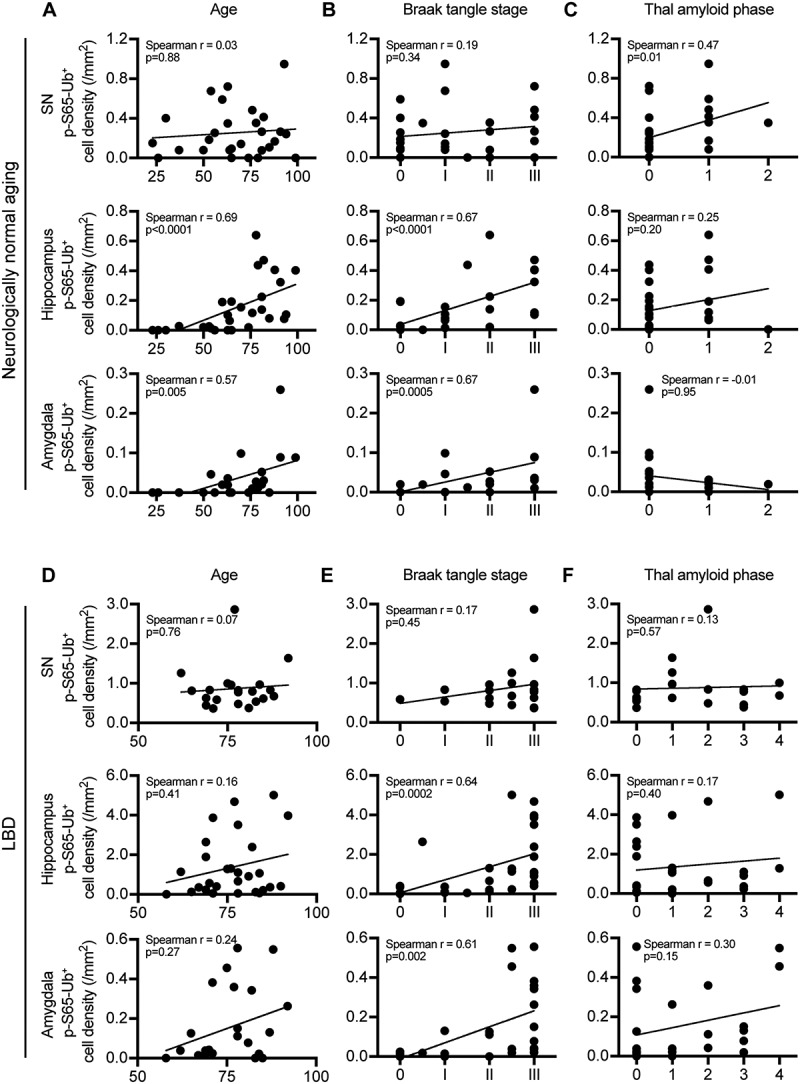
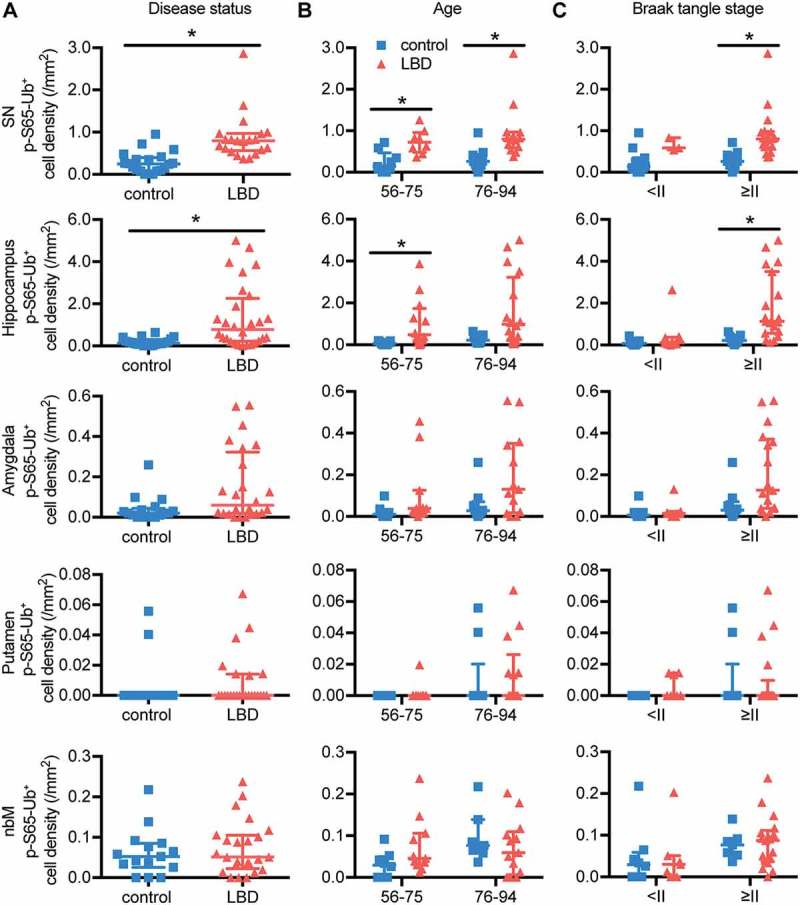
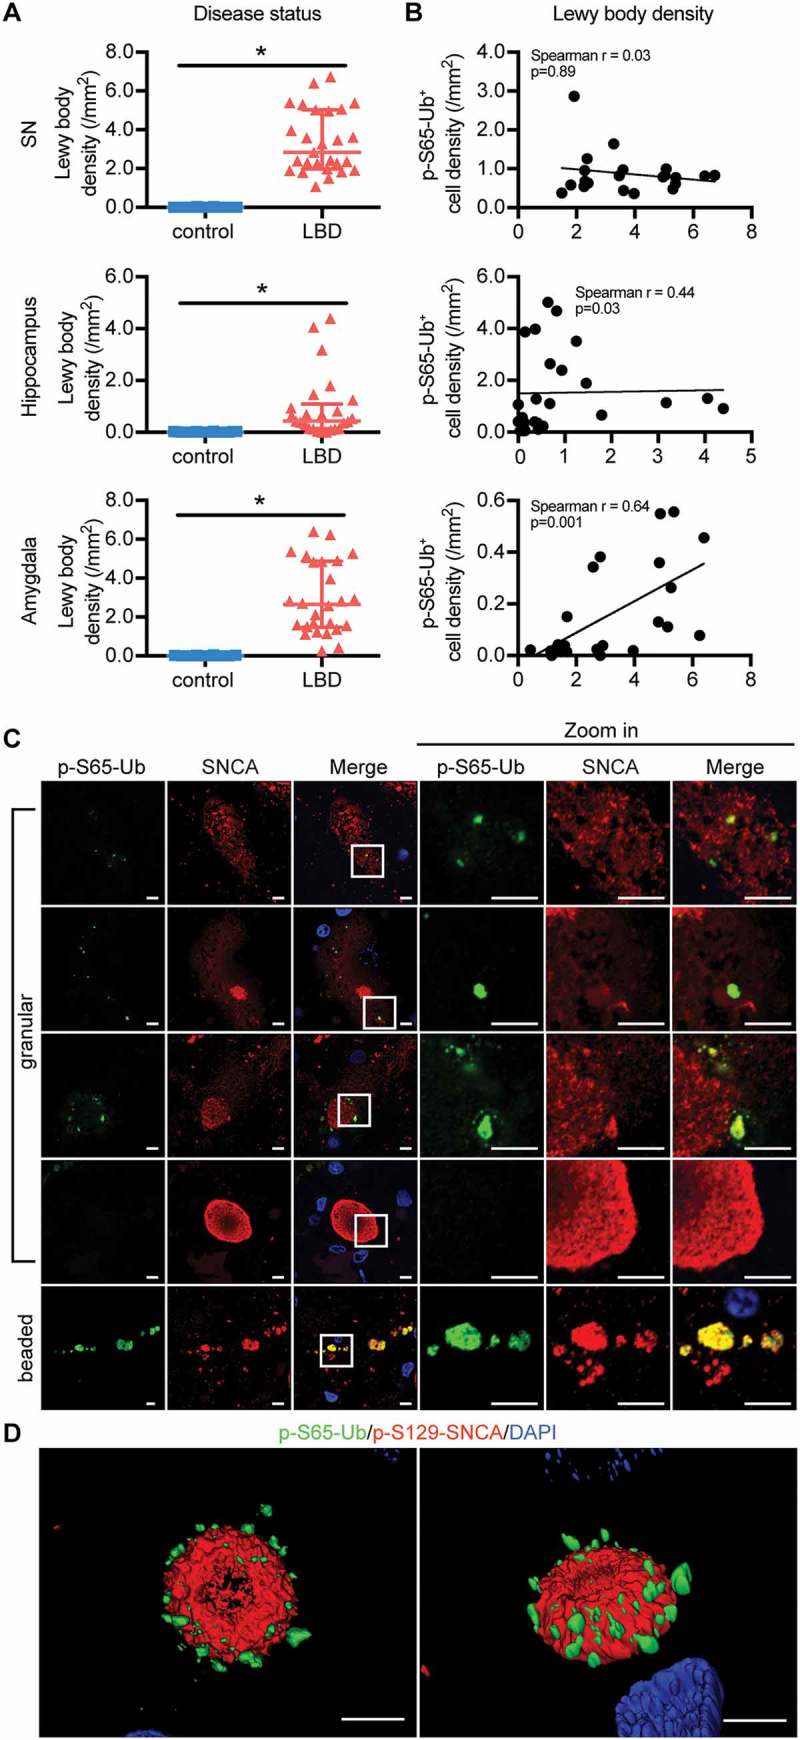
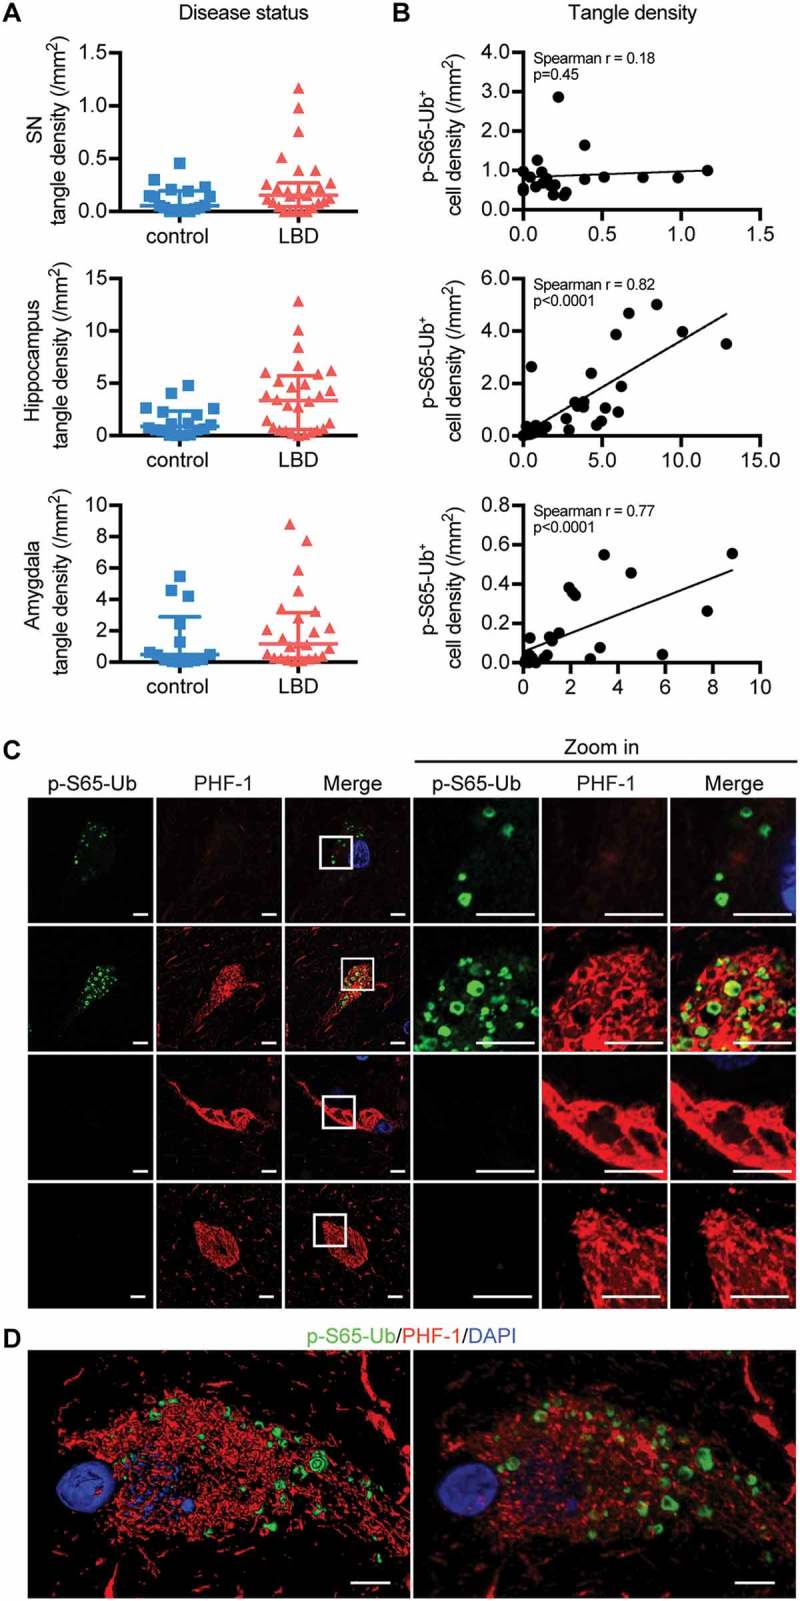
Although exact causes of Parkinson disease (PD) remain enigmatic, mitochondrial dysfunction is increasingly appreciated as a key determinant of dopaminergic neuron susceptibility in both familial and sporadic PD. Two genes associated with recessive, early-onset PD encode the ubiquitin (Ub) kinase PINK1 and the E3 Ub ligase PRKN/PARK2/Parkin, which together orchestrate a protective mitochondrial quality control (mitoQC) pathway. Upon stress, both enzymes cooperatively identify and decorate damaged mitochondria with phosphorylated poly-Ub (p-S65-Ub) chains. This specific label is subsequently recognized by autophagy receptors that further facilitate mitochondrial degradation in lysosomes (mitophagy). Here, we analyzed human post-mortem brain specimens and identified distinct pools of p-S65-Ub-positive structures that partially colocalized with markers of mitochondria, autophagy, lysosomes and/or granulovacuolar degeneration bodies. We further quantified levels and distribution of the 'mitophagy tag' in 2 large cohorts of brain samples from normal aging and Lewy body disease (LBD) cases using unbiased digital pathology. Somatic p-S65-Ub structures independently increased with age and disease in distinct brain regions and enhanced levels in LBD brain were age- and Braak tangle stage-dependent. Additionally, we observed significant correlations of p-S65-Ub with LBs and neurofibrillary tangle levels in disease. The degree of co-existing p-S65-Ub signals and pathological PD hallmarks increased in the pre-mature stage, but decreased in the late stage of LB or tangle aggregation. Altogether, our study provides further evidence for a potential pathogenic overlap among different forms of PD and suggests that p-S65-Ub can serve as a biomarker for mitochondrial damage in aging and disease.

Abbreviations: BLBD: brainstem predominant Lewy body disease; CCCP: carbonyl cyanide m-chlorophenyl hydrazone; DLB: dementia with Lewy bodies; DLBD: diffuse neocortical Lewy body disease; EOPD: early-onset Parkinson disease; GVB: granulovacuolar degeneration body; LB: Lewy body; LBD: Lewy body disease; mitoQC: mitochondrial quality control; nbM: nucleus basalis of Meynert; PD: Parkinson disease; PDD: Parkinson disease with dementia; p-S65-Ub: PINK1-phosphorylated serine 65 ubiquitin; SN: substantia nigra; TLBD: transitional Lewy body disease; Ub: ubiquitin.

Keywords: Aging; MAPT; PARK2; PINK1; SNCA; alpha-synuclein; autophagy; lewy body disease; mitochondria; mitophagy; parkin; parkinson disease; phospho-ubiquitin; tau; ubiquitin.


Figures

Figure 1.
Figure 1.
Morphology and distribution of p-S65-Ub-immunopositive structures. (A) Adjacent sections from LBD brains were stained with different p-S65-Ub antibodies at the indicated concentrations. Representative images of p-S65-Ub-immunopositive structures from various brain regions show the same 3 major patterns: granules (left panels), GVBs (middle panels) and beaded neurites (right panels). (B) Representative images of human brain sections from normal (left) and LBD cases (right) stained with p-S65-Ub antibody are shown. Chromogen used for the SN was HighDef Blue (blue) to distinguish the positive signal from dark brown neuromelanin in DA neurons. Conventional brown 3,3ʹ-diaminobenzidine was used as a chromogen for all other brain regions (hippocampus, amygdala, putamen, and nbM). A magnified image of the boxed area is shown to the right. Scale bars: 20 µm.
Figure 2.
Figure 2.
Reduced or absent p-S65-Ub staining in brains from PRKN or PINK1 mutation carriers. (A) SN sections from controls, sporadic LBD and cases with PINK1 or PRKN mutations were stained with p-S65-Ub antibody. Representative images of stained sections show enhanced p-S65-Ub levels in sporadic PD, but reduced or absent signal in SN of PRKN or PINK1 mutant cases. A magnified image of the boxed area is shown to the right. (B) Quantification of p-S65-Ub signal in age-matched controls, sporadic LBD cases and mutation carriers (Kruskal-Wallis test, *p < 0.01). n = 17 for normal, n = 19 for sporadic PD, n = 7 for PD with PRKN mutation, and n = 2 for PD with PINK1 mutation.
Figure 3.
Figure 3.
High-resolution imaging and ultrastructural examination of human brain tissue immunolabeled with p-S65-Ub. Human brain sections from LBD cases were multicolor labeled with antibodies against p-S65-Ub and (A) PPIF (mitochondrial marker), (B) CTSD (lysosomal marker) or (C) CSNK1D (GVB marker) and SSBP1 (mitochondrial marker). Representative Airyscan confocal images from SN and hippocampus are shown. p-S65-Ub-immunopositive granules partially colocalized with both mitochondrial and lysosomal markers; beaded neurites were co-labeled only with mitochondrial, but not lysosomal markers. GVBs were partially co-labeled with CSNK1D and mitochondrial markers. The colocalization of p-S65-Ub with the respective organelle markers is also demonstrated in the orthogonal (Ortho) view presented to the right. Scale bars: 5 µm. (D) Top: Mitochondria (black asterisks) are intensely labeled with p-S65-Ub on the outer membrane. Bottom: Some mitochondria (white asterisk) were found next to a neurofilament-like structure (solid arrow). (E, F) Top: At lower magnification, structures labeled (triangle) are consistent with GVBs seen at light microscopy. Bottom: At higher magnification, spherical double-membrane structures, possibly mitochondria, are found in the GVBs (white asterisk and circled by dashed line). Some labeled GVBs are adjacent to paired helical filaments (open arrow). Scale bars: 1 µm.
Figure 4.
Figure 4.
p-S65-Ub cell density increases with advanced aging and Braak tangle stage in select brain regions in neurologically normal controls or in LBD. SN, hippocampus and amygdala from neurologically normal controls and LBD cases were stained with p-S65-Ub antibody. Correlations of p-S65-Ub cell density with age at death, Braak tangle stage and Thal amyloid phase was examined within either normal aging (A–C) or LBD cohort (D–F) (Spearman’s test of correlation, significance level: p < 0.01). In controls, n = 28 for SN, n = 28 for hippocampus, n = 22 for amygdala. Putamen and nbM are shown in Figure S4A-C. In LBD, n = 21 for SN, n = 28 for hippocampus, n = 24 for amygdala. Putamen and nbM are shown in Figure S4D-F.
Figure 5.
Figure 5.
LBD brains have significantly higher p-S65-Ub levels compared to age-matched controls in SN and hippocampus. (A) p-S65-Ub-positive cell density from all 5 brain regions was compared between age-matched controls and LBD cases (Wilcoxon rank sum test, *p < 0.01). p-S65-Ub-positive cell density was also compared within (B) different age and (C) Braak tangle stage groups (Wilcoxon rank sum test followed by adjustment with Bonferroni correction, *p < 0.005). In controls, n = 20 for SN, n = 20 for hippocampus, n = 16 for amygdala, n = 16 for putamen, and n = 15 for nbM. In LBD, n = 21 for SN, n = 28 for hippocampus, n = 24 for amygdala, putamen, and nbM. All data are presented in scatter-plots showing the median and interquartile range.
Figure 6.
Figure 6.
Correlation and interaction of p-S65-Ub and SNCA pathology in LBD brains. (A) Lewy body density in SN, hippocampus and amygdala was compared between age-matched normal controls and LBD cases (Wilcoxon rank sum test, *p < 0.01). Data are presented in scatter-plots showing the median and interquartile range. (B) The correlation between p-S65-Ub and Lewy body density in LBD brains was examined, and significant correlations were observed in the amygdala (Spearman’s test of correlation, significance level: p < 0.01). In controls, n = 20 for SN, n = 20 for hippocampus, n = 16 for amygdala. In LBD, n = 21 for SN, n = 28 for hippocampus, n = 24 for amygdala. Putamen and nbM are shown in Figure S7A, B. (C) SN sections of LBD cases were double immunostained with p-S65-Ub and SNCA antibodies. Cells with different stages of SNCA-positive aggregations are shown. A magnified image of the boxed area is shown to the right. p-S65-Ub (green) colocalizes with SNCA (red) more in beaded neurites than in granules in soma. p-S65-Ub levels appear to decline with maturation of SNCA into LBs. For double labeling with p-S129-SNCA, see Figure S7C. (D) The spatial relationship of p-S65-Ub- and p-S129-SNCA-positive LB is shown in 3D surface rendering. Scale bars: 5 µm.
Figure 7.
Figure 7.
Correlation and interaction of p-S65-Ub and MAPT pathology in LBD brains. (A) tangle density in SN, hippocampus and amygdala is compared between age-matched normal controls and LBD cases (Wilcoxon rank sum test, *p < 0.01). Data are presented in scatter-plots with the median and interquartile range. (B) The correlation of p-S65-Ub with tangle density was examined in LBD, and significant correlations were observed in the hippocampus and amygdala (Spearman’s test of correlation, significance level: p < 0.01). In controls, n = 20 for SN, n = 20 for hippocampus, n = 16 for amygdala. In LBD, n = 21 for SN, n = 28 for hippocampus, n = 24 for amygdala. Putamen and nbM are shown in Figure S8A, B. (C) Hippocampal sections of LBD cases were double stained with p-S65-Ub and p-MAPT antibodies. A magnified image of the boxed area is shown to the right. Intracellular p-S65-Ub GVBs (green) are embedded in the p-MAPT network (red) labeled by late stage p-MAPT marker (PHF-1). For early stage p-MAPT marker CP13, see Figure S8C, D. p-S65-Ub levels appear to increase with maturation of tangles, but disappear in late-stage tangles. (D) The spatial relationship of p-S65-Ub and PHF-1 is shown in 3D surface (left) and maximum (right) rendering. Scale bars: 5 µm.

Similar articles

Cited by

References

    1. Lees AJ, Hardy J, Revesz T.. Parkinson’s disease. Lancet. 2009;373(9680):2055–2066. - PubMed
    1. Van Den Eeden SK, Tanner CM, Bernstein AL, et al. Incidence of Parkinson’s disease: variation by age, gender, and race/ethnicity. Am J Epidemiol. 2003;157(11):1015–1022. - PubMed
    1. Langston JW. The Parkinson’s complex: parkinsonism is just the tip of the iceberg. Ann Neurol. 2006;59(4):591–596. - PubMed
    1. Gibb WR, Lees AJ. Anatomy, pigmentation, ventral and dorsal subpopulations of the substantia nigra, and differential cell death in Parkinson’s disease. J Neurol Neurosurg Psychiatry. 1991;54(5):388–396. - PMC - PubMed
    1. Dickson DW, Braak H, Duda JE, et al. Neuropathological assessment of Parkinson’s disease: refining the diagnostic criteria. Lancet Neurol. 2009;8(12):1150–1157. - PubMed

Publication types

MeSH terms