. 2018 Sep 19;46(16):8275-8298.
doi: 10.1093/nar/gky548.

Efficient CRISPR/Cas9-mediated editing of trinucleotide repeat expansion in myotonic dystrophy patient-derived iPS and myogenic cells

Affiliations

Efficient CRISPR/Cas9-mediated editing of trinucleotide repeat expansion in myotonic dystrophy patient-derived iPS and myogenic cells

Sumitava Dastidar et al. Nucleic Acids Res. .

Abstract

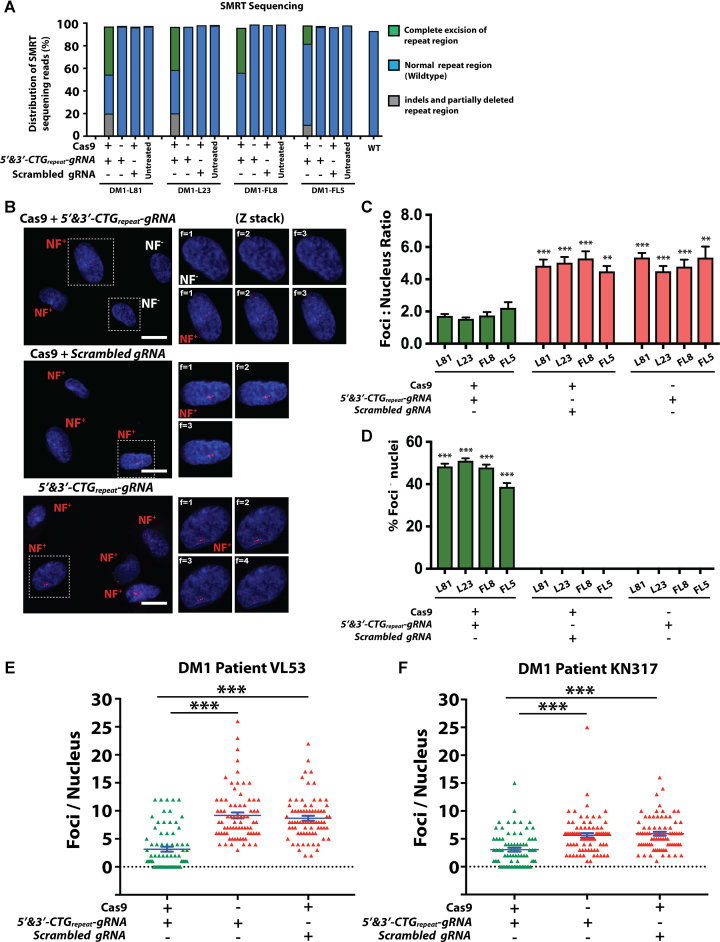
CRISPR/Cas9 is an attractive platform to potentially correct dominant genetic diseases by gene editing with unprecedented precision. In the current proof-of-principle study, we explored the use of CRISPR/Cas9 for gene-editing in myotonic dystrophy type-1 (DM1), an autosomal-dominant muscle disorder, by excising the CTG-repeat expansion in the 3'-untranslated-region (UTR) of the human myotonic dystrophy protein kinase (DMPK) gene in DM1 patient-specific induced pluripotent stem cells (DM1-iPSC), DM1-iPSC-derived myogenic cells and DM1 patient-specific myoblasts. To eliminate the pathogenic gain-of-function mutant DMPK transcript, we designed a dual guide RNA based strategy that excises the CTG-repeat expansion with high efficiency, as confirmed by Southern blot and single molecule real-time (SMRT) sequencing. Correction efficiencies up to 90% could be attained in DM1-iPSC as confirmed at the clonal level, following ribonucleoprotein (RNP) transfection of CRISPR/Cas9 components without the need for selective enrichment. Expanded CTG repeat excision resulted in the disappearance of ribonuclear foci, a quintessential cellular phenotype of DM1, in the corrected DM1-iPSC, DM1-iPSC-derived myogenic cells and DM1 myoblasts. Consequently, the normal intracellular localization of the muscleblind-like splicing regulator 1 (MBNL1) was restored, resulting in the normalization of splicing pattern of SERCA1. This study validates the use of CRISPR/Cas9 for gene editing of repeat expansions.


Figures

Figure 1.
Figure 1.
Generation of DM1-iPS cells (DM1-iPSCs) and DM1-iPSC derived inducible myogenic cells (DM1-iPSC-Myo). (A) Schematic overview showing CRISPR/Cas9 based correction of DM1 patient iPSCs derived myogenic cells (DM1-iPSC-Myo). (B) Representative image of DM1-iPSC clones and healthy control iPSCs stained for RNA foci by fluorescent in situ hybridization (FISH). An antisense Cy3-labeled probe was used against trinucleotide CUG expanded repeat. Arrowheads indicated ribonuclear foci. Upper panel represents stained nuclei at lower magnification (scale bar = 20μm) and lower panel represents higher magnification of selected region (scale bar = 2μm). Nuclei were counter-stained with DAPI. (C) Southern blot analysis to detect the length of trinucleotide CTG repeats in five DM1-iPSC clones from two DM1 patients (L22, L81 and L23; FL8 and FL5) and healthy control iPSCs. EcoRI digested genomic DNA was subjected to agarose gel electrophoresis and probed to detect the DMPK locus. (mut = mutant; wt = wild type). (D) Representative image of FISH staining on DM1-iPSC-Myo for detection of ribonuclear foci. Arrowheads indicate multiple RNA foci in nuclei of DM1-iPSC-Myo. Healthy iPSC-Myo were used as a negative control. Upper panel represents stained nuclei at lower magnification (scale bar = 20 μm) and lower panel represents higher magnification of selected region (scale bar = 2 μm). Nuclei were counter-stained with DAPI. (E) Myogenic conversion of DM1-iPSC-Myo (L81 and L23) and healthy iPSC-Myo post MyoD induction were stained for a mature muscle marker, myosin heavy chain (MyHC) (scale bar = 100 μm). Nuclei were counter-stained with DAPI. (F) Southern blot analysis of trinucleotide CTG repeats length in DM1-iPSC-Myo (L81 and L23; FL8 and FL5) and healthy-iPSC-Myo to check the length of triplet repeats post-differentiation (mut = mutant; wt = wild type).
Figure 2.
Figure 2.
A dual gRNA approach for CRISPR/Cas9-mediated correction of DM1-iPSC Myo and evidence for trinucleotide CTG repeat excision. (A) Diagrammatic representation for targeting of the 3 ‘UTR region of the DMPK gene using a dual gRNA approach for CRISPR/Cas9-mediated gene correction. The dual gRNAs (5′& 3′-CTGrepeat-gRNA) target Cas9 on either side of the CTG repeat region for excision of the expanded trinucleotide repeat. (B) Cas9 immunofluorescence staining of CRISPR/Cas9 treated DM1-iPSC-Myo cells, at 1-week post transduction. The upper panel shows representative images of DM1-iPSC-Myo cells stained for Cas9 (in red) and co-stained with DAPI for nuclei (in blue) (scale bar = 50 μm). The lower panel shows the graph for the quantitation of microscopy data for Cas9 positive cells. (C) Representative electropherograms of Triplet Repeat Primed PCR (TP) products from DM1-iPSC-Myo after CRISPR/Cas9-mediated gene editing from three independent experiments for each of the three treatments (Cas9 and 5′ & 3′-CTGrepeat-gRNA; Cas9 and scrambled gRNA; 5′-CTGrepeat-gRNA, 3′-CTGrepeat-gRNA and no Cas9) and untreated control conditions (WT-iPSC-Myo and DM1-iPSC-Myo). (D) Sanger sequencing results of on-target activity. The DMPK target locus was amplified by primers flanking the 2 SNPs [C>T; G>A: mutant > wild-type allele] and the CTG repeat region [(CTG)∼1371 /(CTG)5]. The SNPs allowed discrimination of mutant (C&G) and wild-type alleles (T&A). Analysis of CRISPR/Cas9 activity on the targeted mutant allele showed a large deletion [(–) ∼4188 bp] between the 5′-CTGrepeat-gRNA and 3′-CTGrepeat-gRNA target sites. CRISPR/Cas9 activity on wild type allele was also detected by deletions between the corresponding gRNA target sites. Representative sequences of the wild-type allele with commonly found deletions and insertions are depicted in the figure. SNPs marked in red are seen in the mutant allele and those in blue are present in the wild type allele. Insertions are indicated by (+) and deletions are indicated by (–). Small letters represent the inserted nucleotides.
Figure 3.
Figure 3.
Analysis of target region in the CRISPR/Cas9-corrected DM1-iPSC-Myo and ribonuclear foci staining of corrected DM1-iPSC-Myo and DM1 primary myoblasts. (A) Graph representing distribution of SMRT sequencing reads based on the various amplicon sizes ∼633 bp (excised fragments) and ∼723bp (WT fragments). The sequences ranging between ∼723 bp and ∼4000 bp were fragments with indels and partially deleted repeat regions. Each bar represents distribution of reads from each of the three conditions (Cas9 + 5′ & 3′-CTGrepeat-gRNA, Cas9 control and gRNA control) and untreated DM1-iPSC-Myo control. (B) Representative image of CRISPR/Cas9-corrected DM1-iPSC-Myo (L81) stained for ribonuclear foci. Cas9 and scrambled gRNA; 5′-CTGrepeat-gRNA, 3′-CTGrepeat-gRNA and no Cas9 were used as negative controls. An antisense Cy3-labeled probe was used to detect the presence of ribonuclear foci (NF). The ribonuclear foci negative and positive nuclei were denoted as NF (white) and NF+ (red), respectively. Each representative image is a maximum intensity z projection of the z slice images. For all the conditions (Cas9 + 3′ & 5′-CTGrepeat-gRNA, scrambled gRNA and no Cas9) enlarged z slices of selected ribonuclear foci negative (NF-) and positive (NF+) nucleus are represented. Nuclei were counter-stained with DAPI (scale bar = 20 μm). (C) Quantification of ribonuclear foci (NF) in CRISPR/Cas9-corrected DM1-iPSC Myo. The total number of ribonuclear foci per total number of nuclei was calculated. Total of nuclei counted is 6500. The data is represented as mean ± SEM. The statistics were performed using two-tailed unpaired Student's t-test (***P <0.001; **P < 0.01; *P < 0.05). (D) Graph shows the % of ribonuclear foci-negative nuclei in the CRISPR/Cas9-corrected DM1-iPSC-Myo to determine the overall efficiency of CRISPR/Cas9 correction. A total number of 4915 nuclei were examined by FISH staining. The data is represented as mean ± SEM. The statistics were performed using one-way ANOVA (***P <0.001; **P < 0.01; *P < 0.05). The quantitation was done in a blinded fashion. (E and F) Graphs showing quantification of ribonuclear foci (NF) in CRISPR/Cas9 corrected DM1 primary myoblasts from two DM1 patients (VL53 and KN317). The foci per nucleus was calculated and represented by each data point in the graph. The data is represented as mean ± SEM. The statistics were performed using two-tailed unpaired Student's t-test (***P <0.001; **P < 0.01; *P < 0.05).
Figure 4.
Figure 4.
Biological effects of CRSIPR/Cas9 mediated correction of DM1-iPSC-Myo. (A) Dual staining for MBNL1 and ribonuclear foci co-localization in the CRSIPR/Cas9-corrected versus control conditions (Cas9 and scrambled gRNA; 5′-CTGrepeat-gRNA, 3′-CTGrepeat-gRNA and no Cas9). Representative image of DM1-iPSC-Myo stained for MBNL1 and Ribonuclear foci by combined immunostaining-FISH staining. Each representative image is a maximum intensity z projection of the z slices. For control conditions, enlarged image of selected nuclei are represented under different filters. For the condition (Cas9 + 3′& 5′-CTGrepeat-gRNA) enlarged z slices of selected ribonuclear foci negative (NF-) and positive (NF+) nucleus are represented under different filters. Nuclei were counterstained with DAPI. (B) Quantification of the microscopy data is represented in term of ratio between the total dual positive (MBNL1+RNA+ foci)/total number of nuclei observed in each condition for the L23, L81, FL8 and FL5 DM1-iPSC-Myo cells. The data is represented as mean ± SEM. The statistics were performed using two-tailed unpaired Student's t-test (***P <0.001; **P < 0.01; *P < 0.05). (C and D) Reversal of defective alternative splicing pattern of SERCA in CRISPR/Cas9-corrected DM1-iPSC- derived muscle cells (myocytes/myotubes). Muscle cells obtained from Cas9 and 5′& 3′-CTGrepeat-gRNA treated DM1-iPSC-Myo was analyzed for alternative splicing with primers specific to exon 21 and exon 23. The fraction of splice variants either including or excluding exon 22 was quantified based on the band intensity and then plotted. Healthy control sample (WT), scrambled gRNA and no Cas9 conditions were used as controls. GAPDH was used for normalization. The data is represented as mean ± SEM. The statistics were performed using two-tailed unpaired Student's t-test (***P <0.001; **P < 0.01; *P < 0.05).
Figure 5.
Figure 5.
Analysis of CRISPR/Cas9 corrected DM1-iPSCs and isolated DM1-iPSC clones by Southern blot assay, target region sequencing, TP-PCR and ribonuclear foci staining. (A) Quantification of ribonuclear foci (NF) in CRISPR/Cas9-corrected DM1-iPSCs. The total number of ribonuclear foci per total number of nuclei was calculated. Total of nuclei counted is 1500. The data is represented as mean ± SEM. The statistics were performed using two-tailed unpaired Student's t-test (***P <0.001; **P < 0.01; *P < 0.05). (B) Graph shows the % of ribonuclear foci-negative nuclei in the CRISPR/Cas9-corrected DM1-iPSCs to determine the overall efficiency of CRISPR/Cas9 correction. A total number of 1500 nuclei were examined by FISH staining. The data is represented as mean ± SEM. The statistics were performed using one-way ANOVA (***P <0.001; **P < 0.01; *P < 0.05). (C) Southern blot analysis to detect the presence of expanded trinucleotide CTG repeat region in 23 DM1-iPSC clones isolated from four DM1-iPSC lines derived from two DM1 patients (L81 and L23; FL8 and FL5) and healthy control iPSCs. EcoRI digested genomic DNA was subjected to agarose gel electrophoresis and probed to detect the DMPK locus. (mut = mutant; wt = wild type). (D) Representative sequences obtained from sanger sequencing of target locus in each of the four selected DM1-iPSC clones (L23: C03, L81:C10, FL8:C09 and FL5:C12). For ease of alignment we have placed a reference sequence with 5′ and 3′-CTGrepeat-gRNA target sites (green and blue) and protospacer adjacent motif (PAM) region (red) highlighted. In the sequence alignment deleted region has been marked with (–) and insertions highlighted in lowercase. (E) Representative electropherograms of Triplet Repeat Primed PCR (TP) products from DM1-iPSC clones (corrected clone: L23 C03; non-corrected clone: L23 C32) isolated after CRISPR/Cas9-mediated gene editing. (F) Representative images of a corrected (L23 C03) and non-corrected (L23 C32) DM1-iPSC clone stained for ribonuclear foci. An antisense Cy3-labeled probe was used to detect the presence of ribonuclear foci (NF). The ribonuclear foci negative and positive nuclei were denoted as NF (white) and NF+ (red), respectively. Nuclei were counter-stained with DAPI (scale bar = 20 μm). Each representative image is a maximum intensity z projection of the z slices. For both clones enlarged z slices of selected ribonuclear foci negative (NF–) or positive (NF+) nucleus are represented.

Similar articles

Cited by

References

    1. Udd B., Krahe R.. The myotonic dystrophies: molecular, clinical, and therapeutic challenges. Lancet Neurol. 2012; 11:891–905. - PubMed
    1. Theadom A., Rodrigues M., Roxburgh R., Balalla S., Higgins C., Bhattacharjee R., Jones K., Krishnamurthi R., Feigin V.. Prevalence of muscular dystrophies: a systematic literature review. Neuroepidemiology. 2014; 43:259–268. - PubMed
    1. Fu Y.H., Pizzuti A., Fenwick R.G. Jr., King J., Rajnarayan S., Dunne P.W., Dubel J., Nasser G.A., Ashizawa T., de Jong P. et al. . An unstable triplet repeat in a gene related to myotonic muscular dystrophy. Science. 1992; 255:1256–1258. - PubMed
    1. Mahadevan M., Tsilfidis C., Sabourin L., Shutler G., Amemiya C., Jansen G., Neville C., Narang M., Barcelo J., O’Hoy K. et al. . Myotonic dystrophy mutation: an unstable CTG repeat in the 3′ untranslated region of the gene. Science. 1992; 255:1253–1255. - PubMed
    1. Savic Pavicevic D., Miladinovic J., Brkusanin M., Svikovic S., Djurica S., Brajuskovic G., Romac S.. Molecular genetics and genetic testing in myotonic dystrophy type 1. Biomed. Res. Int. 2013; 2013:391821. - PMC - PubMed

Publication types