. 2018 Aug;92(8):2649-2664.
doi: 10.1007/s00204-018-2234-8. Epub 2018 Jun 9.

The HDAC6/8/10 inhibitor TH34 induces DNA damage-mediated cell death in human high-grade neuroblastoma cell lines

Affiliations

The HDAC6/8/10 inhibitor TH34 induces DNA damage-mediated cell death in human high-grade neuroblastoma cell lines

Fiona R Kolbinger et al. Arch Toxicol. 2018 Aug.

Abstract

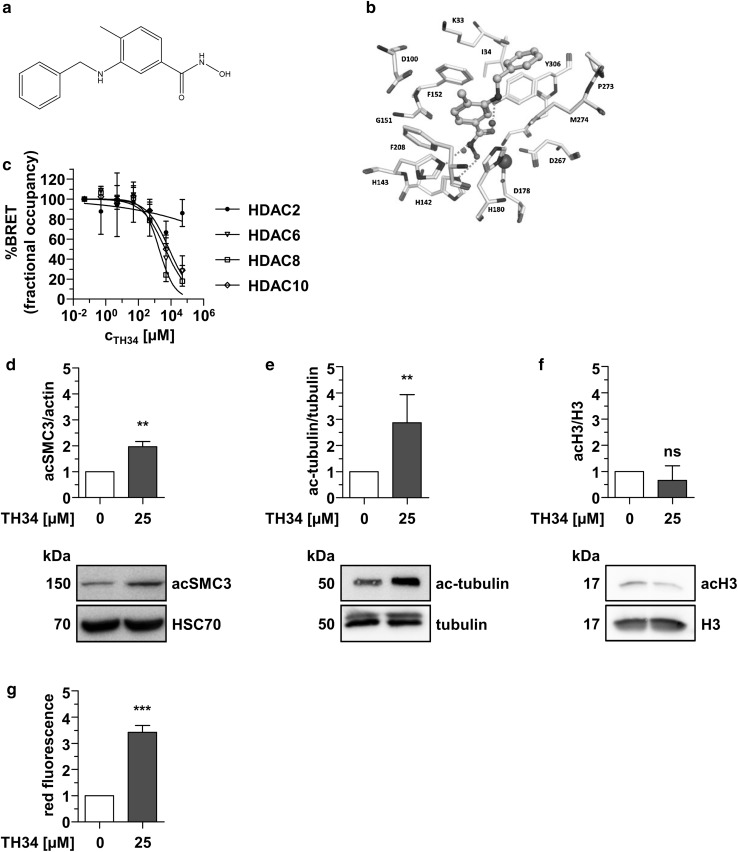
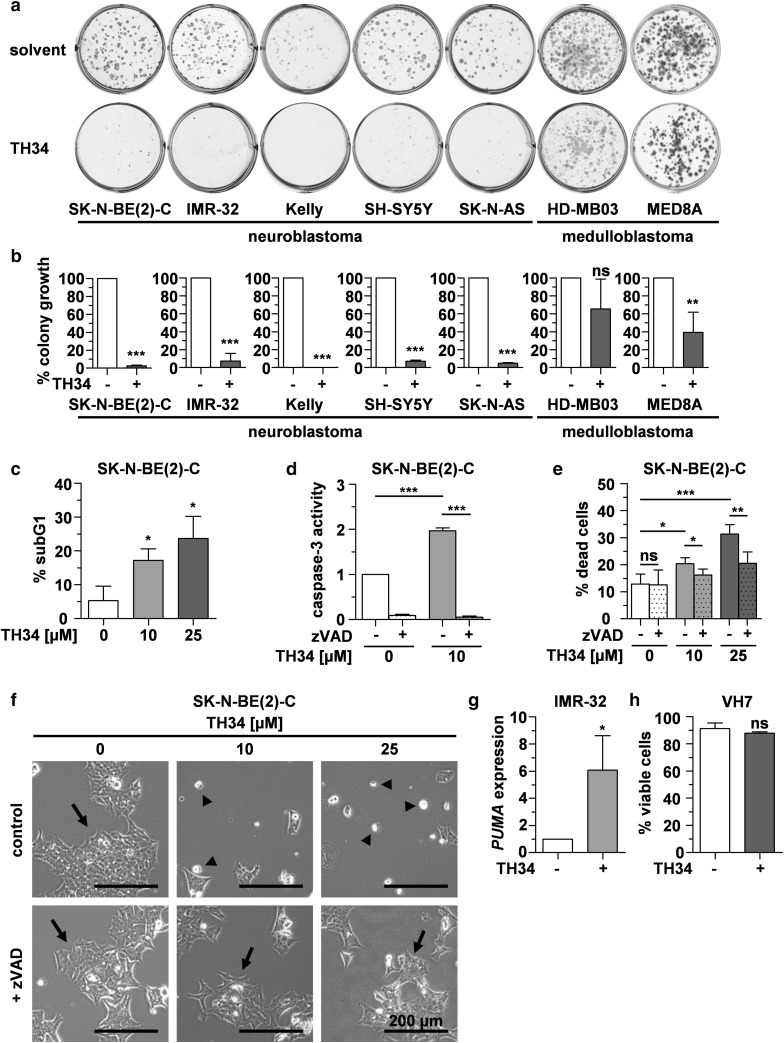
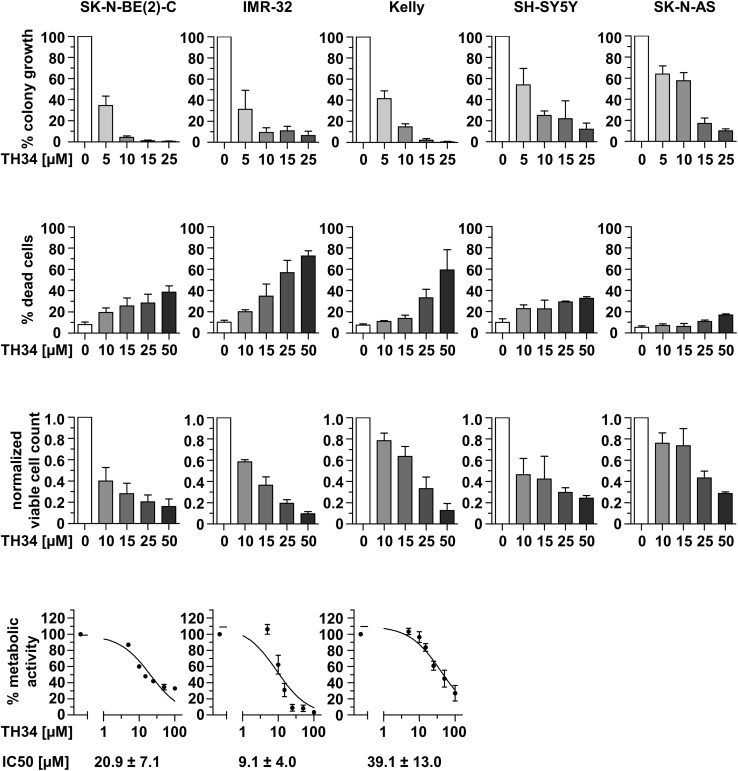
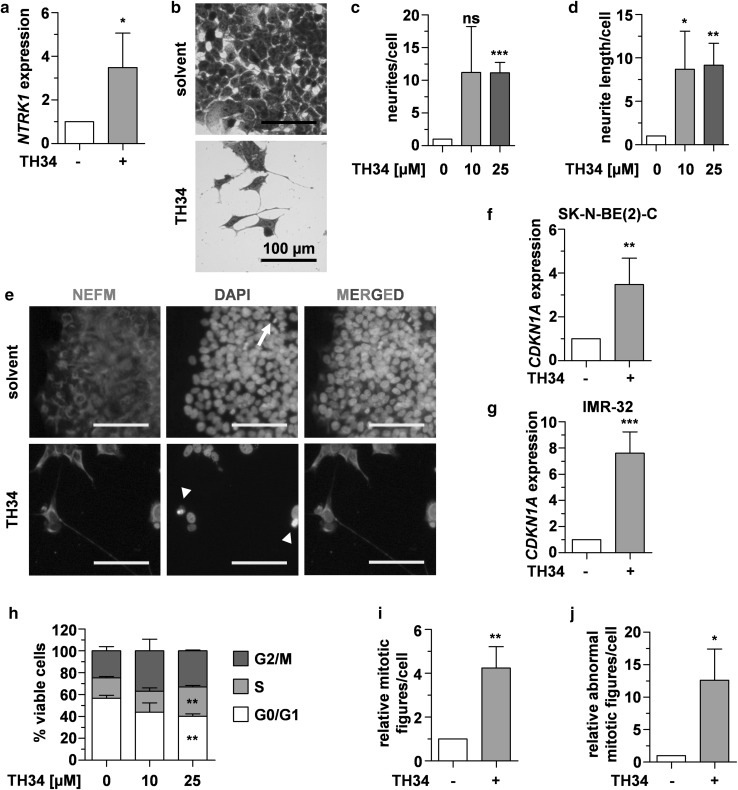
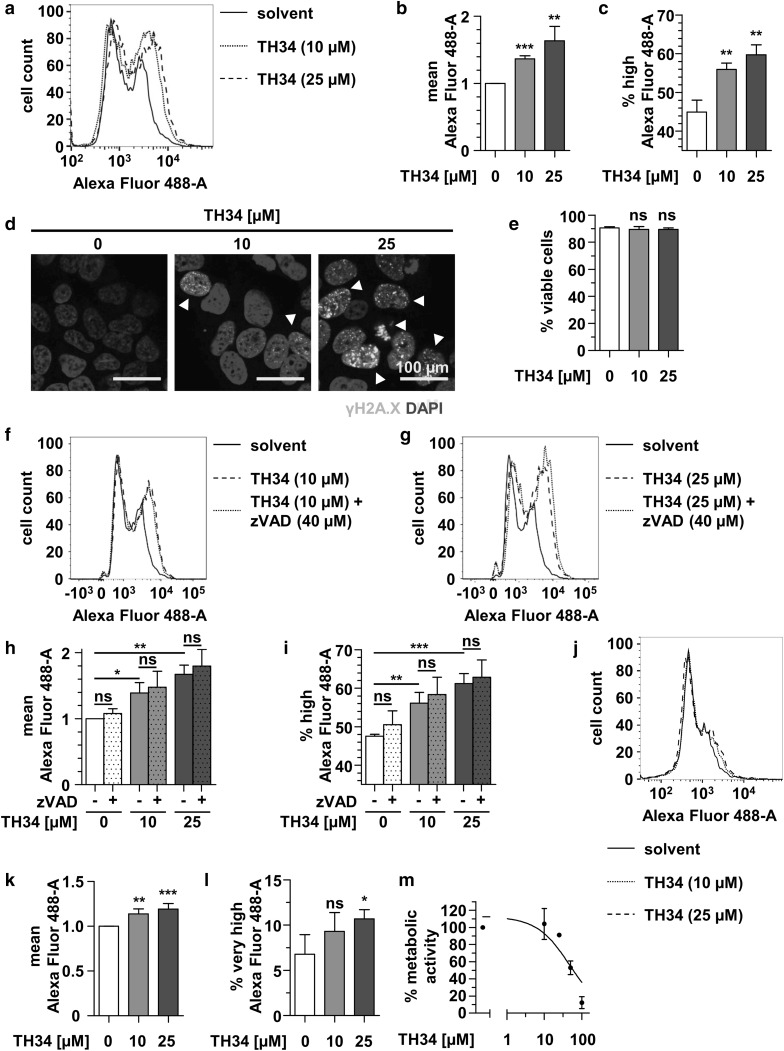
High histone deacetylase (HDAC) 8 and HDAC10 expression levels have been identified as predictors of exceptionally poor outcomes in neuroblastoma, the most common extracranial solid tumor in childhood. HDAC8 inhibition synergizes with retinoic acid treatment to induce neuroblast maturation in vitro and to inhibit neuroblastoma xenograft growth in vivo. HDAC10 inhibition increases intracellular accumulation of chemotherapeutics through interference with lysosomal homeostasis, ultimately leading to cell death in cultured neuroblastoma cells. So far, no HDAC inhibitor covering HDAC8 and HDAC10 at micromolar concentrations without inhibiting HDACs 1, 2 and 3 has been described. Here, we introduce TH34 (3-(N-benzylamino)-4-methylbenzhydroxamic acid), a novel HDAC6/8/10 inhibitor for neuroblastoma therapy. TH34 is well-tolerated by non-transformed human skin fibroblasts at concentrations up to 25 µM and modestly impairs colony growth in medulloblastoma cell lines, but specifically induces caspase-dependent programmed cell death in a concentration-dependent manner in several human neuroblastoma cell lines. In addition to the induction of DNA double-strand breaks, HDAC6/8/10 inhibition also leads to mitotic aberrations and cell-cycle arrest. Neuroblastoma cells display elevated levels of neuronal differentiation markers, mirrored by formation of neurite-like outgrowths under maintained TH34 treatment. Eventually, after long-term treatment, all neuroblastoma cells undergo cell death. The combination of TH34 with plasma-achievable concentrations of retinoic acid, a drug applied in neuroblastoma therapy, synergistically inhibits colony growth (combination index (CI) < 0.1 for 10 µM of each). In summary, our study supports using selective HDAC inhibitors as targeted antineoplastic agents and underlines the therapeutic potential of selective HDAC6/8/10 inhibition in high-grade neuroblastoma.

Keywords: DNA repair; Differentiation; HDAC10; HDAC8; Selective histone deacetylase inhibitor; Targeted therapy.


Conflict of interest statement

The authors declare no conflicts of interest.

Figures

Fig. 1
Fig. 1
TH34 inhibits HDACs 6, 8 and 10. a TH34 molecular structure. b Docking pose of TH34 (middle, cyan color) at HDAC8. c NanoBRET analysis of HDAC2/6/8/10 interaction with TH34 in HeLa cells. The number of biological replicates is n = 3 for HDAC6 and HDAC10 and n = 2 for HDAC2 and HDAC8 and the number of technical replicates is n = 3 for every independent run. Graph represents mean amounts of acceptor-occupied NanoLuc-HDAC2/6/8/10 relative to the total amount of NanoLuc-HDAC2/6/8/10 (% fractional occupancy, y-axis) versus logarithmic drug concentration (x-axis). Western Blot analysis of SMC3 (d), tubulin (e) and histone 3 acetylation (f) in SK-N-BE(2)-C cells after 6 h of treatment with TH34 (25 µM) or solvent. g Flow-cytometric quantification of acridine orange-positive acidic vesicular organelles in SK-N-BE(2)-C neuroblastoma cells after 24 h of treatment. Bar graphs represent mean values of at least three independent experiments performed in triplicates and statistical analysis was performed using unpaired, two-tailed t test (***p < 0.001; **0.001 ≤  p < 0.01; *0.01 ≤  p < 0.05, ns not significant). Error bars represent SD
Fig. 2
Fig. 2
TH34 induces caspase-dependent programmed cell death in neuroblastoma cells. a, b Colony growth after treatment with TH34 (25 µM) or solvent. Representative images and quantification of colony growth in at least three independent experiments performed in triplicates are shown for each cell line. c Fraction of cells in subG1 cell cycle phase after treatment with indicated concentrations of TH34 for 72 h, identified via flow-cytometric quantification of DNA content using propidium iodide. d Caspase-3 activity after treatment of SK-N-BE(2)-C cells with indicated concentrations of TH34 for 48 h with or without Z-VAD-FMK (20 µM). e Proportion of dead SK-N-BE(2)-C cells after treatment with different concentrations of TH34 for 72 h with or without Z-VAD-FMK (20 µM), determined via automated trypan blue staining. f Representative images of SK-N-BE(2)-C neuroblastoma cells treated with solvent or TH34 (25 µM) with or without Z-VAD-FMK (20 µM) for 72 h. g Relative expression (determined using the 2−ΔΔCt method and normalized to solvent control) of PUMA in IMR-32 cells after 24 h of treatment with TH34 (10 µM). (h) VH7 non-malignant fibroblast viability after treatment with solvent or TH34 (25 µM) for 72 h. Bar graphs represent mean values of at least three independent experiments performed in triplicates and statistical analysis was performed using unpaired, two-tailed t test (***p < 0.001; **0.001 ≤  p < 0.01; *0.01 ≤  p < 0.05, ns not significant). Error bars represent SD
Fig. 3
Fig. 3
TH34 differentially impairs colony formation and cell survival in neuroblastoma cell lines with distinct molecular features. Relative colony formation, proportion of dead cells and viable cell count (both determined via trypan blue exclusion assay) as well as metabolic activity (CellTiter-Glo) in five different neuroblastoma cell lines (SK-N-BE(2)-C, IMR-32, Kelly, SH-SY5Y and SK-N-AS) after treatment with indicated concentrations of TH34. Bar graphs represent mean values of at least two independent experiments performed in triplicates each and error bars represent SD
Fig. 4
Fig. 4
TH34 induces differentiation and cell cycle arrest in neuroblastoma cells. a Relative expression (determined using the 2−ΔΔCt method and normalized to solvent control) of NTRK1 in SK-N-BE(2)-C neuroblastoma cells after 72 h of treatment with TH34 (10 µM). b Representative microscopic images of crystal violet-stained SK-N-BE(2)-C cells treated with TH34 (10 µM) for 6 days. cd Relative number and length of neurites in SK-N-BE(2)-C cells after 6 days of treatment with indicated concentrations of TH34, quantified using a semi-automated macro determining surface of cell bodies as well as number and length of neurites in ten fields of vision in ImageJ version 1.49v and normalized to solvent control. e Fluorescence microscopic analysis of neurofilament M expression in SK-N-BE(2)-C cells treated with TH34 (10 µM) for 6 days. Nuclei were counterstained with DAPI, arrows and arrowheads indicate normal mitotic and aberrant mitotic nuclei, respectively. Relative expression (determined using the 2− ΔΔCt method and normalized to solvent control) of CDKN1A in SK-N-BE(2)-C (f) and IMR-32 (g) neuroblastoma cells after 72 h of treatment with TH34 (10 µM). h Cell cycle distribution of viable SK-N-BE(2)-C cells in G0/G1 (white), S (light gray) and G2/M (dark gray) phase after 72 h of treatment with indicated concentrations of TH34. i, j Total and aberrant mitotic nuclei in SK-N-BE(2)-C neuroblastoma cells after 6 days of treatment with TH34 (10 µM). In ten fields of vision, all DAPI-stained nuclei and mitotic figures were counted using the Cell Counter Plugin for ImageJ version 1.49v and numbers obtained in treated samples were set in relation to solvent control. Bar graphs represent mean values of at least three independent experiments and statistical analysis was performed using unpaired, two-tailed t test (***p < 0.001; **0.001 ≤ p < 0.01; *0.01 ≤ p < 0.05, ns not significant). Error bars represent SD
Fig. 5
Fig. 5
TH34 induces DNA damage in high-grade neuroblastoma cells. a Flow cytometric analysis of H2AX S134 phosphorylation (γH2AX) in fixed, viable SK-N-BE(2)-C cells after 24 h of treatment with indicated concentrations of TH34. Figure shows histogram of logarithmic fluorescence (x-axis) versus event number (y-axis) and gate represents γH2AX-positive cells. Mean Alexa Fluor 488 fluorescence (b) and proportion of γH2AX-positive cells (c) after treatment of SK-N-BE(2)-C cells with different concentrations of TH34 for 24 h. d Immunofluorescence analysis of γH2AX staining on fixed SK-N-BE(2)-C cells after 24 h of treatment with indicated concentrations of TH34. Nuclei were counterstained with DAPI, and arrowheads indicate nuclei with high number of DNA double-strand breaks. e Proportion of dead SK-N-BE(2)-C cells after treatment with different concentrations of TH34 for 24 h, determined via automated trypan blue staining. f, g Flow cytometric analysis of H2AX S134 phosphorylation (γH2AX) in fixed viable SK-N-BE(2)-C cells after 1 h of pre-treatment with Z-VAD-FMK (40 µM) alone and 24 h of additional treatment with TH34 at a concentration of 10 µM (f) or 25 µM (g). Figure shows histogram of logarithmic fluorescence (x-axis) versus event number (y-axis) and gate represents γH2AX--positive cells. Mean Alexa Fluor 488 fluorescence (h) and proportion of γH2AX-positive cells (i) after 1 h of Z-VAD-FMK (40 µM) pre-treatment of SK-N-BE(2)-C cells and additional treatment with different concentrations of TH34 for 24 h. j Flow cytometric analysis of H2AX S134 phosphorylation (γH2AX) in fixed viable NB8 primary neuroblastoma cells after 24 h of treatment with indicated concentrations of TH34. Figure shows histogram of logarithmic fluorescence (x-axis) versus event number (y-axis) and gate represents γH2AX-positive cells. Mean Alexa Fluor 488 fluorescence (k) and proportion of γH2AX highly positive cells (l) after treatment of NB8 primary neuroblastoma cells with different concentrations of TH34 for 24 h. (m) Cellular metabolic activity (CellTiter-Glo) of NB8 primary neuroblastoma cells after treatment with indicated concentrations of TH34 for 72 h. Bar graphs represent mean values of at least three independent experiments and statistical analysis was performed using unpaired, two-tailed t test (***p < 0.001; **0.001 ≤ p < 0.01; *0.01 ≤ p < 0.05, ns not significant). Error bars represent SD

Similar articles

Cited by

References

    1. Adamson PC. All-trans-retinoic acid pharmacology and its impact on the treatment of acute promyelocytic leukemia. Oncologist. 1996;1(5):305–314. - PubMed
    1. Balasubramanian S, Verner E, Buggy JJ. Isoform-specific histone deacetylase inhibitors: the next step? Cancer Lett. 2009;280(2):211–221. doi: 10.1016/j.canlet.2009.02.013. - DOI - PubMed
    1. Bates SE, Eisch R, Ling A, et al. Romidepsin in peripheral and cutaneous T-cell lymphoma: mechanistic implications from clinical and correlative data. Br J Haematol. 2015;170(1):96–109. doi: 10.1111/bjh.13400. - DOI - PMC - PubMed
    1. Beckouet F, Hu B, Roig MB, et al. An Smc3 acetylation cycle is essential for establishment of sister chromatid cohesion. Mol Cell. 2010;39(5):689–699. doi: 10.1016/j.molcel.2010.08.008. - DOI - PMC - PubMed
    1. Beckouet F, Srinivasan M, Roig MB, et al. Releasing activity disengages cohesin’s Smc3/Scc1 interface in a process blocked by acetylation. Mol Cell. 2016;61(4):563–574. doi: 10.1016/j.molcel.2016.01.026. - DOI - PMC - PubMed

MeSH terms