

Impact of mapped EQ-5D utilities on cost-effectiveness analysis: in the case of dialysis treatments
- PMID: 29948432
- PMCID: PMC6394787
- DOI: 10.1007/s10198-018-0987-x
Impact of mapped EQ-5D utilities on cost-effectiveness analysis: in the case of dialysis treatments
Abstract
Objectives: This study aimed to evaluate the performance of EQ-5D data mapped from SF-12 in terms of estimating cost effectiveness in cost-utility analysis (CUA). The comparability of SF-6D (derived from SF-12) was also assessed.
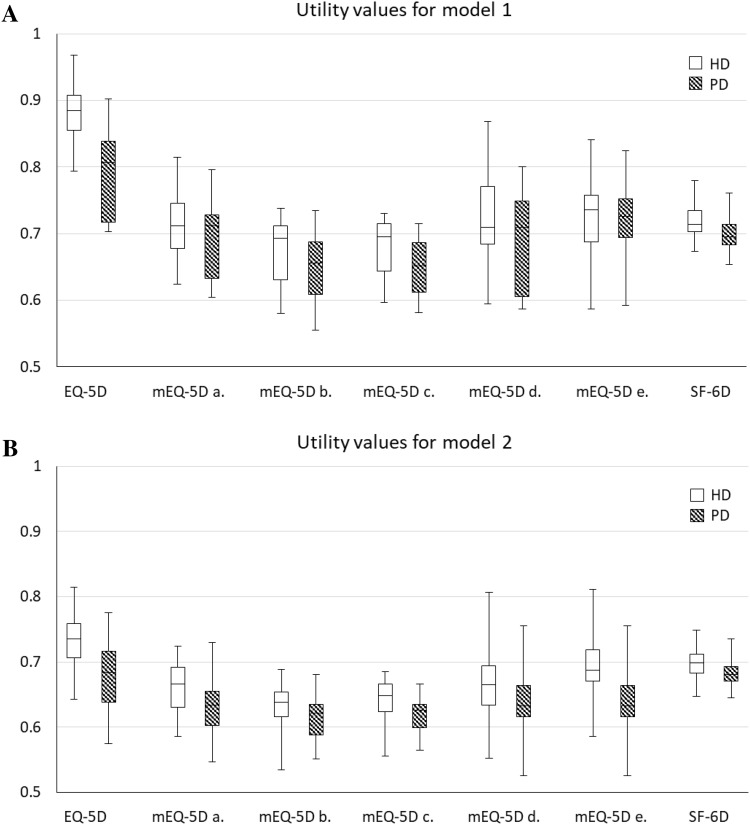
Methods: Incremental quality-adjusted life years (QALYs) and incremental cost-effectiveness ratios (ICERs) were calculated based on two Markov models assessing the cost effectiveness of haemodialysis (HD) and peritoneal dialysis (PD) using utility values based on EQ-5D-5L, EQ-5D using three direct-mapping algorithms and two response-mapping algorithms (mEQ-5D), and SF-6D. Bootstrap method was used to estimate the 95% confidence interval (percentile method) of incremental QALYs and ICERs with 1000 replications for the utilities.
Results: In both models, compared to the observed EQ-5D values, mEQ-5D values expressed much lower incremental QALYs (range - 14.9 to - 33.2%) and much higher ICERs (range 17.5 to 49.7%). SF-6D also estimated lower incremental QALYs (- 29.0 and - 14.9%) and higher ICERs (40.9 and 17.5%) than did the observed EQ-5D. The 95% confidence interval of incremental QALYs and ICERs confirmed the lower incremental QALYs and higher ICERs estimated using mEQ-5D and SF-6D.
Conclusion: Compared to observed EQ-5D, EQ-5D mapped from SF-12 and SF-6D would under-estimate the QALYs gained in cost-utility analysis and thus lead to higher ICERs. It would be more sensible to conduct CUA studies using directly collected EQ-5D data and to designate one single preference-based measure as reference case in a jurisdiction to achieve consistency in healthcare decision-making.
Keywords: Cost-effectiveness; Dialysis; EQ-5D; Mapping; SF-6D.
Conflict of interest statement
ND is an employee of the Office of Health Economics, a registered charity, which receives funding from a variety of sources, including the Association of the British Pharmaceutical Industry. ND and NL are members of the EuroQol Group.
Figures
References
-
- NICE: NICE Guide to the methods of technology appraisal 2013. https://www.nice.org.uk/process/pmg9/chapter/the-reference-case#measurin... (2013). Accessed 15 Aug 2017 - PubMed
-
- CADTH: Guidelines for the Economic Evaluation of Health Technologies: Canada. https://www.cadth.ca/about-cadth/how-we-do-it/methods-and-guidelines/gui... (2017). Accessed 12 Dec 2017
-
- PBS: Guidelines for preparing submissions to the Pharmaceutical Benefits Advisory Committee (Version 4.2). http://www.pbs.gov.au/info/industry/listing/procedure-guidance/4-presubm... (2017). Accessed 12 Dec 2017
-
- SMC: Guidance to manufacturers for completion of New Product Assessment Form (NPAF). https://www.scottishmedicines.org.uk/files/submissionprocess/Guidance_on... (2017). Accessed 12 Dec 2017
MeSH terms
Grants and funding
LinkOut - more resources
Full Text Sources
Other Literature Sources
Molecular Biology Databases
