. 2018 Aug;50(4):1614-1631.
doi: 10.3758/s13428-018-1054-3.

On the importance of avoiding shortcuts in applying cognitive models to hierarchical data

Affiliations

On the importance of avoiding shortcuts in applying cognitive models to hierarchical data

Udo Boehm et al. Behav Res Methods. 2018 Aug.

Abstract

Psychological experiments often yield data that are hierarchically structured. A number of popular shortcut strategies in cognitive modeling do not properly accommodate this structure and can result in biased conclusions. To gauge the severity of these biases, we conducted a simulation study for a two-group experiment. We first considered a modeling strategy that ignores the hierarchical data structure. In line with theoretical results, our simulations showed that Bayesian and frequentist methods that rely on this strategy are biased towards the null hypothesis. Secondly, we considered a modeling strategy that takes a two-step approach by first obtaining participant-level estimates from a hierarchical cognitive model and subsequently using these estimates in a follow-up statistical test. Methods that rely on this strategy are biased towards the alternative hypothesis. Only hierarchical models of the multilevel data lead to correct conclusions. Our results are particularly relevant for the use of hierarchical Bayesian parameter estimates in cognitive modeling.

Keywords: Bayes factor; Cognitive models; Hierarchical Bayesian model; Statistical errors; Statistical test.


Conflict of interest statement

The authors declare no competing financial interests. This research was supported by a Netherlands Organisation for Scientific Research (NWO) grant to UB (406-12-125), an NWO Veni grant to DM (451-15-010), and a European Research Council (ERC) grant to EJW.

Figures

Fig. 1
Fig. 1
Full hierarchical model. N denotes the normal prior, U denotes the uniform prior, and T(0,) indicates truncation at 0
Fig. 2
Fig. 2
Non-hierarchical model. N denotes the normal prior distribution, U denotes the uniform prior, and T(0,) indicates truncation at 0
Fig. 3
Fig. 3
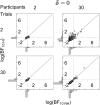
Outcomes of the Bayesian analysis under the hierarchical and non-hierarchical Bayesian model for different numbers of simulated trials (K) and participants (N) for δ = 0. The scatterplot shows a comparison of log-Bayes factors for the hierarchical (BF10H, y-axis) and non-hierarchical (BF10NH, x-axis) Bayesian model. The gray diagonal line shows where log-Bayes factors should fall in the case of equality (logBF10H=logBF10NH). The gray dotted lines indicate the indecision point where logBF=1. Histograms show the marginal distribution of the log-Bayes factors
Fig. 4
Fig. 4
Outcomes of the Bayesian analysis under the hierarchical and non-hierarchical Bayesian model for different numbers of simulated trials (K) and participants (N) for δ = 1. The scatterplot shows a comparison of log-Bayes factors for the hierarchical (BF10H, y-axis) and non-hierarchical (BF10NH, x-axis) Bayesian model. Red asterisks indicate outliers (outliers are jittered to prevent visual overlap). The gray diagonal line shows where log-Bayes factors should fall in the case of equality (logBF10H=logBF10NH). The gray dotted lines indicate the indecision point where logBF=1. Histograms show the marginal distribution of the log-Bayes factors
Fig. 5
Fig. 5
Differences between log-Bayes factors under the hierarchical and non-hierarchical Bayesian model. Violin plots show the distribution of differences between absolute log-Bayes factors, |logBF10H||logBF10NH|, for different numbers of simulated trials (K) and participants (N). Dashed horizontal lines indicate no difference in log-Bayes factors
Fig. 6
Fig. 6
Posterior distribution of effect size δ under the hierarchical and non-hierarchical Bayesian model for different numbers of simulated trials (K) and participants (N). Distributions shown are the prior (light gray dashed lines) and quantile-averaged posterior distributions of δ under the hierarchical (H, black) and non-hierarchical model (NH, dark gray) for δ = 0 (left subplot) and δ = 1 (right subplot). The gray solid vertical line indicates the mean of the prior distribution and the black dashed vertical line shows the true value of δ
Fig. 7
Fig. 7
Outcomes of the frequentist analysis for different numbers of simulated trials (K) and participants (N). Top row: t values for δ = 0 (left subplot) and δ = 1 (right subplot). Dotted lines show t = 0, dashed lines show the critical t value in a two-sided t test with α = .05, and red lines show the theoretical t value. Dots are true t values (TR; blue), t values from a hierarchical frequentist strategy (HF; green), non-hierarchical frequentist strategy (NF; grey), and two-step frequentist strategy (TF; orange); asterisks denote outliers (outliers are jittered to prevent visual overlap). Numbers at the bottom indicate the proportion of significant t values (out of 200 t tests). Bottom row: p values for δ = 0 (left subplot) and for δ = 1 (right subplot). Solid lines indicate p = .05. Dots are true p values (blue), p values from a hierarchical frequentist strategy (green), non-hierarchical strategy (grey), and two-step frequentist strategy (orange). Data points are jittered for improved visibility

References

    1. Ahn W-Y, et al. Decision-making in stimulant and opiate addicts in protracted abstinence: Evidence from computational modeling with pure users. Frontiers in Psychology. 2014;5:1–15. doi: 10.3389/fpsyg.2014.00849. - DOI - PMC - PubMed
    1. Aho K, Derryberry D, Peterson T. Model selection for ecologists: The worldviews of AIC and BIC. Ecology. 2014;95(3):631–636. doi: 10.1890/13-1452.1. - DOI - PubMed
    1. Baayen RH, Davidson DJ, Bates DM. Mixed-effects modeling with crossed random effects for subjects and items. Journal of Memory and Language. 2008;59(4):390–412. doi: 10.1016/j.jml.2007.12.005. - DOI
    1. Badre D, et al. Ventral Striatum and the evaluation of memory retrieval strategies. Journal of Cognitive Neuroscience. 2014;26(9):1928–1948. doi: 10.1162/jocn_a_00596. - DOI - PMC - PubMed
    1. Beitz KM, Salthouse TA, Davis HP. Performance on the Iowa Gambling Task: From 5 to 89 years of age. Journal of Experimental Psychology: General. 2014;143(4):1677–1689. doi: 10.1037/a0035823. - DOI - PMC - PubMed

Publication types

LinkOut - more resources