. 2018 Jun 26;23(13):3759-3768.
doi: 10.1016/j.celrep.2018.05.096.

NMDA Receptor Autoantibodies in Autoimmune Encephalitis Cause a Subunit-Specific Nanoscale Redistribution of NMDA Receptors

Affiliations

NMDA Receptor Autoantibodies in Autoimmune Encephalitis Cause a Subunit-Specific Nanoscale Redistribution of NMDA Receptors

Laurent Ladépêche et al. Cell Rep. .

Abstract

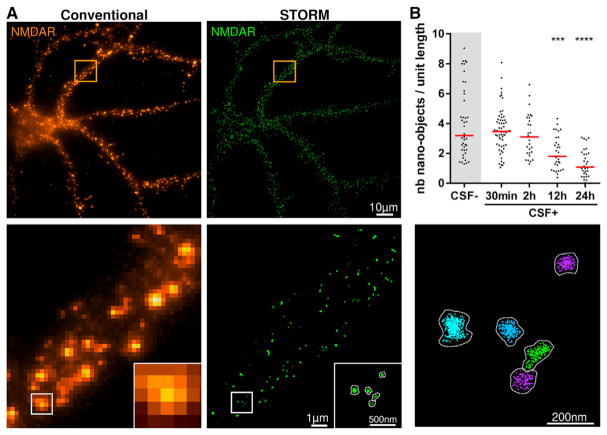
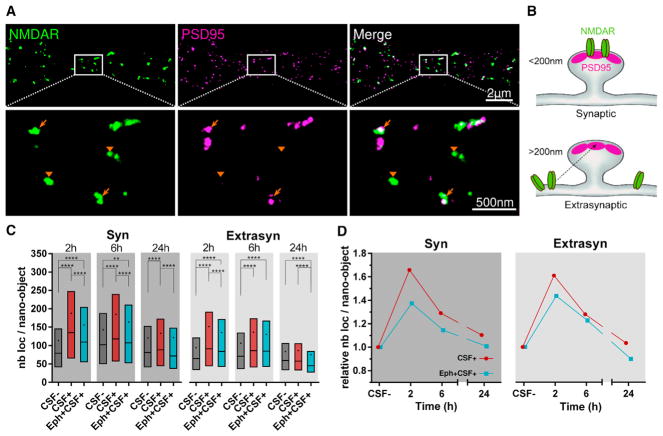
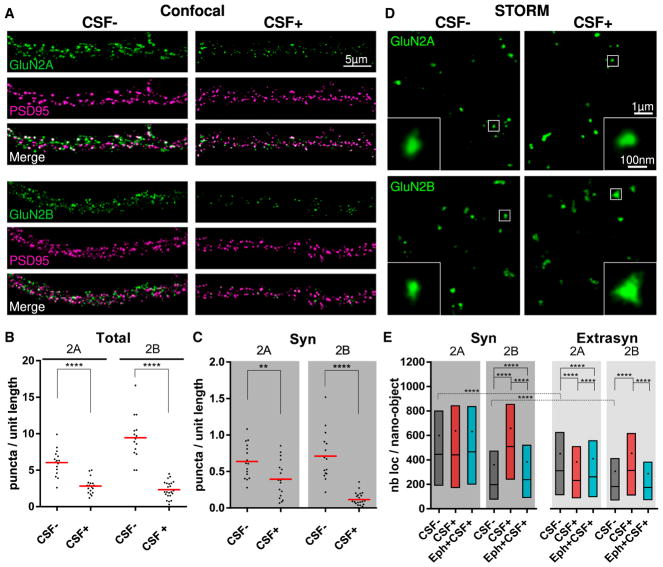
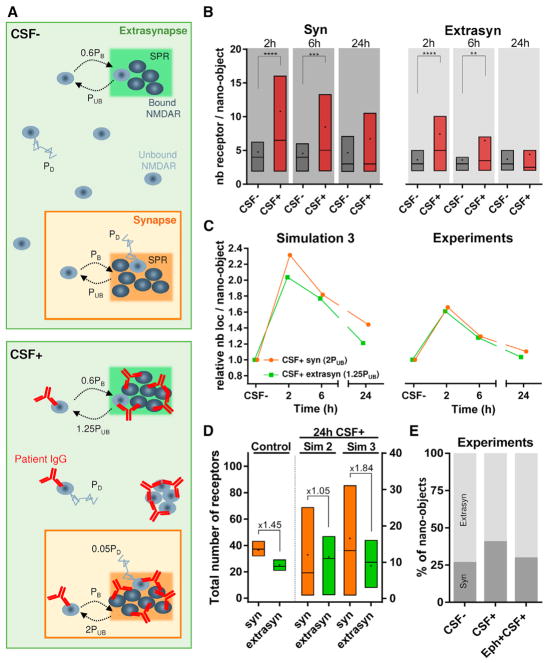
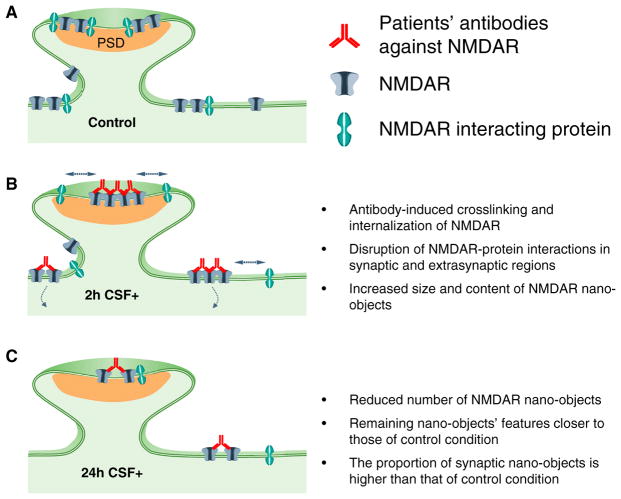
Anti-N-methyl-D-aspartate receptor (NMDAR) encephalitis is a severe neuropsychiatric disorder mediated by autoantibodies against the GluN1 subunit of the NMDAR. Patients' antibodies cause cross-linking and internalization of NMDAR, but the synaptic events leading to depletion of NMDAR are poorly understood. Using super-resolution microscopy, we studied the effects of the autoantibodies on the nanoscale distribution of NMDAR in cultured neurons. Our findings show that, under control conditions, NMDARs form nanosized objects and patients' antibodies increase the clustering of synaptic and extrasynaptic receptors inside the nano-objects. This clustering is subunit specific and predominantly affects GluN2B-NMDARs. Following internalization, the remaining surface NMDARs return to control clustering levels but are preferentially retained at the synapse. Monte Carlo simulations using a model in which antibodies induce NMDAR cross-linking and disruption of interactions with other proteins recapitulated these results. Finally, activation of EphB2 receptor partially antagonized the antibody-mediated disorganization of the nanoscale surface distribution of NMDARs.

Keywords: GluN2 subunits; NMDAR encephalitis; STORM; antibody; autoimmune; pathogenic mechanism; super-resolution microscopy; synaptic proteins.


Conflict of interest statement

DECLARATION OF INTERESTS

J.D. holds a patent for the use of Ma2 and NMDAR as an autoantibody test, receives royalties related to this test, and has an unrestricted research grant from Euroimmun.

Figures

Figure 1
Figure 1. NMDAR Autoantibodies Lead to a Decrease in the Surface Density of NMDAR Nano-objects as Revealed by Super-resolution Microscopy
(A) A representative conventional wide-field (upper left panel) and super-resolution (upper right panel) fluorescence image of NMDAR in cultured hippocampal neurons. Zoom of the region inside the orange square in the conventional image is shown in the lower left panel. A super-resolution image of the region inside the white square is shown in the lower middle panel. The lower right panel displays the result of the cluster analysis, in which each NMDAR nano-object in the super-resolution image is segmented as a different color using the raw localization data. The number of localizations (given by the individual crosses), the area of the nano-objects, and the number of localizations per nano-object can be quantified after cluster analysis. (B) Neurons were treated for 30 min or 2, 6, 12, or 24 hr with control or patients’ CSF (CSF− and CSF+, respectively), and the density of surface NMDAR nano-objects per unit length (in micrometers) of dendrite was measured in the super-resolution images. When compared to control CSF (CSF−), the incubation with patients’ CSF (CSF+) caused a significant reduction of the surface NMDAR nano-objects, with a maximal reduction at 24 hr of treatment. Bars represent medians, and dots correspond to individual cells (n ≥ 29 fields of view; ***p < 0.001, ****p < 0.0001). See also Figures S1 and S2.
Figure 2
Figure 2. NMDAR Autoantibodies Induce a Time-Dependent Increase in the Receptor Content of the Surface NMDAR Nano-objects
(A) Upper panels show a representative STORM image of the surface NMDAR (green) and PSD95 (magenta). Lower panels are higher magnifications of the white region, showing examples of synaptic (arrows) and extrasynaptic (arrowheads) NMDAR nano-objects. (B) Schematic illustration representing the distinction used to identify synaptic versus extrasynaptic NMDAR nano-objects located within 200 nm of the center of the closest PSD95 nano-object versus farther away. (C) Quantification of the number of localizations per NMDAR nano-object, a relative measure of the receptor content of the nano-objects, after 2, 6, or 24 hr of incubation with the control CSF (CSF−, dark gray), with patients’ CSF alone (CSF+, red), or in the presence of ephrin-B2 (Eph+CSF+, cyan). The box, line, and dot correspond to interquartile range (IQR, 25th–75th percentile), median, and mean, respectively (synaptic, n ≥ 835 nano-objects; extrasynaptic, n ≥ 2001 nano-objects; **p < 0.01, ***p < 0.001, ****p < 0.0001). (D) Relative change in the number of localizations per nano-object obtained by normalizing the CSF+ means at each time to the corresponding CSF− means. (See also Figure S3.
Figure 3
Figure 3. NMDAR Autoantibodies Alter Differently the Distribution of GluN2A-NMDAR and GluN2B-NMDAR
(A) Representative confocal images of surface GluN2A-NMDAR (green, upper panels) or GluN2B-NMDAR (green, lower panels) subunits labeled, together with PSD95 (magenta), after 24 hr of incubation of control or patients’ CSF (CSF−, left panels, and CSF+, right panels). Note the visible decrease in the GluN2A and GluN2B labeling in the presence of the patients’ CSF. (B and C) Quantification of the density of surface GluN2A or GluN2B puncta per unit length (in micrometers) of dendrite either considering all surface puncta (B, Total) or isolating the ones that co-localize with PSD95, and are synaptic (C, Syn). Red lines represent the means, and dots correspond to individual cells (n ≥ 15 fields of view; **p < 0.01, ***p < 0.001, ****p < 0.0001). (D) Representative STORM images of GluN2A (upper) and GluN2B (lower) that have been incubated with control or patients’ CSF (CSF−, left panels, and CSF+, right panels, respectively) for 24 hr. Insets show zooms of nano-objects corresponding to the white squared region. Note the increased size of the GluN2B nano-objects in the CSF+ condition. (E) Quantification of the number of localizations per NMDAR nano-object after 24 hr of incubation with control CSF (CSF−, dark gray), with patients’ CSF alone (CSF+, red), or in the presence of ephrin-B2 (Eph+CSF+, cyan). The box, line, and dot correspond to IQR, median, and mean, respectively (synaptic, n ≥ 2,649 nano-objects; extrasynaptic, n ≥ 5,213 nano-objects; ****p < 0.0001). See also Figures S4 and S5.
Figure 4
Figure 4. Monte Carlo Simulations Recapitulate Experimental Results
(A) Schematic representation (top view) of NMDAR dynamics simulation for CSF− (control or without antibodies) and CSF+ (with NMDAR antibodies). The synapse and extrasynapse are represented as orange and green areas, respectively (not represented here at their true scale value), with one scaffold protein region (SPR) in each. The receptors follow binding and unbinding events with the scaffold proteins in the SPR and can be in a bound state (dark gray) or an unbound state (light gray). The binding probability of a receptor is PB = 1 in the synapse and 0.6PB in the extra-synapse for both CSF− and CSF+. The unbinding probability of a receptor is PUB = 0.167 in both the extrasynapse and the synapse for CSF−. For CSF+, unbinding probability increases to 1.25PUB in the extrasynapse and 2PUB in the synapse. All unbound receptors diffuse with a probability PD = 1 for CSF−. For CSF+, unbound receptors belonging to a nano-object diffuse with a reduced probability of 0.05PD, but this diffusion probability remains unchanged for unbound receptors not forming any nano-object. (B) Distribution of receptors per nano-object at 2, 6, and 24 hr in the synapse and extrasynapse for both CSF− and CSF+ conditions obtained from simulation. The box, line, and dot correspond to IQR, median, and mean, respectively (synaptic, n ≥ 56 nano-objects; extrasynaptic, n ≥ 60 nano-objects; **p < 0.01, ***p < 0.001, ****p < 0.0001). (C) Comparison of the fold change in nano-object content at different times (2, 6, and 24 hr) relative to the corresponding CSF− values for simulations (left) and experimental data (right). Each data point is obtained by normalizing the mean of receptors per nano-object value at each time point for CSF+ with the mean of receptors per nano-object value obtained from the corresponding time points for CSF−. (D) Total number of receptors present in the synapse (orange) and extrasynapse (green) at 24 hr for simulation control (left), simulation 2 (middle), and simulation 3 (right). Data are obtained from the simulated area of ~200 × 200 nm2 for both synapse and extrasynapse. The fold difference from the mean of the synaptic to the extrasynaptic number of receptors is indicated above the boxes. The box, line, and dot correspond to IQR, median, and mean, respectively (control, n = 40 runs; simulation 2, n = 19 runs; simulation 3, n = 22 runs). (E) Quantification of percentage of synaptic (dark gray) versus extrasynaptic (light gray) nano-objects from experimental data after 24 hr of treatment with patients’ CSF alone (CSF+) or in the presence of ephrin-B2 (Eph+CSF+). See also Figure S6 and Videos S1, S2, and S3.
Figure 5
Figure 5. Schematic Representation of the Changes Occurring in NMDAR Organization following Treatment with Patients’ NMDAR Antibodies
(A) Under control conditions, NMDAR are distributed at the neuronal surface, forming nano-objects both inside and outside the synapse. (B) At early times, antibody-induced clustering leads to formation of larger nano-objects containing more receptors, particularly in the synapse. (C) At later times, dynamic exchange of receptors, facilitated by the disruption of NMDARs’ interaction with other proteins in both the synapse and the extrasynapse, coupled with clustering-induced internalization, leads to a decrease in NMDAR nano-object size and content back toward control values while leading to an overall global decrease of NMDAR nano-objects.

References

    1. Bates M, Huang B, Dempsey GT, Zhuang X. Multicolor super-resolution imaging with photo-switchable fluorescent probes. Science. 2007;317:1749–1753. - PMC - PubMed
    1. Dalmau J, Graus F. Antibody-Mediated Encephalitis. N Engl J Med. 2018;378:840–851. - PubMed
    1. Dalmau J, Gleichman AJ, Hughes EG, Rossi JE, Peng X, Lai M, Dessain SK, Rosenfeld MR, Balice-Gordon R, Lynch DR. Anti-NMDA-receptor encephalitis: case series and analysis of the effects of antibodies. Lancet Neurol. 2008;7:1091–1098. - PMC - PubMed
    1. Dalmau J, Geis C, Graus F. Autoantibodies to Synaptic Receptors and Neuronal Cell Surface Proteins in Autoimmune Diseases of the Central Nervous System. Physiol Rev. 2017;97:839–887. - PMC - PubMed
    1. Dalva MB, Takasu MA, Lin MZ, Shamah SM, Hu L, Gale NW, Greenberg ME. EphB receptors interact with NMDA receptors and regulate excitatory synapse formation. Cell. 2000;103:945–956. - PubMed

Publication types

MeSH terms

Supplementary concepts