. 2018 Jun 26;7(3):37.
doi: 10.3390/biology7030037.

Effects of Moringa oleifera Leaves Extract on High Glucose-Induced Metabolic Changes in HepG2 Cells

Affiliations

Effects of Moringa oleifera Leaves Extract on High Glucose-Induced Metabolic Changes in HepG2 Cells

Jorge A Sosa-Gutiérrez et al. Biology (Basel). .

Abstract

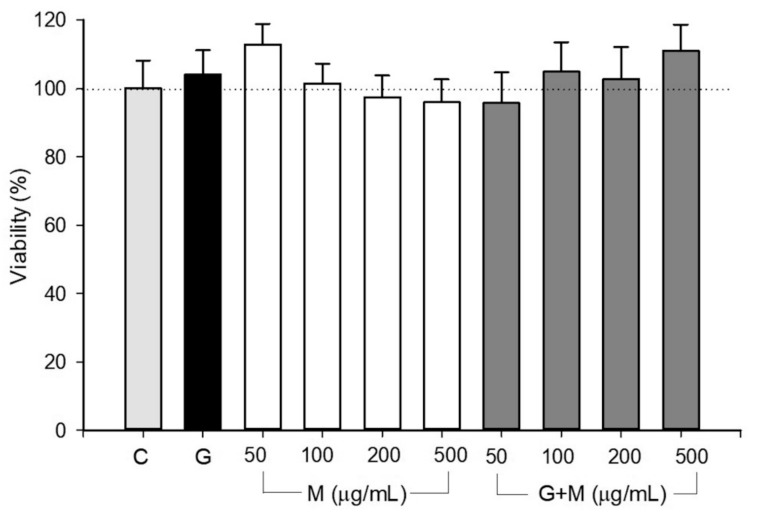
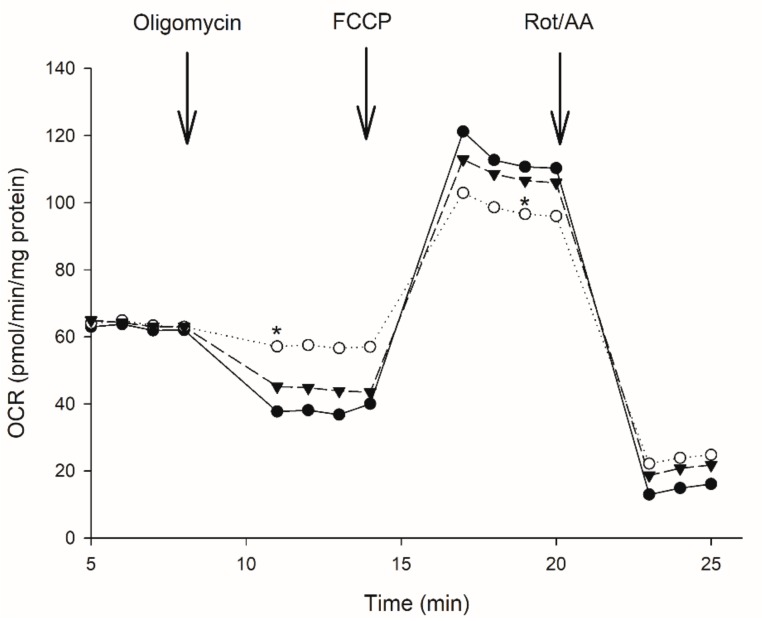
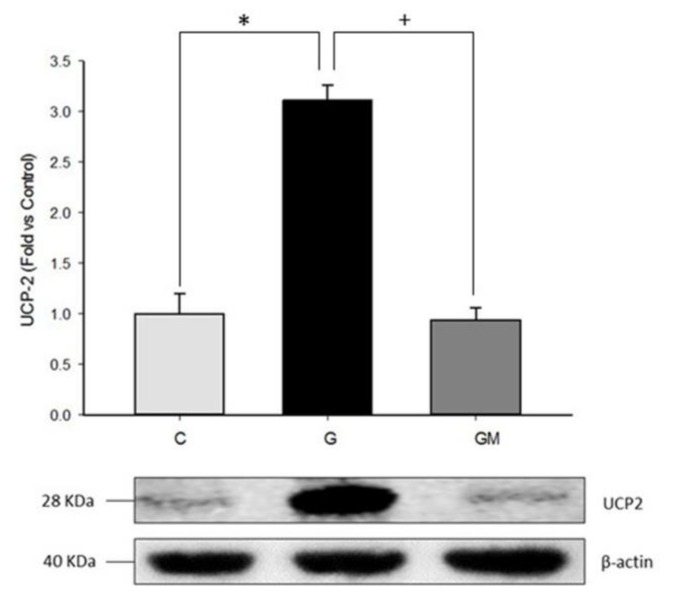
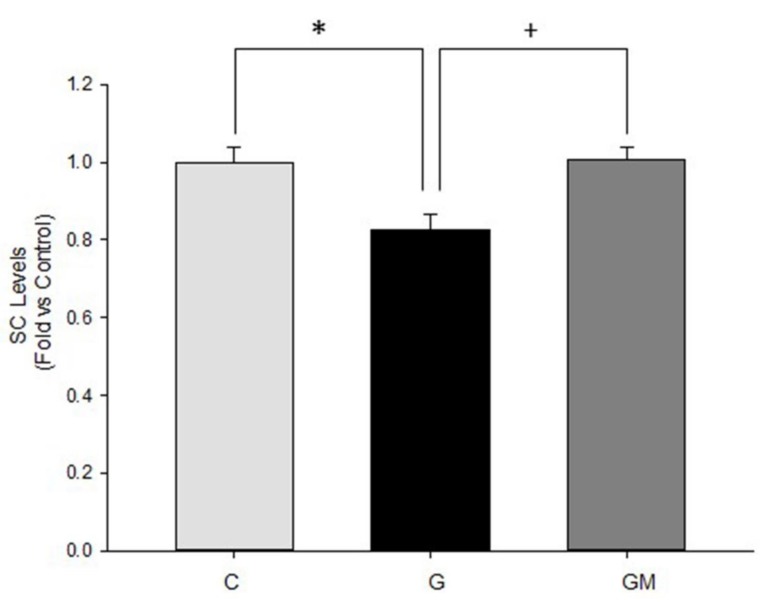
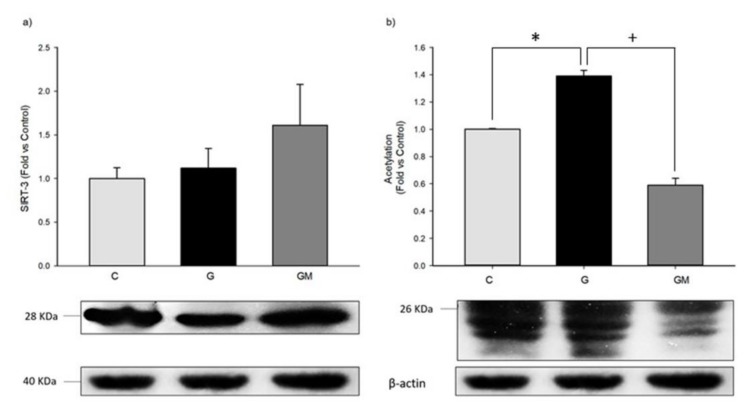
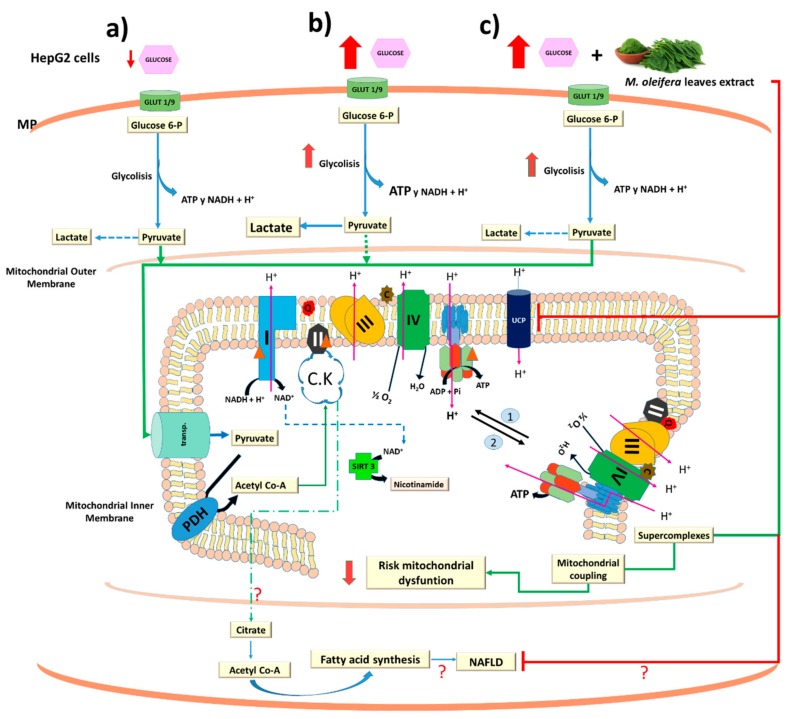
Mitochondrial dysfunction is a hallmark of diabetes, but the metabolic alterations during early stages of the disease remain unknown. The ability of liver cells to rearrange their metabolism plays an important role in compensating the energy shortage and may provide cell survival. Moringa oleifera leaves have been studied for its health properties against diabetes, insulin resistance, and non-alcoholic liver disease. We postulated that M. oleifera executes a protective function on mitochondrial functionality in HepG2 treated with high glucose. We evaluated the effect of high glucose treatment on the mitochondrial function of HepG2 cells using a Seahorse extracellular flux analyzer (Agilent, Santa Clara, CA, USA), blue native polyacrylamide gel electrophoresis (BN-PAGE), and western blot analysis. For assessment of mitochondrial abnormalities, we measured the activity of mitochondrial Complex I and IV as well as uncoupling protein 2, and sirtuin 3 protein contents. Our results demonstrate that, under conditions mimicking the hyperglycemia, Complex I activity, UCP2, Complex III and IV subunits content, supercomplex formation, and acetylation levels are modified with respect to the control condition. However, basal oxygen consumption rate was not affected and mitochondrial reactive oxygen species production remained unchanged in all groups. Treatment of HepG2 cells with M. oleifera extract significantly increased both protein content and mitochondrial complexes activities. Nonetheless, control cells’ respiratory control ratio (RCR) was 4.37 compared to high glucose treated cells’ RCR of 15.3, and glucose plus M. oleifera treated cells’ RCR of 5.2, this indicates high-quality mitochondria and efficient oxidative phosphorylation coupling. Additionally, the state app was not altered between different treatments, suggesting no alteration in respiratory fluxes. These findings enhance understanding of the actions of M. oleifera and suggest that the known antidiabetic property of this plant, at least in part, is mediated through modulating the mitochondrial respiratory chain.

Keywords: HepG2 cells; Moringa oleifera; SIRT3; UCP2; mitochondria.


Conflict of interest statement

The authors declare no conflict of interest.

Figures

Figure 1
Figure 1
Viability of HepG2 cells treated with glucose and M. oleifera extract. Cells were incubated as described in material and methods section and incubated with 25 mM glucose (G) and different concentrations of M. oleifera extract (GM; 50–500 µg/mL). Data are expressed as the average ± SD from n = 4.
Figure 2
Figure 2
Absolute change in mitochondrial function in intact HepG2 cells treated with glucose 25 mM (white circle) and M. oleifera extract 500 µg/mL (inverted gray triangle). The addition of oligomycin at 5 min inhibits ATP production resulting in a decrease in oxygen consumption rate (OCR). The OCR increases in all treatments following the addition of FCCP at 13 min (uncoupled state). Electron transport chain inhibitors mix (Rotenone and Antimycin A) decrease oxygen consumption rates to very low levels inhibiting total mitochondrial respiration at 18 min. * significant difference against control p ≤ 0.05.
Figure 3
Figure 3
UCP2 protein levels in HepG2 cells treated with glucose 25 mM (G) and M. oleifera extract 500 µg/mL (GM). Cells without treatment represent control condition (C). * significant difference against control p ≤ 0.05. + significant difference against G cells p ≤ 0.05. Data normalized to control group using β-actin.
Figure 4
Figure 4
(a) Characterization of OXPHOS proteins expressed in HepG2 cells during high glucose with or without M. oleifera extract. OXPHOS cocktail specificity demonstrated by Western blot of MTC01 subunit of CIV, SDHB subunit of CII, UQCRC2 subunit of CIII, NDUFB8 subunit of CI, and ATP5A subunit of CV. BN-PAGE. Activity of CI (b) and CIV (c) in isolated mitochondria from HepG2 cells under normal (C), glucose 25 mM (G), and 500 µg/mL M. oleifera extract (GM) conditions. * significant difference against control p ≤ 0.05. + significant difference against G cells p ≤ 0.05. Data normalized to control group using β-actin.
Figure 5
Figure 5
Interactions between mitochondrial complexes in HepG2 cells under normal (C), glucose 25 mM (G), and 500 µg/mL M. oleifera extract (GM) conditions. * significant difference against control p ≤ 0.05. + significant difference against G cells p ≤ 0.05.
Figure 6
Figure 6
Sirt3 (a) and overall acetylation (b) protein levels in HepG2 cells under normal (C), 25 mM glucose (G) and 500 µg/mL M. oleifera extract (GM) conditions. * significant difference against control p ≤ 0.05. + significant difference against G cells p ≤ 0.05. Data normalized to control group using β-actin.
Figure 7
Figure 7
Proposed model for uncoupling protein 2-acetylation by sirtuins signaling pathway on HepG2 treated with high glucose and M. oleifera extract. The solid lines indicate carbon skeletal main flux to mitochondria (a). While that punted lines indicates the secondary pathways. PDH, pyruvate dehydrogenase; CK, Krebs cycle. The numbers 1 and 2 indicates the dissociation and association of the mitochondrial supercomplexes. Red and green lines indicate inhibition and activation of metabolic process by high glucose (b) and M. oleifera extract (c), respectively. Glut 1 and Glut 9 as major contributors to glucose influx in HepG2 cells [87]. MP, plasma membrane. Red triangle indicates potential site of acetylation in mitochondrial complexes.

Similar articles

Cited by

References

    1. Abd Eldaim M.A., Shaban Abd Elrasoul A., Abd Elaziz S.A. An aqueous extract from Moringa oleifera leaves ameliorates hepatotoxicity in alloxan-induced diabetic rats. Biochem. Cell Biol. 2017;95:524–530. doi: 10.1139/bcb-2016-0256. - DOI - PubMed
    1. Aa A.B., Om J., Ts E., Ga A. Preliminary phytochemical screening, antioxidant and antihyperglycaemic activity of Moringa oleifera leaf extracts. Pak. J. Pharm. Sci. 2017;30:2217–2222. - PubMed
    1. Vergara Jimenez M., Almatrafi M.M., Fernandez M.L. Bioactive Components in Moringa Oleifera Leaves Protect against Chronic Disease. Antioxidants. 2017;6:91. doi: 10.3390/antiox6040091. - DOI - PMC - PubMed
    1. Makkar H.P.S., Becker K. Nutrional value and antinutritional components of whole and ethanol extracted Moringa oleifera leaves. Anim. Feed Sci. Technol. 1996;63:211–228. doi: 10.1016/S0377-8401(96)01023-1. - DOI
    1. Tabbon P., Sripanidkulchai B., Sripanidkulchai K. Hypocholesterolemic mechanism of phenolics-enriched extract from Moringa oleifera leaves in HepG2 cell lines. Songklanakarin J. Sci. Technol. 2016;38:155–161.

LinkOut - more resources