

Gene prioritization using Bayesian matrix factorization with genomic and phenotypic side information
- PMID: 29949967
- PMCID: PMC6022676
- DOI: 10.1093/bioinformatics/bty289
Gene prioritization using Bayesian matrix factorization with genomic and phenotypic side information
Abstract
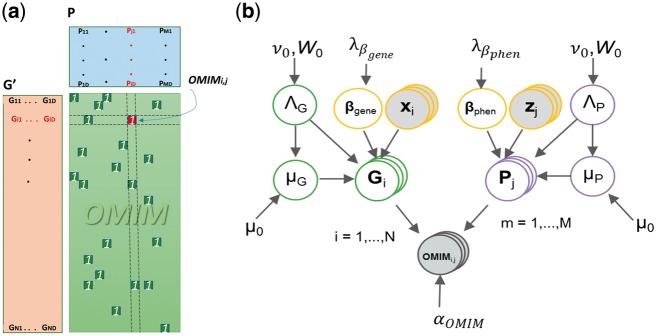
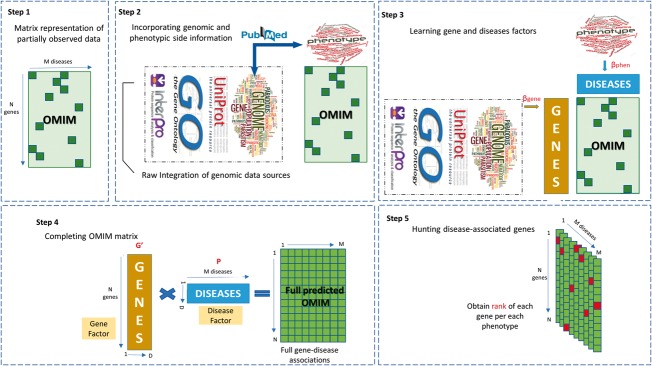
Motivation: Most gene prioritization methods model each disease or phenotype individually, but this fails to capture patterns common to several diseases or phenotypes. To overcome this limitation, we formulate the gene prioritization task as the factorization of a sparsely filled gene-phenotype matrix, where the objective is to predict the unknown matrix entries. To deliver more accurate gene-phenotype matrix completion, we extend classical Bayesian matrix factorization to work with multiple side information sources. The availability of side information allows us to make non-trivial predictions for genes for which no previous disease association is known.
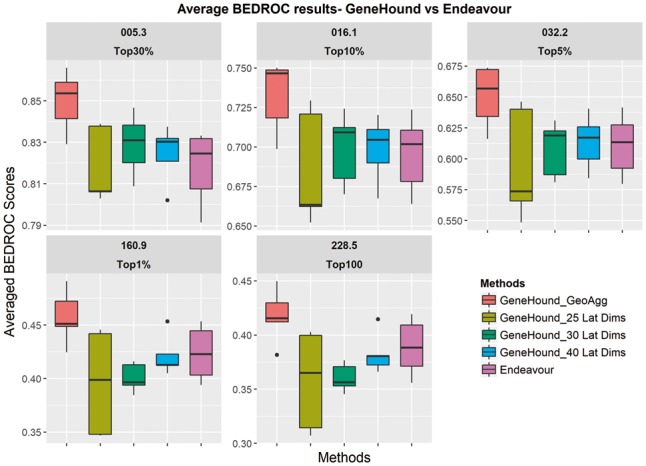
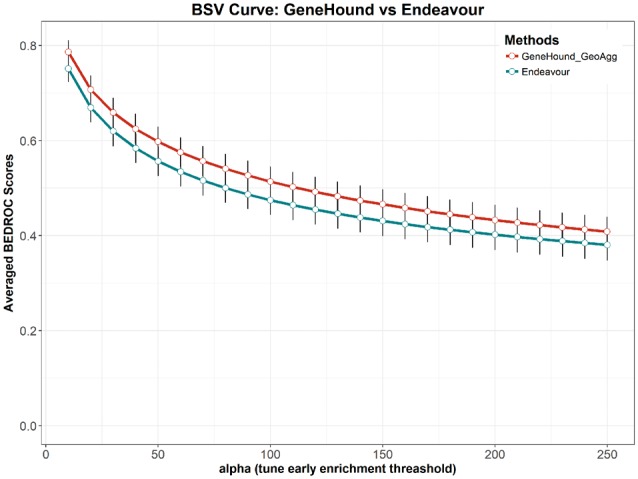
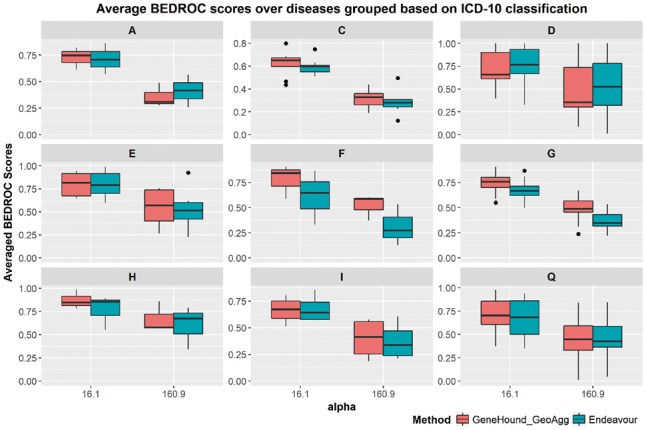
Results: Our gene prioritization method can innovatively not only integrate data sources describing genes, but also data sources describing Human Phenotype Ontology terms. Experimental results on our benchmarks show that our proposed model can effectively improve accuracy over the well-established gene prioritization method, Endeavour. In particular, our proposed method offers promising results on diseases of the nervous system; diseases of the eye and adnexa; endocrine, nutritional and metabolic diseases; and congenital malformations, deformations and chromosomal abnormalities, when compared to Endeavour.
Availability and implementation: The Bayesian data fusion method is implemented as a Python/C++ package: https://github.com/jaak-s/macau. It is also available as a Julia package: https://github.com/jaak-s/BayesianDataFusion.jl. All data and benchmarks generated or analyzed during this study can be downloaded at https://owncloud.esat.kuleuven.be/index.php/s/UGb89WfkZwMYoTn.
Supplementary information: Supplementary data are available at Bioinformatics online.
Figures
Similar articles
-
pBRIT: gene prioritization by correlating functional and phenotypic annotations through integrative data fusion.Bioinformatics. 2018 Jul 1;34(13):2254-2262. doi: 10.1093/bioinformatics/bty079. Bioinformatics. 2018. PMID: 29452392 Free PMC article.
-
Candidate gene prioritization with Endeavour.Nucleic Acids Res. 2016 Jul 8;44(W1):W117-21. doi: 10.1093/nar/gkw365. Epub 2016 Apr 30. Nucleic Acids Res. 2016. PMID: 27131783 Free PMC article.
-
Comparison of vocabularies, representations and ranking algorithms for gene prioritization by text mining.Bioinformatics. 2008 Aug 15;24(16):i119-25. doi: 10.1093/bioinformatics/btn291. Bioinformatics. 2008. PMID: 18689812
-
[From symptom to syndrome using modern software support].Internist (Berl). 2018 Aug;59(8):766-775. doi: 10.1007/s00108-018-0456-8. Internist (Berl). 2018. PMID: 29995249 Review. German.
-
Molecular genetic epidemiology of human diseases: from patterns to predictions.Hum Genet. 2014 Apr;133(4):425-30. doi: 10.1007/s00439-013-1396-y. Epub 2013 Nov 19. Hum Genet. 2014. PMID: 24241280 Review.
Cited by
-
Applications of machine learning to diagnosis and treatment of neurodegenerative diseases.Nat Rev Neurol. 2020 Aug;16(8):440-456. doi: 10.1038/s41582-020-0377-8. Epub 2020 Jul 15. Nat Rev Neurol. 2020. PMID: 32669685 Review.
-
Potential Schizophrenia Disease-Related Genes Prediction Using Metagraph Representations Based on a Protein-Protein Interaction Keyword Network: Framework Development and Validation.JMIR Form Res. 2023 Nov 15;7:e50998. doi: 10.2196/50998. JMIR Form Res. 2023. PMID: 37966892 Free PMC article.
-
HetIG-PreDiG: A Heterogeneous Integrated Graph Model for Predicting Human Disease Genes based on gene expression.PLoS One. 2023 Feb 15;18(2):e0280839. doi: 10.1371/journal.pone.0280839. eCollection 2023. PLoS One. 2023. PMID: 36791052 Free PMC article.
-
Knowledge graph-aided Bayesian active learning for top-K genetic interaction discovery.Sci Rep. 2025 Aug 25;15(1):31196. doi: 10.1038/s41598-025-13972-7. Sci Rep. 2025. PMID: 40854903 Free PMC article.
-
Identifying potential association on gene-disease network via dual hypergraph regularized least squares.BMC Genomics. 2021 Aug 9;22(1):605. doi: 10.1186/s12864-021-07864-z. BMC Genomics. 2021. PMID: 34372777 Free PMC article.
References
-
- Aerts S. et al. (2006) Gene prioritization through genomic data fusion. Nat. Biotech., 24, 537–544. - PubMed
-
- Amberger J. et al. (2011) A new face and new challenges for Online Mendelian Inheritance in Man (OMIM). Hum. Mutat., 32, 564–567. - PubMed
-
- Arany A. et al. (2015) Highly scalable tensor factorization for prediction of drug-protein interaction type. MLCB/MLSB NIPS Workshop. Canada; arXiv: 1512.00315.
-
- Becker K. et al. (2004) The genetic association database. Nat. Genet., 36, 431–432. - PubMed
Publication types
MeSH terms
LinkOut - more resources
Full Text Sources
Other Literature Sources
