. 2018 Jul 1;34(13):i341-i349.
doi: 10.1093/bioinformatics/bty235.

A spectral clustering-based method for identifying clones from high-throughput B cell repertoire sequencing data

Affiliations

A spectral clustering-based method for identifying clones from high-throughput B cell repertoire sequencing data

Nima Nouri et al. Bioinformatics. .

Abstract

Motivation: B cells derive their antigen-specificity through the expression of Immunoglobulin (Ig) receptors on their surface. These receptors are initially generated stochastically by somatic re-arrangement of the DNA and further diversified following antigen-activation by a process of somatic hypermutation, which introduces mainly point substitutions into the receptor DNA at a high rate. Recent advances in next-generation sequencing have enabled large-scale profiling of the B cell Ig repertoire from blood and tissue samples. A key computational challenge in the analysis of these data is partitioning the sequences to identify descendants of a common B cell (i.e. a clone). Current methods group sequences using a fixed distance threshold, or a likelihood calculation that is computationally-intensive. Here, we propose a new method based on spectral clustering with an adaptive threshold to determine the local sequence neighborhood. Validation using simulated and experimental datasets demonstrates that this method has high sensitivity and specificity compared to a fixed threshold that is optimized for these measures. In addition, this method works on datasets where choosing an optimal fixed threshold is difficult and is more computationally efficient in all cases. The ability to quickly and accurately identify members of a clone from repertoire sequencing data will greatly improve downstream analyses. Clonally-related sequences cannot be treated independently in statistical models, and clonal partitions are used as the basis for the calculation of diversity metrics, lineage reconstruction and selection analysis. Thus, the spectral clustering-based method here represents an important contribution to repertoire analysis.

Availability and implementation: Source code for this method is freely available in the SCOPe (Spectral Clustering for clOne Partitioning) R package in the Immcantation framework: www.immcantation.org under the CC BY-SA 4.0 license.

Supplementary information: Supplementary data are available at Bioinformatics online.


Figures

Fig. 1.
Fig. 1.
The distance-to-nearest distribution can be bimodal or unimodal. BCR sequencing data was obtained for (A, E) cervical lymph node B cells from multiple sclerosis patients (Stern et al., 2014), (B) peripheral blood B cells from a patient with an acute dengue virus infection (Parameswaran et al., 2013), (C) sorted memory and naive B cells from a healthy donor blood sample (Vander Heiden et al., 2017), (D) peripheral blood B cells from a healthy, older adult donor (de Bourcy et al., 2017), (F) splenic B cells from an organ donor (Meng et al., 2017) and (G, H) simulated data from Ralph and Matsen (Ralph and Matsen, 2016). Within each dataset, the nucleotide Hamming distance (normalized by junction length) from each sequence to every other sequence with the same V gene annotation, J gene annotation and junction length was calculated and the nearest (non-zero) neighbor was identified. Bi-modal ‘distance-to-nearest’ distributions (A, B, C, D) were fit to a mixture model of Gamma distributions (solid lines) in order to determine the optimal threshold (vertical dashed lines; Nouri and Kleinstein, 2017)
Fig. 2.
Fig. 2.
Schematic overview for determination of scale parameter used in the spectral clustering-based method. (A) The Hamming distance of each unique sequence (rows) to every other sequence with the same V gene, J gene and junction length is determined and rank-ordered (columns). (B) For each row i, consecutive elements are examined to find the first largest gap in distance values, which is used to define the neighborhood width. The scale parameter σi associated to the ith sequence is determined as the SD of distances within this neighborhood (shaded areas in A)
Fig. 3.
Fig. 3.
The clustering-based method identifies clones with high confidence on simulated data. The spectral (circles) and hierarchical (diamonds) clustering-based methods were applied to identify clonally related sequences in 40 simulated datasets (10 datasets from each of 4 simulated individuals R1–R4) generated by Gupta et al. (Gupta et al., 2017). Performance was assessed by calculating (A) sensitivity and (B) specificity on three junction-length domains. Mean performance is indicated by the solid bars (spectral) and dashed bars (hierarchical)
Fig. 4.
Fig. 4.
Clones identified by the spectral clustering-based method are more homogeneous. The spectral and hierarchical clustering-based methods were applied independently to identify clones in cervical lymph node samples from four multiple sclerosis patients (M2, M3, M4 and M5) obtained from (Stern et al., 2014). (A) Comparison of clone sizes between pairs of 25 largest inferred clones via hierarchical (x-axis) and spectral (y-axis) clustering-based methods. Clones with any overlapping membership are indicated in black. (B) Dendrogram trees representative of cases where the two methods differed in each of the four individuals. The spectral clustering-based method implied a smaller threshold (vertical dot-dash line) for these clones that removed outlying branches (dashed branches), thus creating a more homogeneous clone compared to the fixed threshold at 0.15 (vertical dashed line) used by the hierarchical clustering-based method. Panel titles indicate total sequences, while leaves represent unique sequences in each clone
Fig. 5.
Fig. 5.
The spectral clustering-based method identifies clones with more shared mutations. (AD) The number of shared mutations in the V segment (up to the start of the junction) was determined for the 50 largest clones (covering 30% of the total reads) inferred by spectral clustering (black bars towards left), hierarchical clustering (black bars towards right) and negative controls (grey bars). Results are shown for the same four experimental datasets shown in Figure 4. Note that fewer than 50 clones are shown because some pairs of largest inferred clones did not overlap or no shared mutation was observed for either method. (EH) The total number of shared mutations across all clones identified by the spectral (circles) and hierarchical (triangles pointing up) clustering-based methods, as well as a negative control (triangles pointing down) was determined for each subject M2–M5
Fig. 6.
Fig. 6.
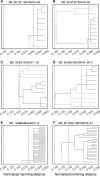
Clones identified by the spectral clustering-based method are more homogeneous. Representative examples of dendrogram trees from clones where the spectral and hierarchical clustering-based methods found differing numbers of shared mutations in (A, B, C) M2, (D) M3, (E) M4 and (F) M5 (see details in Fig. 5). Dendrogram leaves are unique sequences in the clone found by both clustering-based methods (connected by solid lines) or only by the hierarchical clustering-based method (connected by dashed lines). Each panel also shows the fixed threshold of 0.15 normalized Hamming distance used by the hierarchical clustering-based method (vertical dashed lines) and the threshold necessary to reproduce the clone identified by the spectral clustering-based method (vertical dot-dash lines)
Fig. 7.
Fig. 7.
The spectral clustering-based method identifies clones with more shared mutations in subjects with acute dengue virus infections. The spectral and hierarchical clustering-based methods were applied to peripheral blood B cell repertoires from 58 subjects with acute dengue virus infections (Parameswaran et al., 2013). The total number of shared mutations in the V segment (up to the start of the junction) was determined for clones that were among the 50 largest inferred by both the spectral clustering and hierarchical clustering methods (covering 25% of the total reads), and the difference between the methods was calculated. Each number represents a single clone, with the number specifying the individual where the clone was observed and the x-axis label indicating the V gene used by the clone
Fig. 8.
Fig. 8.
Compactness and isolation properties vary across repertoire datasets. For each dataset, the maximum-distance-within clones (compactness, black) and minimum-distance-between clones (isolation, grey) were calculated across all clones. Results are shown for simulated datasets from Ralph and Matsen (Ralph and Matsen, 2016) (A) sim-50-1.0-mut, (B) sim-100-1.0-mut, (C) sim-200-1.0-mut, and Gupta et al. (Gupta et al., 2017) (D) R1.1. The horizontal dashed line indicates the threshold of 0.15 normalized Hamming distance used by the hierarchical clustering-based method
Fig. 9.
Fig. 9.
The spectral clustering-based method identifies clones with high sensitivity and specificity in repertoires with unimodal distance-to-nearest distributions. The spectral clustering-based method was applied to identify clones in simulated data from Ralph and Matsen (Ralph and Matsen, 2016). The clone sizes of the 25 largest inferred clones (y-axis) were compared with their true sizes (x-axis) in (A) sim-50-1.0-mut, (B) sim-100-1.0-mut and (C) sim-200-1.0-mut. Clones with any overlapping membership are indicated in black
Fig. 10.
Fig. 10.
The spectral clustering-based method is computationally efficient. The running times for spectral (black bars) and hierarchical (grey bars) clustering-based methods were measured for several experimental (Parameswaran et al., 2013) and simulated (Gupta et al., 2017; Ralph and Matsen, 2016) datasets spanning a wide range of sizes (total number of sequences indicated above each column). NA’s indicate datasets in which the hierarchical clustering-based method failed to converge on a threshold. Error bars indicate the SEM calculated from 20 bootstrap replicates (with replacement) from the original dataset. Evaluation was carried out on a Linux computer with a 2.20 GHz Intel processor with 32 GB RAM

Similar articles

Cited by

References

    1. Bannard O., Cyster J.G. (2017) Germinal centers: programmed for affinity maturation and antibody diversification. Curr. Opin. Immunol., 45, 21–30. - PubMed
    1. Boyd S.D., Joshi S.A. (2015) High-throughput DNA sequencing analysis of antibody repertoires In: Crowe,J. (eds) Antibodies for Infectious Diseases. American Society of Microbiology, Washington, DC, pp. 345–362.
    1. Boyd S.D. et al. (2009) Measurement and clinical monitoring of human lymphocyte clonality by massively parallel VDJ pyrosequencing. Sci. Trans. Med., 1, 12ra23–12ra23. - PMC - PubMed
    1. Briney B.S. et al. (2012) Location and length distribution of somatic hypermutation-associated dna insertions and deletions reveals regions of antibody structural plasticity. Genes Immun., 13, 523–529. - PMC - PubMed
    1. de Bourcy C.F. et al. (2017) Phylogenetic analysis of the human antibody repertoire reveals quantitative signatures of immune senescence and aging. Proc. Natl. Acad. Sci., 114, 1105–1110. - PMC - PubMed

Publication types