. 2018 Jul 1;34(13):i457-i466.
doi: 10.1093/bioinformatics/bty294.

Modeling polypharmacy side effects with graph convolutional networks

Affiliations

Modeling polypharmacy side effects with graph convolutional networks

Marinka Zitnik et al. Bioinformatics. .

Abstract

Motivation: The use of drug combinations, termed polypharmacy, is common to treat patients with complex diseases or co-existing conditions. However, a major consequence of polypharmacy is a much higher risk of adverse side effects for the patient. Polypharmacy side effects emerge because of drug-drug interactions, in which activity of one drug may change, favorably or unfavorably, if taken with another drug. The knowledge of drug interactions is often limited because these complex relationships are rare, and are usually not observed in relatively small clinical testing. Discovering polypharmacy side effects thus remains an important challenge with significant implications for patient mortality and morbidity.

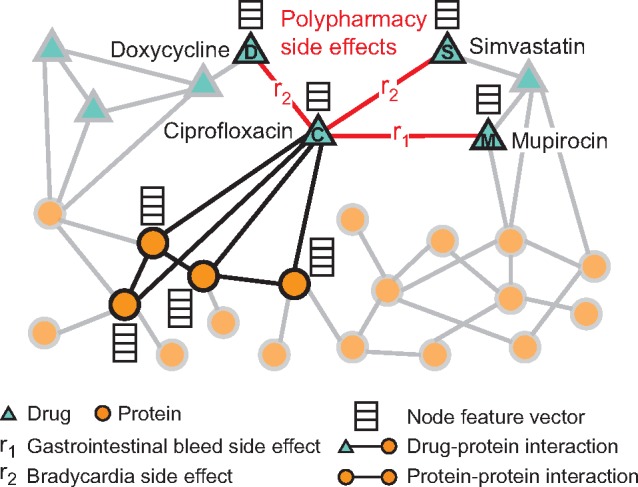
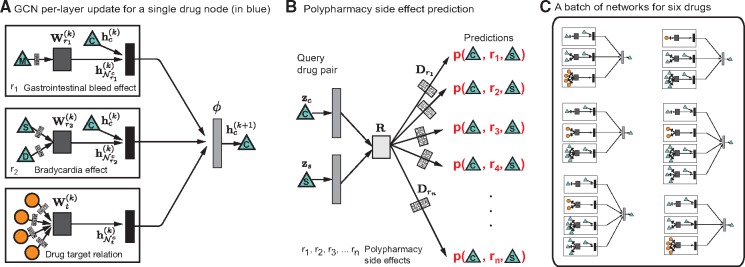
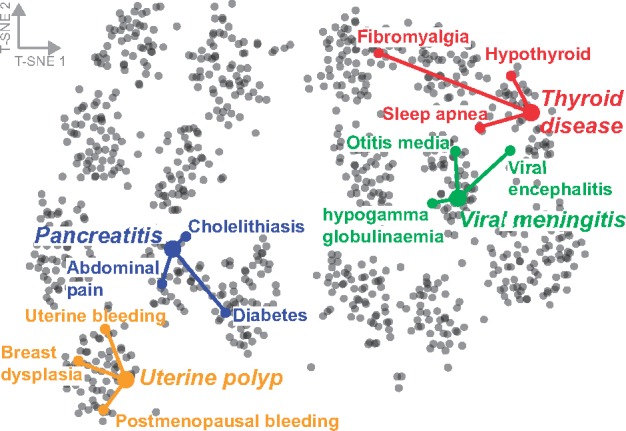
Results: Here, we present Decagon, an approach for modeling polypharmacy side effects. The approach constructs a multimodal graph of protein-protein interactions, drug-protein target interactions and the polypharmacy side effects, which are represented as drug-drug interactions, where each side effect is an edge of a different type. Decagon is developed specifically to handle such multimodal graphs with a large number of edge types. Our approach develops a new graph convolutional neural network for multirelational link prediction in multimodal networks. Unlike approaches limited to predicting simple drug-drug interaction values, Decagon can predict the exact side effect, if any, through which a given drug combination manifests clinically. Decagon accurately predicts polypharmacy side effects, outperforming baselines by up to 69%. We find that it automatically learns representations of side effects indicative of co-occurrence of polypharmacy in patients. Furthermore, Decagon models particularly well polypharmacy side effects that have a strong molecular basis, while on predominantly non-molecular side effects, it achieves good performance because of effective sharing of model parameters across edge types. Decagon opens up opportunities to use large pharmacogenomic and patient population data to flag and prioritize polypharmacy side effects for follow-up analysis via formal pharmacological studies.

Availability and implementation: Source code and preprocessed datasets are at: http://snap.stanford.edu/decagon.


Figures

Fig. 1.
Fig. 1.
An example graph of polypharmacy side effects derived from genomic and patient population data. A multimodal graph consists of protein–protein interactions, drug–protein targets and drug–drug interactions encoded by 964 different polypharmacy side effects (i.e. edge types ri, i=1,,964). Side information is integrated into the model in the form of additional protein and drug feature vectors. Highlighted network neighbors of Ciprofloxacin (node C) indicate this drug targets four proteins and interacts with three other drugs. The graph encodes information that Ciprofloxacin (node C) taken together with Doxycycline (node D) or with Simvastatin (node S) increases the risk of bradycardia side effect (side effect type r2), and its combination with Mupirocin (M) increases the risk of gastrointestinal bleed side effect r1. We use the graph representation to develop Decagon, a graph convolutional neural model of polypharmacy side effects. Decagon predicts associations between pairs of drugs and side effects (shown in red) with the goal of identifying side effects, which cannot be attributed to either individual drug in the pair
Fig. 2.
Fig. 2.
Jaccard similarity between target proteins for random pairs of drugs, all drug combinations and drug combinations associated with specific side effects. Drug pairs are stratified into three groups depending on whether drug i and j in a given pair (i, j) do not share any target proteins, share fewer than 50% target proteins, or share >50% target proteins (i.e. Jaccard(Ti,Tj)=0,0<Jaccard(Ti,Tj)<0.5 and 0.5Jaccard(Ti,Tj)1, respectively; Ti is a set of i’s target proteins). We observe that drugs in most drug pairs, especially in random drug pairs (i.e. drugs not commonly co-prescribed, dark grey) have zero shared target proteins
Fig. 3.
Fig. 3.
Overview of Decagon model architecture. (A) An Decagon encoder. Shown is a per-layer update for a single graph node (a drug node representing Ciprofloxacin based on the small example input graph in Fig. 1). Hidden state activations from neighboring nodes Nrc are gathered and then transformed for each relation type r individually (i.e. gastrointestinal bleed, bradycardia and drug target relation). The resulting representation is accumulated in a (normalized) sum and passed through a non-linear activation function (i.e. ReLU) to produce hidden state of node vc in the (k+1)-th layer, hc(k+1). This per-node update is computed in parallel with shared parameters across the whole graph. (B) For every relation, Decagon decoder takes pairs of embeddings (e.g. hidden node representations zc and zs representing Ciprofloxacin and Simvastatin) and produces a score for every (potential) edge in the graph. Shown is the decoder for poypharmacy side effects relation types. (C) A batch of neural networks that compute embeddings of six drug nodes in the input graph. In Decagon, neural networks differ from node to node but they all share the same set of relation-specific trainable parameters [i.e. the parameters of the encoder and decoder; see Equations (1) and (2)]. That is, rectangles with the same shading patterns share parameters, and thin rectangles with black and white shading pattern denote densely connected neural layers
Fig. 4.
Fig. 4.
Visualization of side effects in Decagon. The side effects are mapped to the 2D space using the t-SNE package (Maaten and Hinton, 2008) with learned side effect representations [Dr,r=1,2,,964, see Equation (2)] as input. Selected side effects are uterine polyp, pancreatitis, viral meningitis and thyroid disease. For each selected side effect, we highlight three side effects that most often co-occur with the selected side effect in the drug combination dataset

References

    1. Banakh I. et al. (2017) Severe rhabdomyolysis due to presumed drug interactions between atorvastatin with amlodipine and ticagrelor. Case Rep. Crit. Care, 2017, 1. - PMC - PubMed
    1. Bansal M. et al. (2014) A community computational challenge to predict the activity of pairs of compounds. Nat. Biotechnol., 32, 1213–1222. - PMC - PubMed
    1. Bicker J. et al. (2017) Elucidation of the impact of p-glycoprotein and breast cancer resistance protein on the brain distribution of catechol-o-methyltransferase inhibitors. Drug Metab. Dispos., 45, 1282–1291. - PubMed
    1. Campillos M. et al. (2008) Drug target identification using side-effect similarity. Science, 321, 263–266. - PubMed
    1. Chatr-Aryamontri A. et al. (2015) The BioGRID interaction database: 2015 update. Nucleic Acids Res., 43, D470–D478. - PMC - PubMed

Publication types