

MicroPheno: predicting environments and host phenotypes from 16S rRNA gene sequencing using a k-mer based representation of shallow sub-samples
- PMID: 29950008
- PMCID: PMC6022683
- DOI: 10.1093/bioinformatics/bty296
MicroPheno: predicting environments and host phenotypes from 16S rRNA gene sequencing using a k-mer based representation of shallow sub-samples
Erratum in
-
MicroPheno: predicting environments and host phenotypes from 16S rRNA gene sequencing using a k-mer based representation of shallow sub-samples.Bioinformatics. 2019 Mar 15;35(6):1082. doi: 10.1093/bioinformatics/bty652. Bioinformatics. 2019. PMID: 30099528 Free PMC article. No abstract available.
Abstract
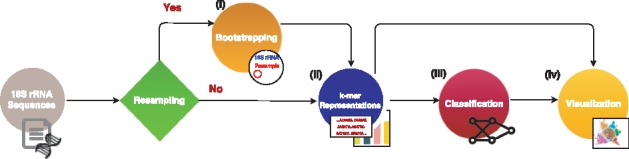
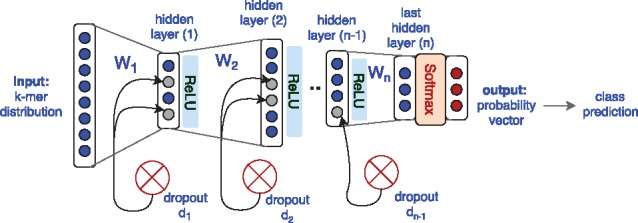
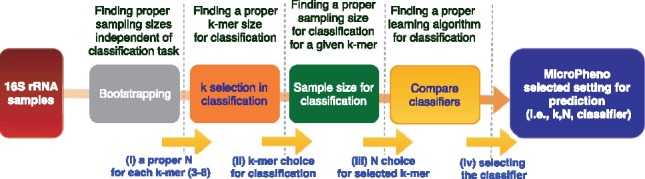
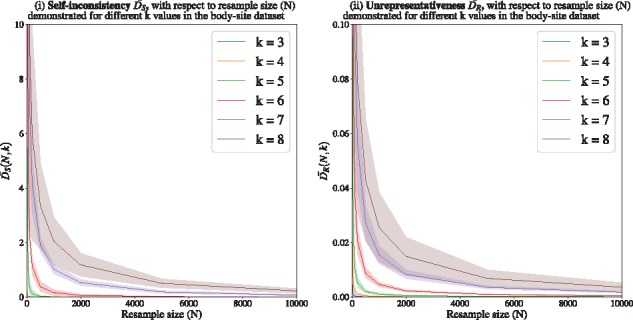
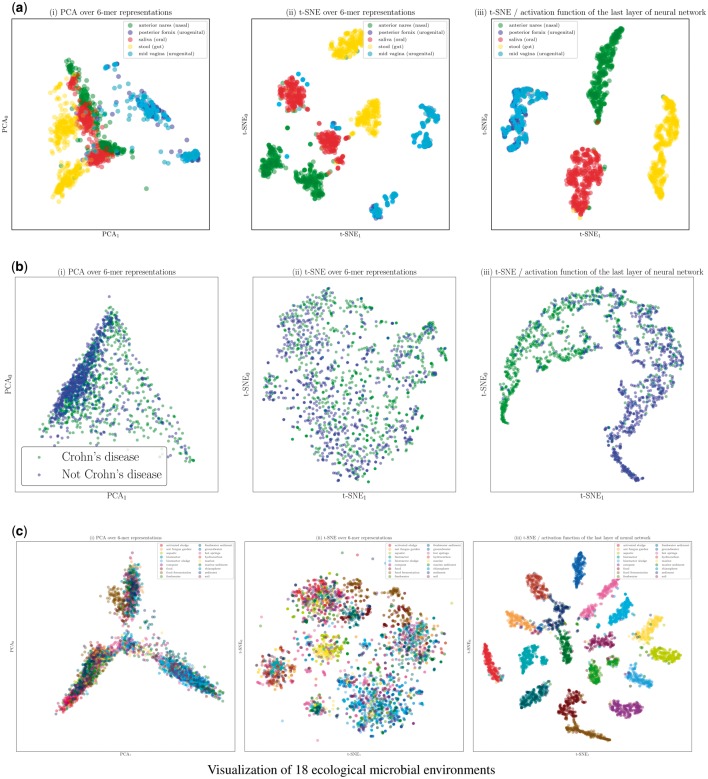
Motivation: Microbial communities play important roles in the function and maintenance of various biosystems, ranging from the human body to the environment. A major challenge in microbiome research is the classification of microbial communities of different environments or host phenotypes. The most common and cost-effective approach for such studies to date is 16S rRNA gene sequencing. Recent falls in sequencing costs have increased the demand for simple, efficient and accurate methods for rapid detection or diagnosis with proved applications in medicine, agriculture and forensic science. We describe a reference- and alignment-free approach for predicting environments and host phenotypes from 16S rRNA gene sequencing based on k-mer representations that benefits from a bootstrapping framework for investigating the sufficiency of shallow sub-samples. Deep learning methods as well as classical approaches were explored for predicting environments and host phenotypes.
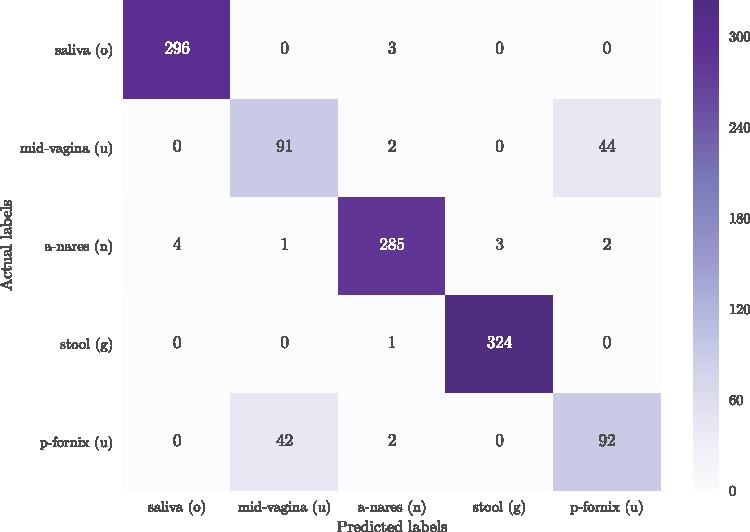
Results: A k-mer distribution of shallow sub-samples outperformed Operational Taxonomic Unit (OTU) features in the tasks of body-site identification and Crohn's disease prediction. Aside from being more accurate, using k-mer features in shallow sub-samples allows (i) skipping computationally costly sequence alignments required in OTU-picking and (ii) provided a proof of concept for the sufficiency of shallow and short-length 16S rRNA sequencing for phenotype prediction. In addition, k-mer features predicted representative 16S rRNA gene sequences of 18 ecological environments, and 5 organismal environments with high macro-F1 scores of 0.88 and 0.87. For large datasets, deep learning outperformed classical methods such as Random Forest and Support Vector Machine.
Availability and implementation: The software and datasets are available at https://llp.berkeley.edu/micropheno.
Supplementary information: Supplementary data are available at Bioinformatics online.
Figures
References
-
- Ann Moran M. (2015) The global ocean microbiome. Science, 350, doi:10.1126/science.aac8455. - PubMed
-
- Armbrust E.V. et al. (2015) Structure and function of the global ocean microbiome. Science, 348, 865. - PubMed
-
- Arrieta M.-C. et al. (2015) Early infancy microbial and metabolic alterations affect risk of childhood asthma. Sci. Transl. Med., 7, doi: 10.1126/scitranslmed.aab2271. - PubMed
-
- Bengio Y. et al. (2013) Representation learning: a review and new perspectives. IEEE Trans. Pattern Anal. Mach. Intell., 35, 1798. - PubMed
MeSH terms
Substances
LinkOut - more resources
Full Text Sources
Other Literature Sources
Miscellaneous
