. 2018;14(8):1310-1322.
doi: 10.1080/15548627.2018.1474992. Epub 2018 Jul 26.

Transcription factor NFE2L2/NRF2 modulates chaperone-mediated autophagy through the regulation of LAMP2A

Affiliations

Transcription factor NFE2L2/NRF2 modulates chaperone-mediated autophagy through the regulation of LAMP2A

Marta Pajares et al. Autophagy. 2018.

Abstract

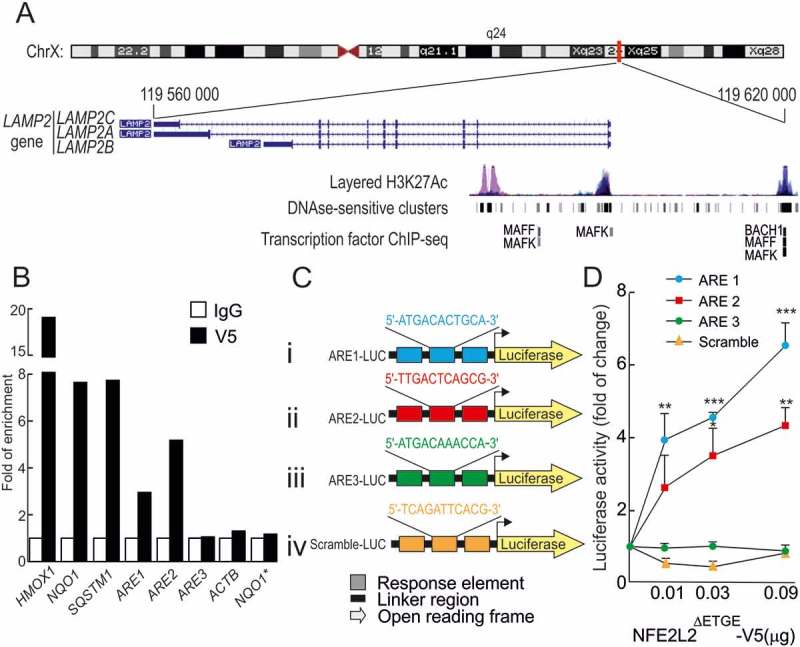
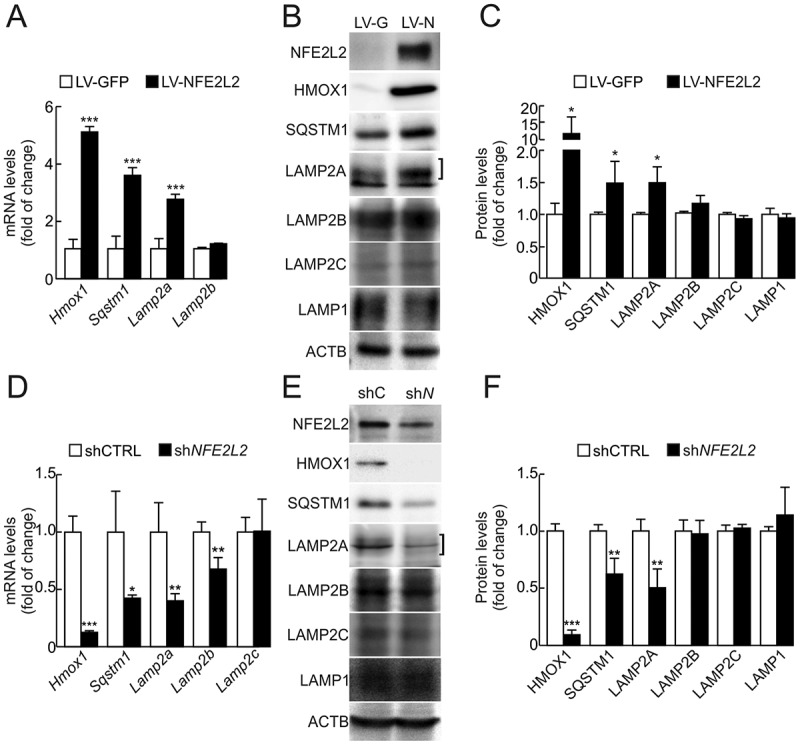
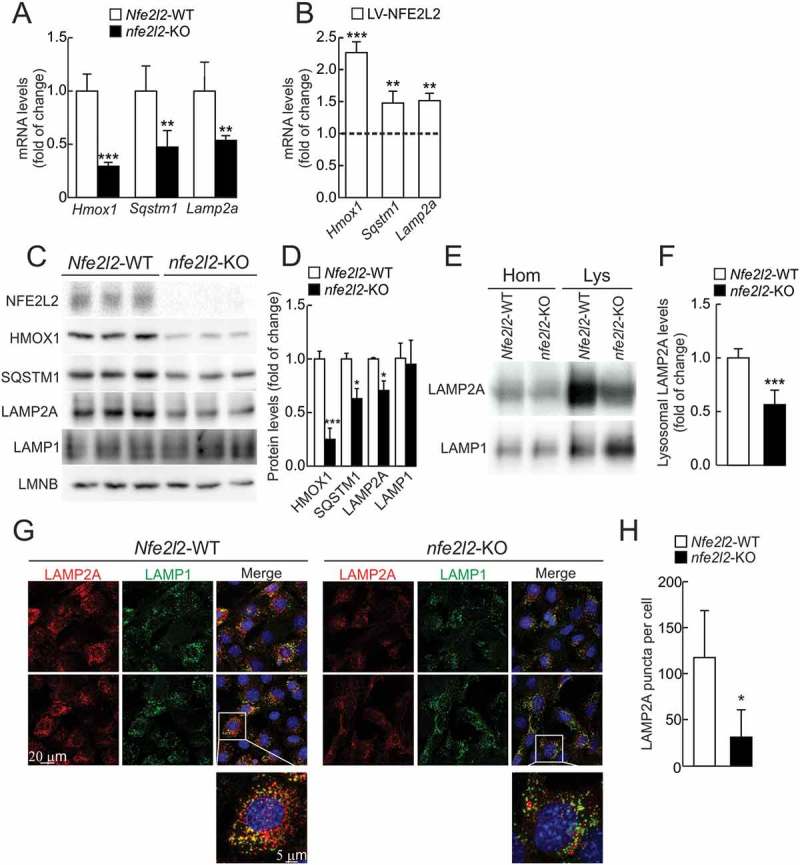
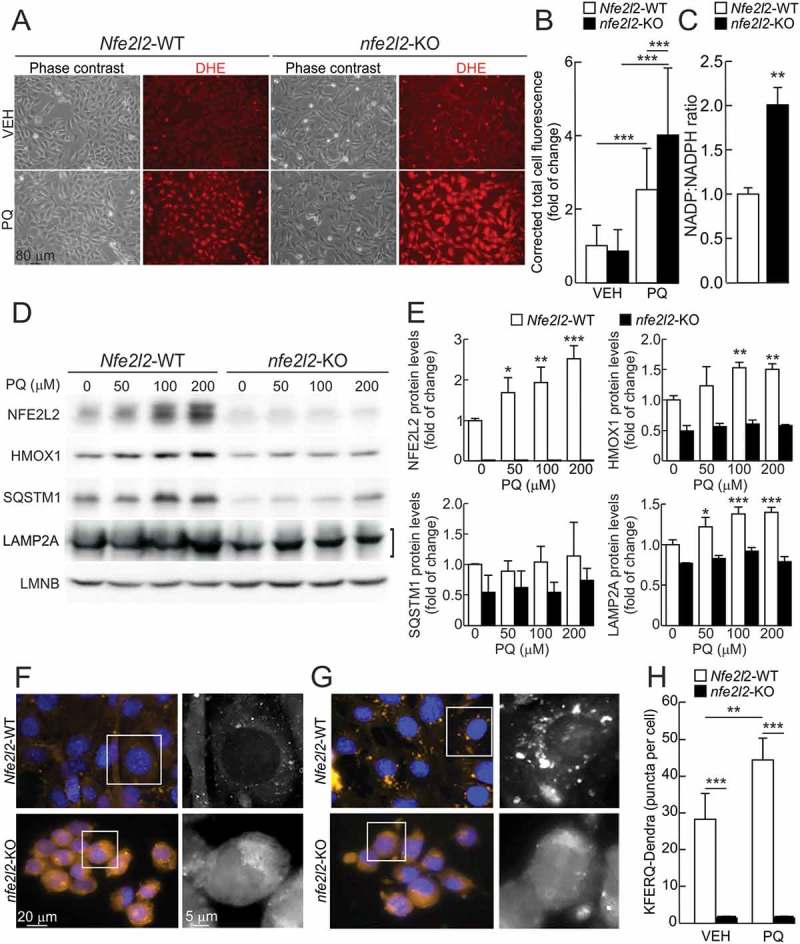
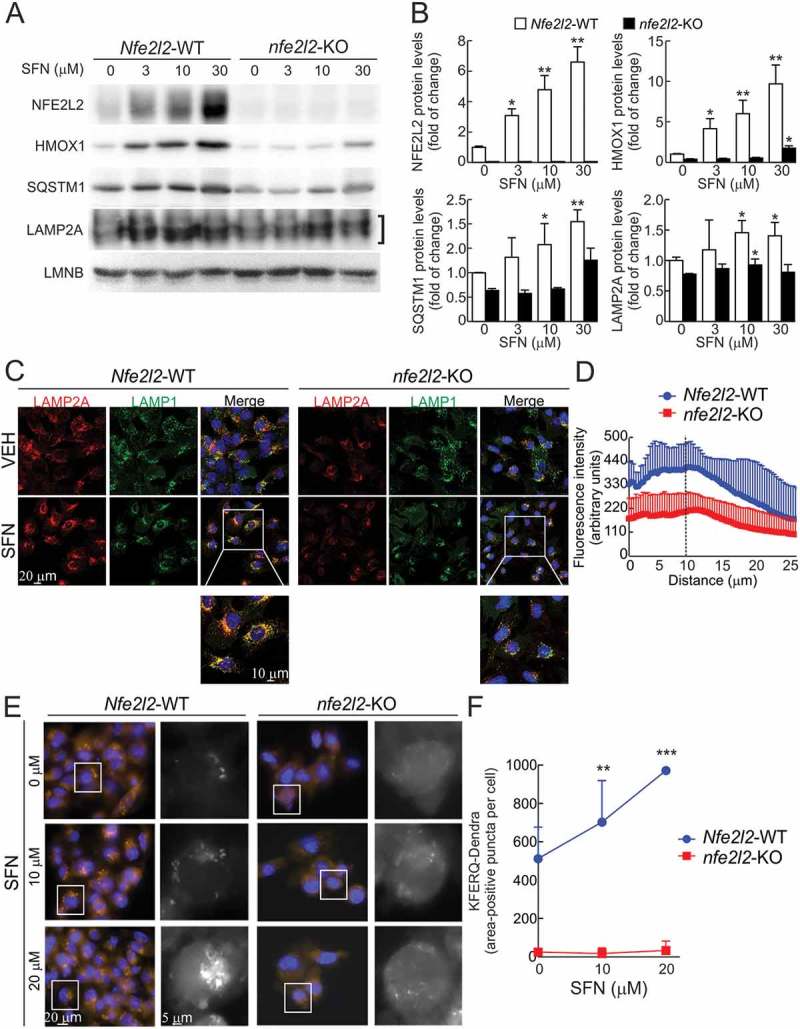
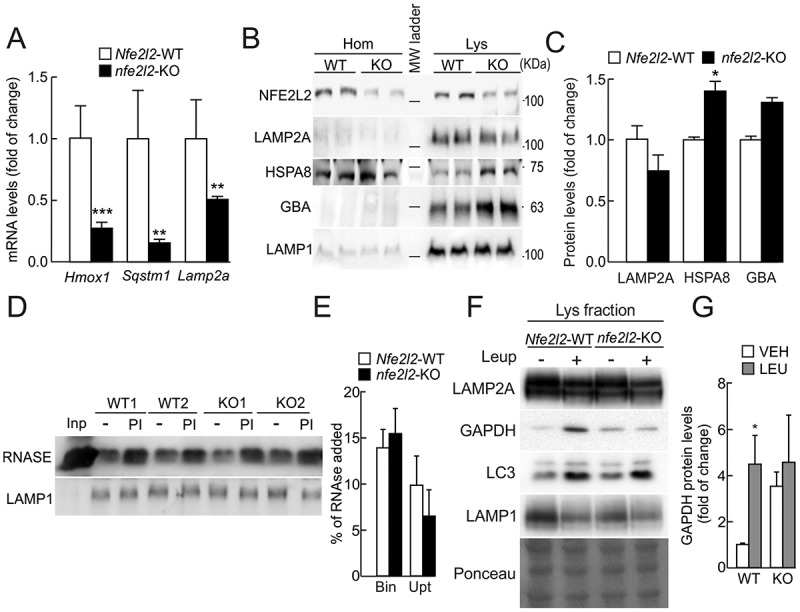
Chaperone-mediated autophagy (CMA) is a selective degradative process for cytosolic proteins that contributes to the maintenance of proteostasis. The signaling mechanisms that control CMA are not fully understood but might involve response to stress conditions including oxidative stress. Considering the role of CMA in redoxtasis and proteostasis, we sought to determine if the transcription factor NFE2L2/NRF2 (nuclear factor, erythroid derived 2, like 2) has an impact on CMA modulation. In this work, we identified and validated 2 NFE2L2 binding sequences in the LAMP2 gene and demonstrated in several human and mouse cell types that NFE2L2 deficiency and overexpression was linked to reduced and increased LAMP2A levels, respectively. Accordingly, lysosomal LAMP2A levels were drastically reduced in nfe2l2-knockout hepatocytes, which also displayed a marked decrease in CMA activity. Oxidant challenge with paraquat or hydrogen peroxide, or pharmacological activation of NFE2L2 with sulforaphane or dimethyl fumarate also increased LAMP2A levels and CMA activity. Overall, our study identifies for the first time basal and inducible regulation of LAMP2A, and consequently CMA activity, by NFE2L2.

Abbreviations: ACTB: actin, beta, ARE: antioxidant response element; ATG5: autophagy related 5; BACH1: BTB domain and CNC homolog 1; ChIP: chromatin immunoprecipitation; CMA: chaperone-mediated autophagy; DHE: dihydroethidium; DMF: dimethyl fumarate; ENCODE: Encyclopedia of DNA elements at the University of California, Santa Cruz; GAPDH: glyceraldehyde-3-phosphate dehydrogenase; GBA: glucosylceramidase beta; GFP: green fluorescent protein; HMOX1: heme oxygenase 1; H2O2: hydrogen peroxide; HSPA8/HSC70: heat shock protein family A (Hsp70) member 8; KEAP1: kelch like ECH associated protein 1; LAMP2A: lysosomal associated membrane protein 2A; LAMP2B: lysosomal associated membrane protein 2B; LAMP2C: lysosomal associated membrane protein 2C; LAMP1: lysosomal associated membrane protein 1; MAFF: MAF bZIP transcription factor F; MAFK: MAF bZIP transcription factor K; NFE2L2/NRF2: nuclear factor, erythroid derived 2, like 2; NQO1: NAD(P)H quinone dehydrogenase 1; PQ: paraquat; PI: protease inhibitors; qRT-PCR: quantitative real-time polymerase chain reaction; RNASE: ribonuclease A family member; SFN: sulforaphane; SQSTM1/p62: sequestosome 1; TBP: TATA-box binding protein.

Keywords: LAMP2A; NRF2; proteostasis.


Figures

Figure 1.
Figure 1.
NFE2L2 binds to 2 functional antioxidant response elements (AREs) in the LAMP2 gene. (a) Scheme of the LAMP2 gene showing the 3 splice variants: LAMP2A, LAMP2B and LAMP2C, from The Encyclopedia of DNA Elements at UCSC (ENCODE) for human genome. Putative AREs in the LAMP2 gene were identified taking as reference the available information from ChIP of ARE-binding factors MAFK, MAFF and BACH1. These regions were localized in 200–400 base-pair-long DNAse-sensitive and H3K27Ac-rich regions, i.e. most likely regulatory promoter regions. (b) HEK293T cells were transfected with an expression vector for NFE2L2ΔETGE-V5 (lacking the KEAP1 regulatory domain). ChIP analysis was performed with anti-IgG or anti-V5 antibodies and the potential AREs with the highest score, termed ARE1, ARE2 and ARE3 (Table 1), were analyzed by qRT-PCR. The figure shows representative data normalized as the fold of enrichment with the anti-V5 antibody vs. the IgG antibody. The presence of already known AREs in HMOX1, NQO1 and SQSTM1 was analyzed as positive control and ACTB, and a region of NQO1 that does not contain an ARE (NQO1*) were amplified as negative controls. (c), Luciferase reporter constructs carrying 3 tandem putative ARE sequences from the LAMP2 gene (i-iii) or a scramble sequence as negative control (iv) controlling the expression of luciferase. (d) nfe2l2-KO mouse embryo fibroblasts were co-transfected with the reporters in C and increasing amounts of NFE2L2ΔETGE-V5 construct. Values were normalized to pTK-Renilla activity and presented as fold of change. Data are mean ± SD (n = 3). Statistical analysis was performed using Student’s t test. *< 0.05, ** < 0.01 and *** p < 0.001 vs. basal levels.
Figure 2.
Figure 2.
LAMP2A levels are modified upon genetic manipulation of NFE2L2. (a) HEK293T cells were transduced with GFP- or NFE2L2ΔETGE-V5-expressing lentivirus (LV-GFP or LV-NFE2L2, respectively). Expression levels of Hmox1, Sqstm1, Lamp2a, Lamp2b and Lamp2c were determined 3 days post-infection by qRT-PCR and normalized by Actb levels. Lamp2c levels were barely detectable in this cell type (data not shown). Data are mean ± SD (n = 4). Statistical analysis was performed with Student’s t test. ***p < 0.001 vs. LV-GFP-infected cells. (b) Representative immunoblots for the indicated proteins in cell lysates from cells transduced as in A. The bracket indicates the band corresponding to LAMP2A. (c) Densitometric quantification of representative immunoblots from B relative to ACTB protein levels. Data are mean ± SD (n = 4). Statistical analysis was performed using Student’s t test. *p < 0.05 vs. LV-GFP-infected cells. (d) A549 cells were transduced with lentivirus carrying shRNA against a scramble sequence (shCTRL) or against NFE2L2 (shNFE2L2). Expression levels of Hmox1, Sqstm1, Lamp2a, Lamp2b and Lamp2c were determined 3 days post-infection by qRT-PCR and normalized to Actb levels. Data are mean ± SD (n = 4). Statistical analysis was performed with Student’s t test. *p < 0.05, **p < 0.01 and ***p < 0.001 vs. shCTRL infected cells. (e) Representative immunoblots for the indicated proteins in cell lysates from cells transduced as in D. (f) Densitometric quantification of representative immunoblots from E relative to ACTB protein levels. Data are mean ± SD (n = 4). Statistical analysis was performed using Student’s t test. **p < 0.01 and ***p < 0.001 vs. shCTRL infected cells.
Figure 3.
Figure 3.
LAMP2A levels are reduced in the absence of NFE2L2. (a) Expression levels of Hmox1, Sqstm1 and Lamp2a from Nfe2l2-WT and nfe2l2-KO immortalized hepatocytes were determined by qRT-PCR and normalized to Actb levels. Data are mean ± SD (n = 4). Statistical analysis was performed with Student’s t test. **p < 0.01 and ***p < 0.001 vs. Nfe2l2-WT cells. (b) nfe2l2-KO immortalized hepatocytes were rescued with an NFE2L2ΔETGE-V5-expressing lentivirus (LV-NFE2L2). Expression levels of Hmox1, Sqstm1 and Lamp2a was analyzed 3 days post-infection by qRT-PCR and normalized to Tbp levels. The dotted line represents expression levels of nfe2l2-KO hepatocytes transduced with a control lentivirus (LV-GFP). Data are mean ± SD (n = 4). Statistical analysis was performed with Student’s t test. **p < 0.01 and ***p < 0.001 vs. LV-CTRL infected cells. (c) Representative immunoblots for the indicated proteins in cell lysates from Nfe2l2-WT and nfe2l2-KO immortalized hepatocytes. (d) Densitometric quantification of representative immunoblots from C relative to LMNB (lamin B) protein levels. Data are mean ± SD (n = 3). Statistical analysis was performed using Student’s t test. **p < 0.01 and ***p < 0.001 vs. Nfe2l2-WT cells. (e) Representative immunoblots of LAMP2A and LAMP1 in homogenates (Hom) and isolated lysosomes (Lys) from Nfe2l2-WT and nfe2l2-KO immortalized hepatocytes. (f) Densitometric quantification of representative immunoblots from E relative to LAMP1 levels. Data are mean ± SD (n = 6). Statistical analysis was performed using Student’s t test. ***p < 0.001 vs. Nfe2l2-WT levels. (g) Confocal analysis of double immunofluorescence with anti-LAMP2A (red) and anti-LAMP1 (green) antibodies in immortalized Nfe2l2-WT and nfe2l2-KO hepatocytes. The insert shows a higher magnification of the indicated cell. (h) Quantification of the total number of LAMP2A-positive puncta per cell. Values are mean ± SD (n = 3, with > 50 cells counted per experiment). Statistical analysis was performed using Student’s t test. *p < 0.05 vs. Nfe2l2-WT cells.
Figure 4.
Figure 4.
The oxidant agent paraquat (PQ) induces LAMP2A expression and CMA activity in an NFE2L2-dependent manner. (a) Representative images of ROS levels determined with the dihydroethidium probe (DHE) in immortalized Nfe2l2-WT and nfe2l2-KO hepatocytes in basal conditions or after treatment with 200 µM PQ for 16 h. The probe was added to a final concentration of 5 µM in the culture medium 1 h before in vivo imaging of the cells. (b) Corrected total cell fluorescence of representative images from A. Values are mean ± SD (n = 100 cells, derived from at least 3 different fields). Statistical analysis was performed using Student t test. ***p < 0.001 vs. untreated conditions. (c) NADP:NADPH ratio in immortalized Nfe2l2-WT and nfe2l2-KO hepatocytes. Data are mean ± SD (n = 4). Statistical analysis was performed using Student’s t test. **p < 0.01 vs. Nfe2l2-WT cells. (d) Immortalized hepatocytes from Nfe2l2-WT and nfe2l2-KO mice were submitted to the indicated concentrations of PQ for 16 h. Representative immunoblots for the indicated proteins in cell lysates. Note that anti-NFE2L2 antibody recognizes a nonspecific band in nfe2l2-KO cells. (e) Densitometric quantification of representative immunoblots from D relative to LMNB protein levels. Data are mean ± SD (n = 3). Statistical analysis was performed using Student’s t test. *p < 0.05, **p < 0.01 and ***p < 0.001 vs. untreated conditions. (f and g) Nfe2l2-WT and nfe2l2-KO hepatocytes were transduced with lentivirus carrying the CMA reporter KFERQ-PS-Dendra and, after photoswitching, were cultured without additions (f) or in the presence of 100 µM paraquat (PQ) (g) for 16 h. CMA was analyzed as the number of fluorescent puncta per cell at the end of the incubation time. Representative full-field images and insert showing black and white high magnification of the boxed regions in the Dendra channel. (h) Quantification of the number of puncta per cell after the indicated treatment. Values are mean ± SD (n = 3, with > 75 cells per experiment). Statistical analysis was performed using Student’s t test. **p < 0.01 and ***p < 0.001 vs. Nfe2l2-WT cells or untreated conditions.
Figure 5.
Figure 5.
Pharmacological activation of NFE2L2 induces LAMP2A levels and CMA activation. (a) Immortalized hepatocytes from Nfe2l2-WT and nfe2l2-KO mice were submitted to the indicated concentrations of sulforaphane (SFN) for 16 h. Representative immunoblots for the indicated proteins in cell lysates. Note that anti-NFE2L2 antibody recognizes a nonspecific band in nfe2l2-KO cells. (b) Densitometric quantification of representative immunoblots from A relative to LMNB protein levels. Data are mean ± SD (n = 3). Statistical analysis was performed using Student’s t test. *p < 0.05, **p < 0.01 and ***p < 0.001 vs. untreated conditions. (c) Confocal analysis of double immunofluorescence with anti-LAMP2A (red) and anti-LAMP1 (green) antibodies in immortalized Nfe2l2-WT and nfe2l2-KO hepatocytes treated with vehicle (VEH) or 15 µM SFN for 16 h. The insert shows a higher magnification of the indicated cells. (d) Radial profile of LAMP2A fluorescence in cells treated with SFN in A. The graph shows the total mean fluorescence as a function of radial distance to the center of the cell. The dashed line represents the nuclear limits. Values are mean ± SD (n = 3, with > 50 cells counted per experiment). (e) Nfe2l2-WT and nfe2l2-KO hepatocytes were transduced with lentivirus carrying the CMA reporter KFERQ-PS-Dendra and, after photoswitching, were cultured without additions or in the presence of 10 µM or 20 µM SFN for 16 h. CMA was analyzed as the number of fluorescent puncta per cell at the end of the incubation time. Representative full-field images and insert showing black and white high magnification of the boxed regions in the Dendra channel. (f) Quantification of the KFERQ-Dendra-positive area per cell. Values are mean ± SD (n = 3, with > 75 cells per experiment). Statistical analysis was performed using Student t test. **p < 0.01 and ***p < 0.001 vs. untreated conditions.
Figure 6.
Figure 6.
Role of NFE2L2 in the modulation of CMA in vivo. (a) Expression levels of Hmox1, Sqstm1 and Lamp2a in livers from Nfe2l2-WT and nfe2l2-KO mice were determined by qRT-PCR and normalized by the geometric mean between Actb and Tbp levels. Data are mean ± SEM (n = 4). Statistical analysis was performed using Student’s t test. **p < 0.01 and ***p < 0.001 vs. Nfe2l2-WT mice. (b) Immunoblots for the indicated proteins in homogenates and isolated lysosomes from livers of Nfe2l2-WT or nfe2l2-KO mice. Note that anti-NFE2L2 antibody recognizes a nonspecific band in nfe2l2-KO cells. (c) Densitometric quantification of lysosomal proteins in B relative to LAMP1 levels. Data are mean ± SD (n = 3 livers per mouse genotype). Statistical analysis was performed using Student’s t test. *p < 0.05 vs. Nfe2l2-WT mice. (d) Lysosomes isolated from livers of Nfe2l2-WT or nfe2l2-KO mice were pretreated or not with protease inhibitors (PI) to inhibit lysosomal proteolysis and incubated with purified RNASE for 20 min at 37ºC. At the end of the incubation, lysosomes were recovered by centrifugation and subjected to SDS-PAGE and immunoblot for the indicated proteins. LAMP1 is shown as control of similar lysosomal recovery after the incubation. (e) Densitometric quantification of RNASE binding (Bin) and uptake (Upt) in Nfe2l2-WT or nfe2l2-KO isolated lysosomes. Data are mean ± SD (n = 3 livers per mouse genotype). Statistical analysis was performed using Student’s t test. (f) Nfe2l2-WT and nfe2l2-KO mice were starved for 24 h. Lysosomal proteolysis was inhibited in vivo with 2 intraperitoneal injections of leupeptin (2 mg/100g body weight) 16 and 2 h before sacrifice. Representative immunoblots of the indicated endogenous proteins in lysosomal-enriched fractions from livers of Nfe2l2-WT (WT) and nfe2l2-KO (KO) mice. (g) Densitometric quantification of representative immunoblots from F relative to total protein levels stained with Ponceau Red. Data are mean ± SD (n = 3). Statistical analysis was performed using Student’s t test. *p < 0.05 vs. Nfe2l2-WT vehicle-treated mice.

References

    1. Chiang HL, Terlecky SR, Plant CP, et al. A role for a 70-kilodalton heat shock protein in lysosomal degradation of intracellular proteins. Science. 1989. October 20;246(4928):382–385. PubMed PMID: 2799391. - PubMed
    1. Chiang HL, Dice JF.. Peptide sequences that target proteins for enhanced degradation during serum withdrawal. J Biol Chem. 1988. May 15;263(14):6797–6805. PubMed PMID: 3360807. - PubMed
    1. Terlecky SR, Dice JF.. Polypeptide import and degradation by isolated lysosomes. J Biol Chem. 1993. November 05;268(31):23490–23495. PubMed PMID: 8226876. - PubMed
    1. Cuervo AM, Dice JF. A receptor for the selective uptake and degradation of proteins by lysosomes. Science. 1996. July 26;273(5274):501–503. PubMed PMID: 8662539. - PubMed
    1. Bandyopadhyay U, Kaushik S, Varticovski L, et al. The chaperone-mediated autophagy receptor organizes in dynamic protein complexes at the lysosomal membrane. Mol Cell Biol. 2008. September;28(18):5747–5763. PubMed PMID: 18644871; PubMed Central PMCID: PMCPMC2546938. - PMC - PubMed

Publication types