

Sex differences in body composition and association with cardiometabolic risk
- PMID: 29950175
- PMCID: PMC6022328
- DOI: 10.1186/s13293-018-0189-3
Sex differences in body composition and association with cardiometabolic risk
Abstract
Background: Body composition differs between men and women, with women having proportionally more fat mass and men more muscle mass. Although men and women are both susceptible to obesity, health consequences differ between the sexes. The purpose of our study was to assess sex differences in body composition using anatomic and functional imaging techniques, and its relationship to cardiometabolic risk markers in subjects with overweight/obesity.
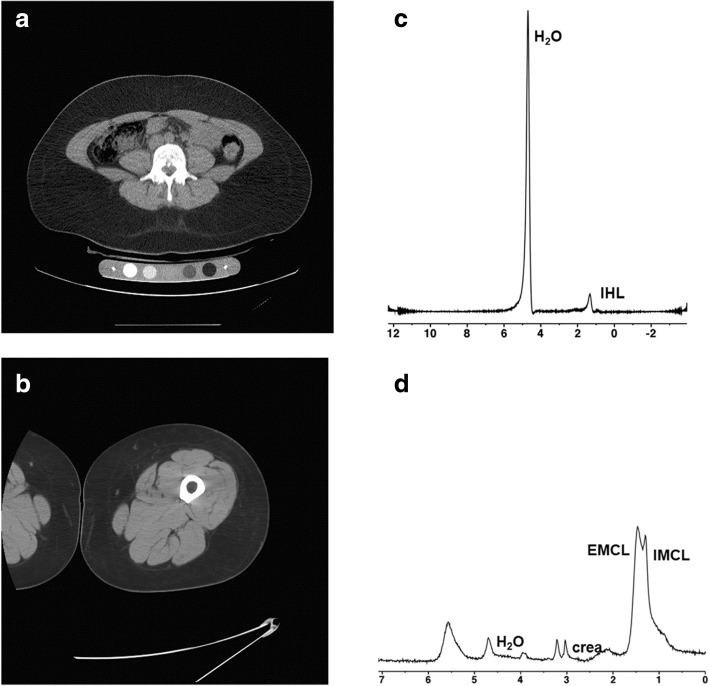
Methods: After written informed consent, we prospectively recruited 208 subjects with overweight/obesity who were otherwise healthy (94 men, 114 women, age 37 ± 10 years, BMI 35 ± 6 kg/m2). Subjects underwent dual-energy X-ray absorptiometry (DXA) and computed tomography (CT) for fat and muscle mass, proton MR spectroscopy (1H-MRS) for intrahepatic (IHL) and intramyocellular lipids (IMCL), an oral glucose tolerance test, serum insulin, lipids, and inflammatory markers. Men and women were compared by Wilcoxon signed rank test. Linear correlation and multivariate analyses between body composition and cardiometabolic risk markers were performed.
Results: Women and men were of similar mean age and BMI (p ≥ 0.2). Women had higher %fat mass, extremity fat, and lower lean mass compared to men (p ≤ 0.0005). However, men had higher visceral adipose tissue (VAT) and IMCL and higher age-and BMI-adjusted IHL (p < 0.05). At similar age and BMI, men had a more detrimental cardiometabolic risk profile compared to women (p < 0.01). However, VAT in women, and IMCL in men, were more strongly associated with cardiometabolic risk markers, while more lower extremity fat was associated with a more favorable cardiometabolic profile in women compared to men (p ≤ 0.03).
Conclusions: Although the male pattern of fat distribution is associated with a more detrimental cardiometabolic risk profile compared to women of similar age and BMI, VAT is more strongly associated with cardiometabolic risk markers in women, while IMCL are more detrimental in men. Lower extremity fat is relatively protective, in women more than in men. This suggests that detailed anatomic and functional imaging, rather than BMI, provides a more complete understanding of metabolic risk associated with sex differences in fat distribution.
Keywords: Body composition; Computed tomography; Magnetic resonance spectroscopy; Metabolic syndrome; Obesity; Sex characteristics.
Conflict of interest statement
Ethics approval and consent to participate
The study was approved by Partners IRB (protocol 2012P002276 and 2012P002410), and written informed consent was obtained from all subjects.
Consent for publication
N/A
Competing interests
The authors declare that they have no competing interests.
Publisher’s Note
Springer Nature remains neutral with regard to jurisdictional claims in published maps and institutional affiliations.
Figures

References
Publication types
MeSH terms
Grants and funding
- P30 DK040561/DK/NIDDK NIH HHS/United States
- K24 HL092902/HL/NHLBI NIH HHS/United States
- R01 DK095792/DK/NIDDK NIH HHS/United States
- K24 DK-109940/DK/NIDDK NIH HHS/United States
- K23 DK113220/DK/NIDDK NIH HHS/United States
- M01 RR001066/RR/NCRR NIH HHS/United States
- R01 HL-077674/NH/NIH HHS/United States
- K23 RR-23090/NH/NIH HHS/United States
- K24 DK109940/DK/NIDDK NIH HHS/United States
- R01 DK-095792/NH/NIH HHS/United States
- UL1 RR025758/RR/NCRR NIH HHS/United States
- K23 DK115903/DK/NIDDK NIH HHS/United States
- M01 RR01066/NH/NIH HHS/United States
- P30DK040561/NH/NIH HHS/United States
- R01 HL077674/HL/NHLBI NIH HHS/United States
- UL1 RR025758/NH/NIH HHS/United States
- K23 RR023090/RR/NCRR NIH HHS/United States
- K24 HL092902/NH/NIH HHS/United States
LinkOut - more resources
Full Text Sources
Other Literature Sources
Medical
