

Disrupting LXRα phosphorylation promotes FoxM1 expression and modulates atherosclerosis by inducing macrophage proliferation
- PMID: 29950315
- PMCID: PMC6048484
- DOI: 10.1073/pnas.1721245115
Disrupting LXRα phosphorylation promotes FoxM1 expression and modulates atherosclerosis by inducing macrophage proliferation
Abstract
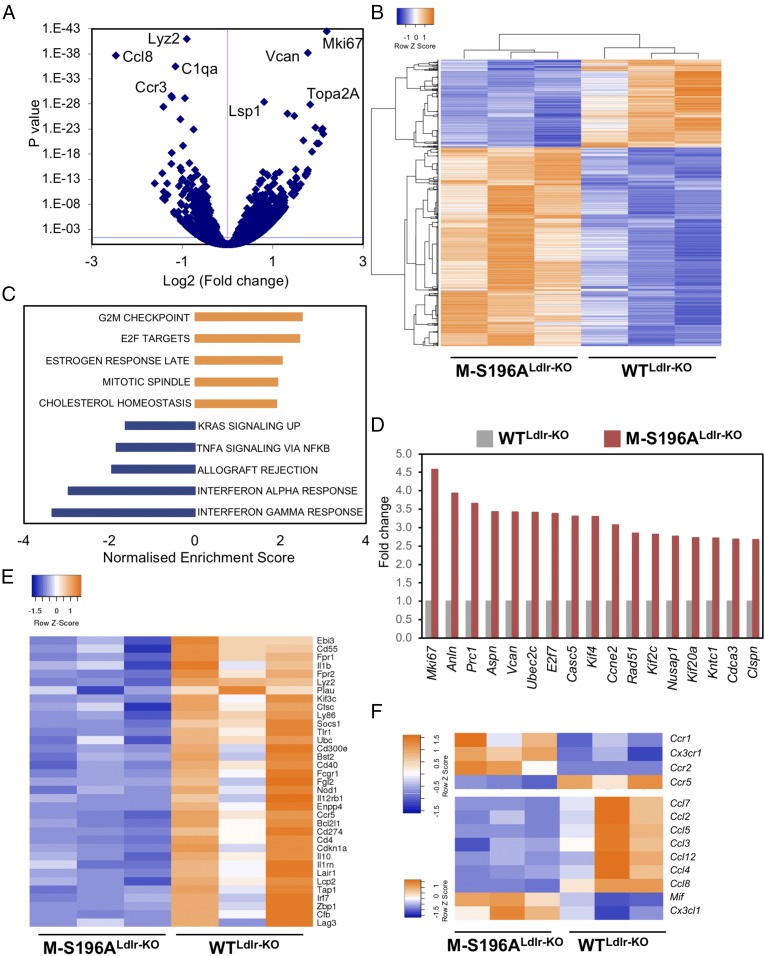
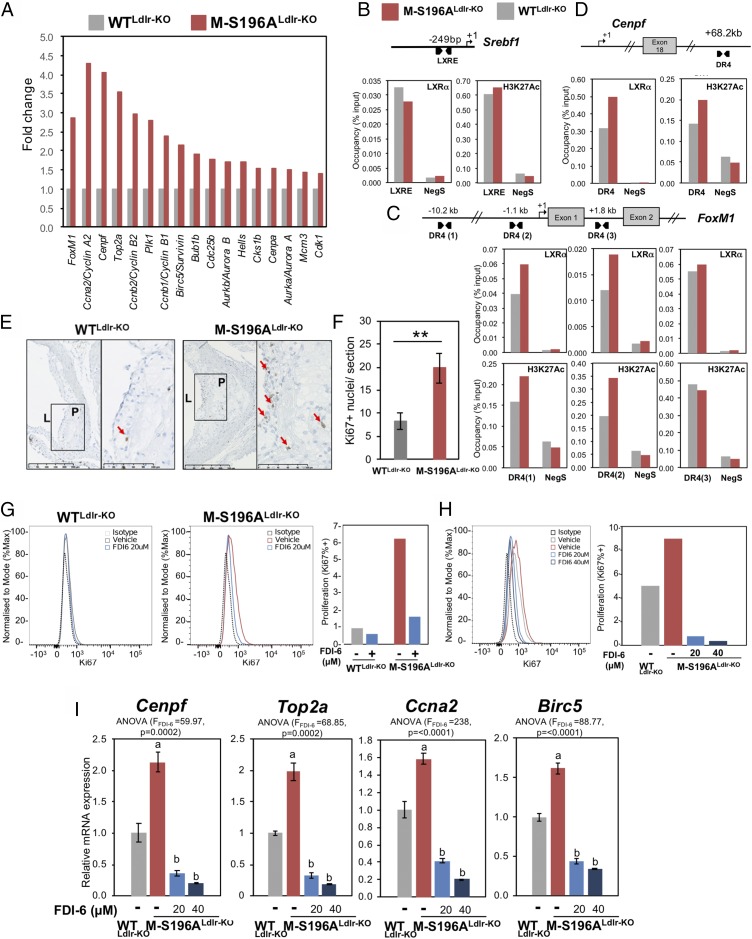
Macrophages are key immune cells for the initiation and development of atherosclerotic lesions. However, the macrophage regulatory nodes that determine how lesions progress in response to dietary challenges are not fully understood. Liver X receptors (LXRs) are sterol-regulated transcription factors that play a central role in atherosclerosis by integrating cholesterol homeostasis and immunity. LXR pharmacological activation elicits a robust antiatherosclerotic transcriptional program in macrophages that can be affected by LXRα S196 phosphorylation in vitro. To investigate the impact of these transcriptional changes in atherosclerosis development, we have generated mice carrying a Ser-to-Ala mutation in myeloid cells in the LDL receptor (LDLR)-deficient atherosclerotic background (M-S196ALdlr-KO). M-S196ALdlr-KO mice fed a high-fat diet exhibit increased atherosclerotic plaque burden and lesions with smaller necrotic cores and thinner fibrous caps. These diet-induced phenotypic changes are consistent with a reprogramed macrophage transcriptome promoted by LXRα-S196A during atherosclerosis development. Remarkably, expression of several proliferation-promoting factors, including the protooncogene FoxM1 and its targets, is induced by LXRα-S196A. This is consistent with increased proliferation of plaque-resident cells in M-S196ALdlr-KO mice. Moreover, disrupted LXRα phosphorylation increases expression of phagocytic molecules, resulting in increased apoptotic cell removal by macrophages, explaining the reduced necrotic cores. Finally, the macrophage transcriptome promoted by LXRα-S196A under dietary perturbation is markedly distinct from that revealed by LXR ligand activation, highlighting the singularity of this posttranslational modification. Overall, our findings demonstrate that LXRα phosphorylation at S196 is an important determinant of atherosclerotic plaque development through selective changes in gene transcription that affect multiple pathways.
Keywords: FoxM1; atherosclerosis; liver X receptor; macrophages; proliferation.
Conflict of interest statement
The authors declare no conflict of interest.
Figures


Similar articles
-
Macrophage Lxrα reduces atherosclerosis in Ldlr-/- mice independent of Arl7 transactivation.Biochem Biophys Res Commun. 2020 Aug 27;529(3):540-547. doi: 10.1016/j.bbrc.2020.06.071. Epub 2020 Jul 15. Biochem Biophys Res Commun. 2020. PMID: 32736671
-
Inhibiting LXRα phosphorylation in hematopoietic cells reduces inflammation and attenuates atherosclerosis and obesity in mice.Commun Biol. 2021 Mar 26;4(1):420. doi: 10.1038/s42003-021-01925-5. Commun Biol. 2021. PMID: 33772096 Free PMC article.
-
Adipocyte enhancer-binding protein 1 (AEBP1) (a novel macrophage proinflammatory mediator) overexpression promotes and ablation attenuates atherosclerosis in ApoE (-/-) and LDLR (-/-) mice.Mol Med. 2011 Sep-Oct;17(9-10):1056-64. doi: 10.2119/molmed.2011.00141. Epub 2011 Jun 14. Mol Med. 2011. PMID: 21687917 Free PMC article.
-
Exploring the Roles of Liver X Receptors in Lipid Metabolism and Immunity in Atherosclerosis.Biomolecules. 2025 Apr 14;15(4):579. doi: 10.3390/biom15040579. Biomolecules. 2025. PMID: 40305368 Free PMC article. Review.
-
LXRα Phosphorylation in Cardiometabolic Disease: Insight From Mouse Models.Endocrinology. 2020 Jul 1;161(7):bqaa089. doi: 10.1210/endocr/bqaa089. Endocrinology. 2020. PMID: 32496563 Free PMC article. Review.
Cited by
-
Single-cell atlas of endothelial cells in atherosclerosis: identifying C1 CXCL12+ ECs as key proliferative drivers for immunological precision therapeutics in atherosclerosis.Front Immunol. 2025 May 12;16:1569988. doi: 10.3389/fimmu.2025.1569988. eCollection 2025. Front Immunol. 2025. PMID: 40421026 Free PMC article.
-
The role of FoxM1 in immune cells.Clin Exp Med. 2023 Oct;23(6):1973-1979. doi: 10.1007/s10238-023-01037-w. Epub 2023 Mar 13. Clin Exp Med. 2023. PMID: 36913035 Review.
-
Deregulated immune cell recruitment orchestrated by FOXM1 impairs human diabetic wound healing.Nat Commun. 2020 Sep 16;11(1):4678. doi: 10.1038/s41467-020-18276-0. Nat Commun. 2020. PMID: 32938916 Free PMC article.
-
Deciphering Macrophage Phenotypes upon Lipid Uptake and Atherosclerosis.Immune Netw. 2020 Jun 22;20(3):e22. doi: 10.4110/in.2020.20.e22. eCollection 2020 Jun. Immune Netw. 2020. PMID: 32655970 Free PMC article. Review.
-
Myeloid LXR (Liver X Receptor) Deficiency Induces Inflammatory Gene Expression in Foamy Macrophages and Accelerates Atherosclerosis.Arterioscler Thromb Vasc Biol. 2022 Jun;42(6):719-731. doi: 10.1161/ATVBAHA.122.317583. Epub 2022 Apr 28. Arterioscler Thromb Vasc Biol. 2022. PMID: 35477277 Free PMC article.
References
Publication types
MeSH terms
Substances
Grants and funding
LinkOut - more resources
Full Text Sources
Other Literature Sources
Medical
Molecular Biology Databases
Research Materials
Miscellaneous
