. 2018 Aug 29;92(18):e00529-18.
doi: 10.1128/JVI.00529-18. Print 2018 Sep 15.

Gallid Herpesvirus 1 Initiates Apoptosis in Uninfected Cells through Paracrine Repression of p53

Affiliations

Gallid Herpesvirus 1 Initiates Apoptosis in Uninfected Cells through Paracrine Repression of p53

Hai Li et al. J Virol. .

Abstract

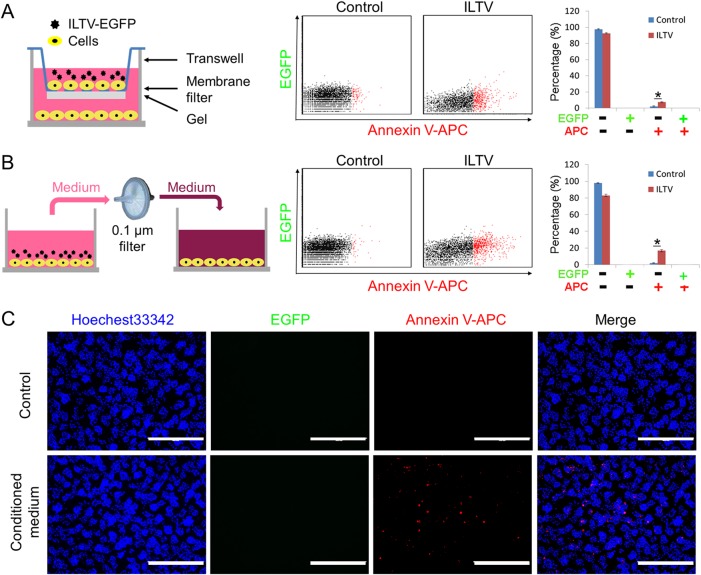
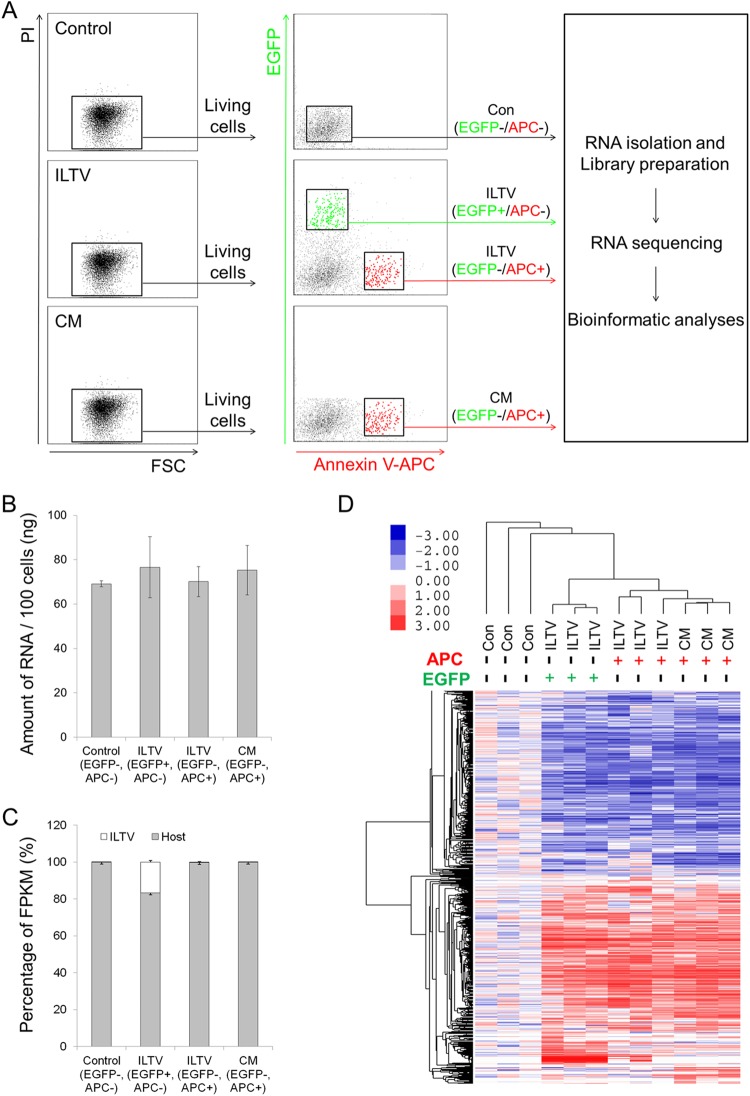
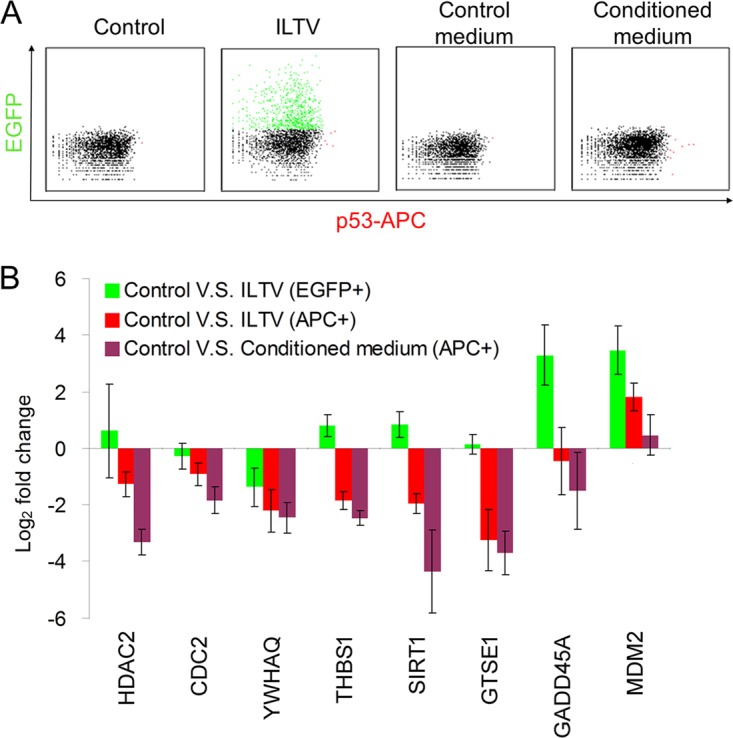
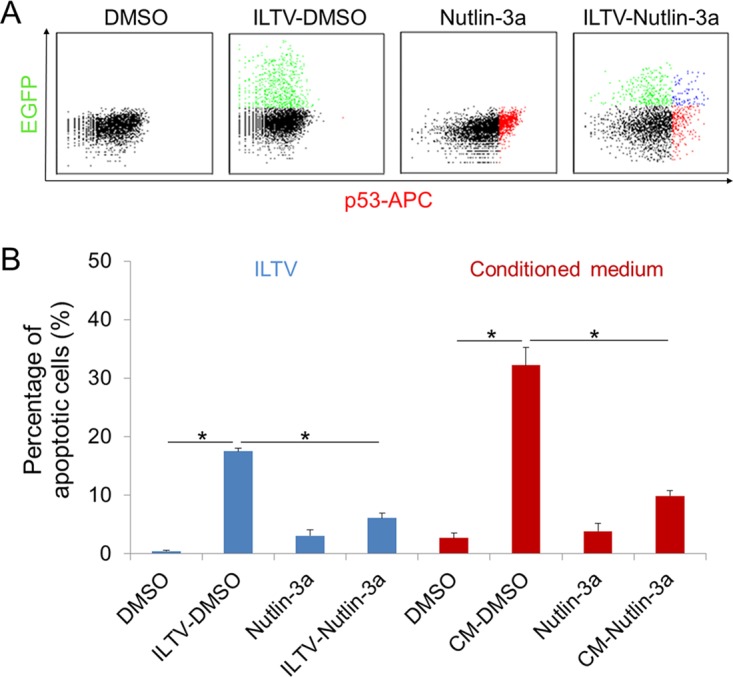
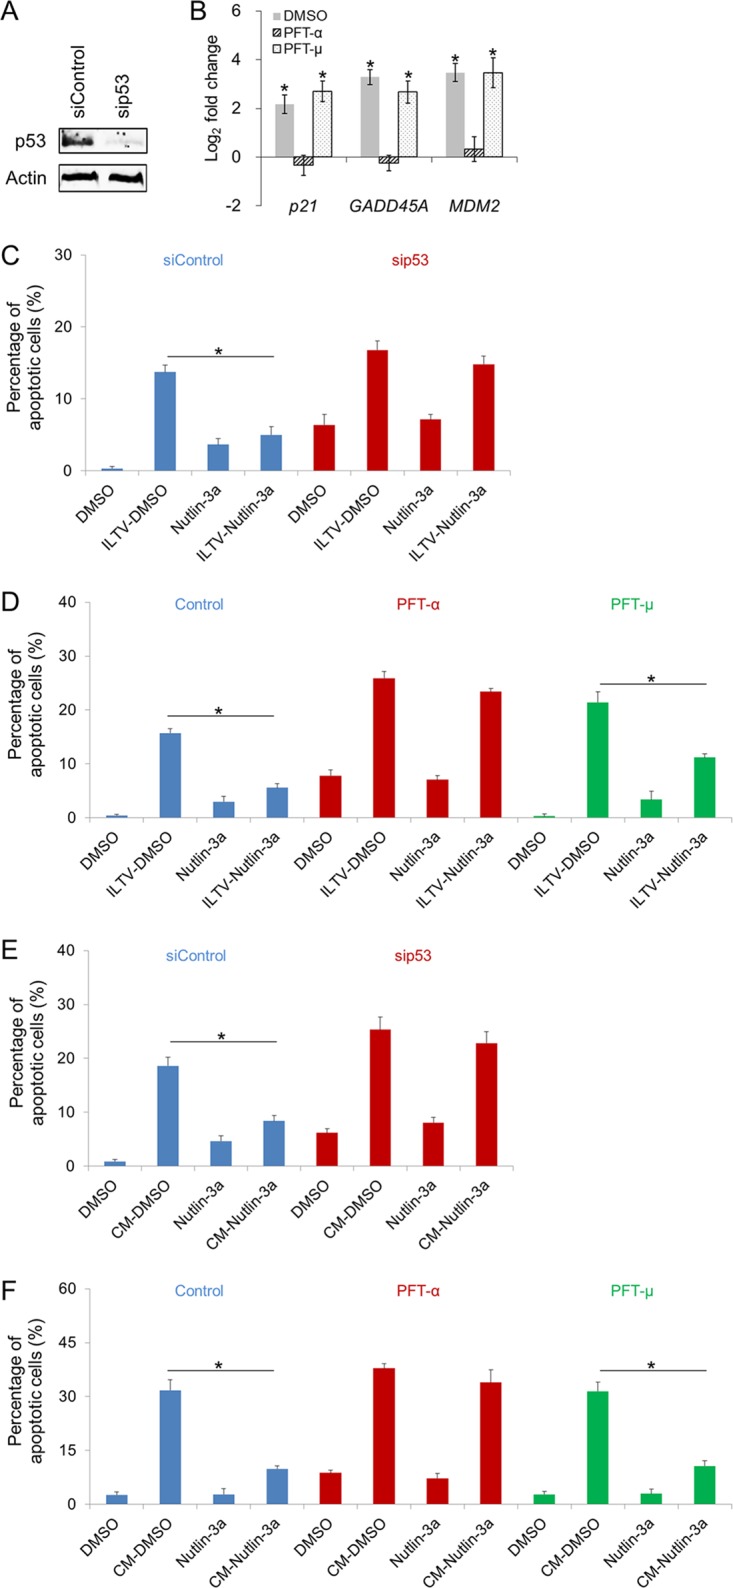
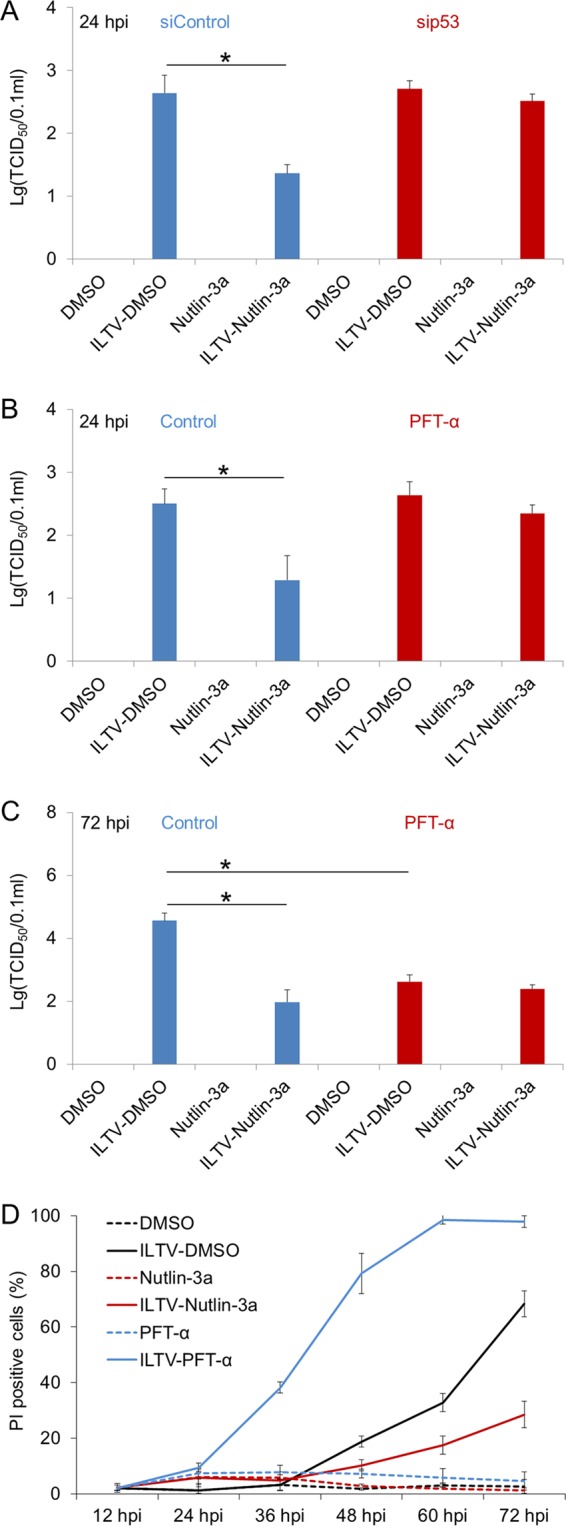
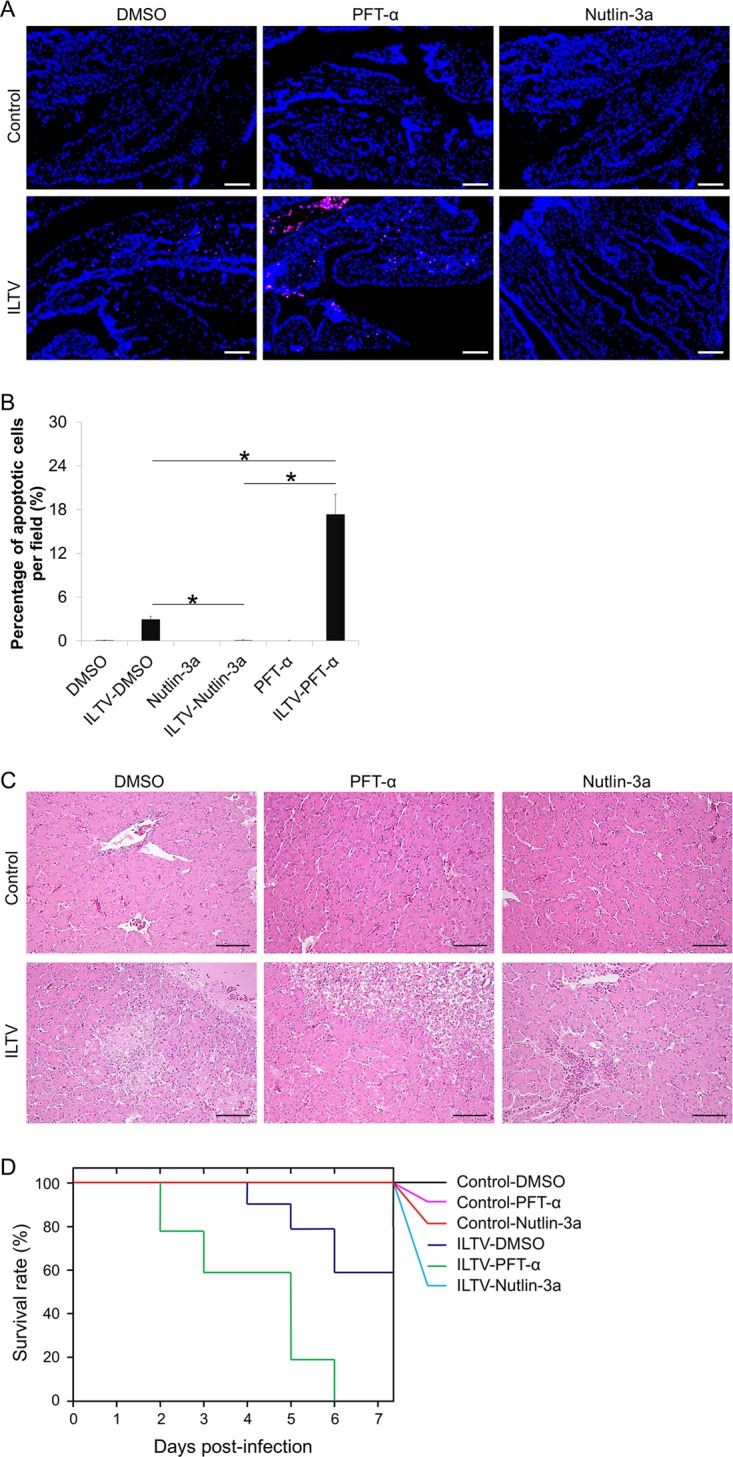
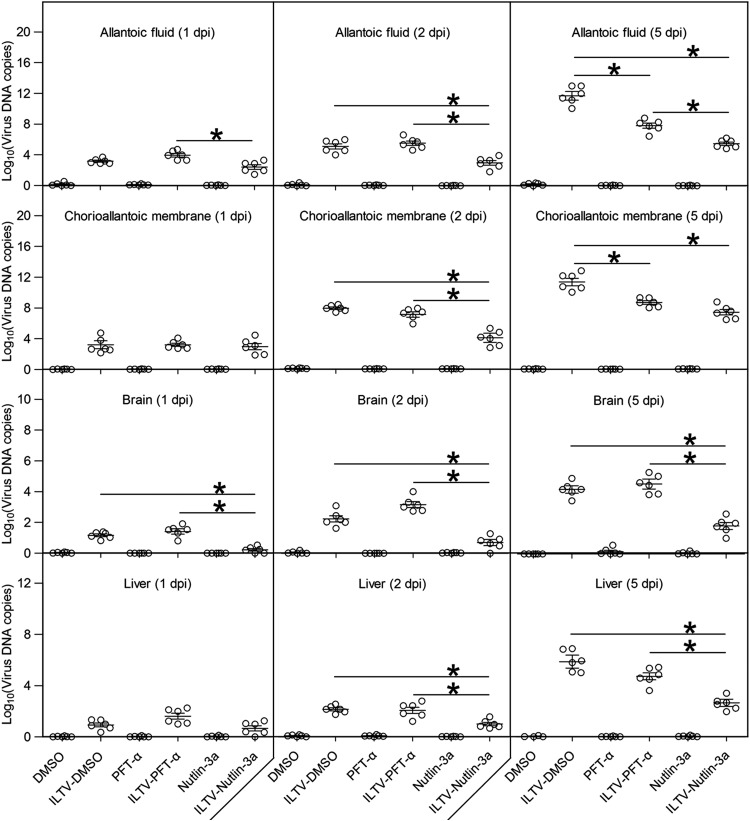
Apoptosis is a common innate defense mechanism of host cells against viral infection and is therefore suppressed by many viruses, including herpes simplex virus (HSV), via various strategies. A recent in vivo study reported the apoptosis of remote uninfected cells during Gallid herpesvirus 1 (GaHV-1) infection, yet little is known about this previously unknown aspect of herpesvirus-host interactions. The aim of the present study was to investigate the apoptosis of uninfected host cells during GaHV-1 infection. The present study used in vitro and in ovo models, which avoided potential interference by host antiviral immunity, and demonstrated that this GaHV-1-host interaction is independent of host immune responses and important for both the pathological effect of viral infection and early viral dissemination from the primary infection site to distant tissues. Further, we revealed that GaHV-1 infection triggers this process in a paracrine-regulated manner. Using genome-wide transcriptome analyses in combination with a set of functional studies, we found that this paracrine-regulated effect requires the repression of p53 activity in uninfected cells. In contrast, the activation of p53 not only prevented the apoptosis of remote uninfected cells and subsequent pathological damage induced by GaHV-1 infection but also delayed viral dissemination significantly. Moreover, p53 activation repressed viral replication both in vitro and in ovo, suggesting that dual cell-intrinsic mechanisms underlie the suppression of GaHV-1 infection by p53 activation. This study uncovers the mechanism underlying the herpesvirus-triggered apoptosis of remote host cells and extends our understanding of both herpesvirus-host interactions and the roles of p53 in viral infection.IMPORTANCE It is well accepted that herpesviruses suppress the apoptosis of host cells via various strategies to ensure sustained viral replication during infection. However, a recent in vivo study reported the apoptosis of remote uninfected cells during GaHV-1 infection. The mechanism and the biological meaning of this unexpected herpesvirus-host interaction are unclear. This study uncovers the mechanisms of herpesvirus-triggered apoptosis in uninfected cells and may also contribute to a mechanistic illustration of paracrine-regulated apoptosis induced by other viruses in uninfected host cells.

Keywords: alphaherpesviruses; p53; paracrine apoptosis; virus-host interactions.


Figures

FIG 1
FIG 1
Characterization of recombinant ILTV expressing EGFP. (A) Scheme depicting the generation of ILTV-EGFP. (B) PCR validation of the US9 deletion. The vertical dotted line indicates that all lanes are spliced from the same gel. (C and D) Validation of EGFP expression in LMH cells infected with ILTV-EGFP by fluorescence microscopy (C) and flow cytometry (D). Cell nuclei were stained with Hoechst 33342 (blue). The scale bar indicates 400 μm in panel C. (E) The replication of ILTV/ILTV-EGFP in LMH cells was determined with the TCID50 assay (upper, primary y axis), and the cytopathic effect of ILTV/ILTV-EGFP infection on LMH cells was determined with the plaque assay. The spread of CPE was visualized by crystal violet staining (lower) and quantified statistically using ImageJ (upper, secondary y axis). (F) Viral replication in allantoic fluid from 9-day-old specific-pathogen-free (SPF) chicken embryos inoculated with ILTV and ILTV-EGFP was detected by RT-qPCR at 5 days postinfection. Data are presented as the means ± SD (n = 6; P < 0.05). (G) The survival rate of inoculated embryos was calculated at 7 days postinfection. The data are presented as the means ± SD (n = 10; P < 0.05).
FIG 2
FIG 2
ILTV infection induces apoptosis in uninfected host cells. (A) The ILTV infection-induced apoptosis of PI-negative LMH cells was assayed by flow cytometry using annexin V-APC staining. The percentage of apoptotic cells is presented as the means ± SD (n = 3; P < 0.05). (B) ILTV-infected LMH cells and apoptotic cells were detected by fluorescence microscopy via tracing EGFP and annexin V-APC, respectively. (C and D) Immunofluorescence staining of CAMs (C) and embryo livers (D) using a rabbit polyclonal antibody against glycoprotein I of ILTV, followed by an FITC-conjoined anti-rabbit secondary antibody and TUNEL-APC staining in ovo, respectively. Normal rabbit serum was used as a background control. Cell nuclei were stained with Hoechst 33342 (blue). In panels B to D, the scale bars indicate 400 μm.
FIG 3
FIG 3
Biological significance of ILTV-induced apoptosis. (A) TUNEL-APC staining of CAMs in ovo at 24 hpi. Cell nuclei were stained with Hoechst 33342 (blue). The scale bar indicates 50 μm. (B) The percentage of apoptotic cells per field was quantified statistically by observing 100 cells per field in 3 fields per slide. Data are presented as the means ± SD. Asterisks indicate statistical difference (n = 6; P < 0.05). (C) Pathological examinations of livers by H&E staining. The scale bar indicates 50 μm. (D) Survival analysis of embryos inoculated with ILTV (n = 10; P < 0.05).
FIG 4
FIG 4
Effect of ILTV-induced apoptosis on in ovo viral replication. Viral replication in allantoic fluid, CAMs, brains, and livers at 1, 2, and 5 days postinfection was detected by RT-qPCR. Data are presented in log10 form. Asterisks indicate statistical difference (n = 6; P < 0.05).
FIG 5
FIG 5
Paracrine-regulated apoptosis of uninfected cells during ILTV infection. The apoptosis of uninfected LMH cells was assayed by flow cytometry, as described in the legend to Fig. 1A, using a Transwell system (A) and incubation with conditioned medium (B). The percentage of apoptotic cells is presented as the means ± SD. Asterisks indicate statistical difference (n = 3; P < 0.05). (C) Paracrine-regulated apoptosis of uninfected LMH cells after incubation with conditioned medium was determined via immunofluorescence staining using annexin V-APC, as described in the legend to Fig. 2B. The scale bar indicates 400 μm.
FIG 6
FIG 6
Genome-wide transcriptome analysis. (A) Workflow of the genome-wide transcriptome analysis. (B and C) RNA level per 100 isolated cells (B) and the proportions of viral and host RNA (C) are presented as the means ± SD (n = 3; P < 0.05). FPKM, fragments per kilobase million. (D) Hierarchical clustering analysis of 1,911 genes that were differentially expressed in LMH cells at P < 0.001, q < 0.001, and a fold change of >1.5. Columns indicate arrays, and rows indicate genes. The values are normalized by row. Blue indicates downregulation, and pink indicates upregulation.
FIG 7
FIG 7
Validation of the genome-wide transcriptome analysis. The transcription of 15 genes selected for the validation of the RNA sequencing data were assayed by RT-qPCR. Both RNA sequencing data and RT-qPCR data are presented as the means ± SD (n = 3).
FIG 8
FIG 8
Biological analyses of transcriptome data to identify key modulators of the paracrine-regulated apoptosis of uninfected cells during ILTV infection. (A) A Venn diagram showing the intersections of genes significantly regulated among subgroups in LMH cells (P < 0.05). (B) Combined pathway analysis of significantly expressed genes (P < 0.05). (C) An analysis of functional interactions between the significantly expressed genes reveals p53 as the most promising central modulator of the molecular events that are differentially induced in infected nonapoptotic cells and uninfected apoptotic cells. (Left) The red rectangle in the functional interaction network represents p53, and the blue rectangles represent other proteins. (Right) The top 20 key nodes were arranged in order of their functional connectivity to other proteins in the network.
FIG 9
FIG 9
Repression of p53 signaling by ILTV infection in uninfected apoptotic cells. (A) Protein levels of p53 were examined by flow cytometry using an anti-p53 antibody followed by an APC-conjugated anti-mouse secondary antibody in LMH cells after ILTV infection or inoculation with conditioned medium. The mouse IgG was used as an isotype control to determine the level of background. (B) The transcription levels of selected genes involved in p53 signaling were assayed by RT-qPCR. Data are presented as the means ± SD (n = 3; P < 0.05).
FIG 10
FIG 10
Rescue of LMH cells from paracrine-regulated apoptosis by Nutlin-3a. (A) Protein levels of p53 were examined by flow cytometry in LMH cells after ILTV infection in the presence or absence of Nutlin-3a treatment, as described in the legend to Fig. 9A. (B) Apoptosis of LMH cells upon ILTV infection (blue) or inoculation with conditioned medium (CM; red) in the presence or absence of Nutlin-3a treatment was assayed by flow cytometry, as described in the legend to Fig. 2A. Data are presented as the means ± SD. Asterisks indicate statistical difference (n = 3; P < 0.05).
FIG 11
FIG 11
p53 is a key determinant of paracrine-regulated apoptosis in uninfected cells during ILTV infection. (A) The efficiency of p53 depletion by an siRNA specifically targeting p53 and the induction of p53 by Nutlin-3a in LMH cells were evaluated by immunoblotting. Actin was used as a loading control. (B) The transcriptional activity of p53 was determined by assaying the transcription levels of p53 target genes using RT-qPCR. All levels were normalized to the housekeeping gene GAPDH. Data are presented as log2 fold change between Nutlin-3a-treated samples and DMSO mock samples. (C to F) The apoptosis of LMH cells upon ILTV infection (C and D) or inoculation with conditioned medium (CM; E and F) in the presence or absence of Nutlin-3a treatment was assayed by flow cytometry as described in the legend to Fig. 2A. p53 activity was blocked by siRNA-mediated p53 depletion (C and E), PFT-α, an inhibitor of p53 transcriptional activity, or PFT-μ, an inhibitor of p53 posttranslational activity (D and F, respectively). The data in panels B to F are presented as the means ± SD. Asterisks indicate statistical difference (n = 3; P < 0.05).
FIG 12
FIG 12
Repression of in vitro ILTV replication by p53 activation. (A to C) The effect of p53 on viral replication in LMH cells upon p53 depletion (A) or pretreatment with PFT-α (B and C) in the presence or absence of Nutlin-3a treatment was determined with the TCID50 assay. (D) The proportions of PI-positive cells were assayed by flow cytometry after pretreatment with Nutlin-3a or PFT-α. The data are presented as the means ± SD. Asterisks indicate statistical difference (n = 3; *, P < 0.05).
FIG 13
FIG 13
p53 is a key determinant of the pathological effect of ILTV infection in ovo. (A) TUNEL-APC staining of CAMs in ovo at 24 hpi. Cell nuclei were stained with Hoechst 33342 (blue). The scale bar indicates 50 μm. (B) The percentage of apoptotic cells per field was quantified statistically by observing 100 cells per field in 3 fields per slide. Data are presented as the means ± SD. Asterisks indicate statistical difference (n = 6; P < 0.05). (C) Pathological examinations of livers by H&E staining. The scale bar indicates 50 μm. (D) Survival analysis of embryos inoculated with ILTV (n = 10; P < 0.05).
FIG 14
FIG 14
Effect of p53 on in ovo viral replication. Viral replication in allantoic fluid, CAMs, brains, and livers was detected by RT-qPCR at 1, 2, and 5 days postinfection. Data are presented in log10 form. Asterisks indicate statistical difference (n = 6; P < 0.05).

Similar articles

Cited by

References

    1. Samaniego LA, Neiderhiser L, DeLuca NA. 1998. Persistence and expression of the herpes simplex virus genome in the absence of immediate-early proteins. J Virol 72:3307–3320. - PMC - PubMed
    1. Sanfilippo CM, Blaho JA. 2006. ICP0 gene expression is a herpes simplex virus type 1 apoptotic trigger. J Virol 80:6810–6821. doi:10.1128/JVI.00334-06. - DOI - PMC - PubMed
    1. Wang X, Li Y, Liu S, Yu X, Li L, Shi C, He W, Li J, Xu L, Hu Z, Yu L, Yang Z, Chen Q, Ge L, Zhang Z, Zhou B, Jiang X, Chen S, He S. 2014. Direct activation of RIP3/MLKL-dependent necrosis by herpes simplex virus 1 (HSV-1) protein ICP6 triggers host antiviral defense. Proc Natl Acad Sci U S A 111:15438–15443. doi:10.1073/pnas.1412767111. - DOI - PMC - PubMed
    1. Nguyen ML, Blaho JA. 2007. Apoptosis during herpes simplex virus infection. Adv Virus Res 69:67–97. doi:10.1016/S0065-3527(06)69002-7. - DOI - PubMed
    1. Sabri F, Granath F, Hjalmarsson A, Aurelius E, Sköldenberg B. 2006. Modulation of sFas indicates apoptosis in human herpes simplex encephalitis. J Neuroimmunol 171:171–176. - PubMed

Publication types