. 2018 Aug 16;92(17):e00934-18.
doi: 10.1128/JVI.00934-18. Print 2018 Sep 1.

Rubella Viruses Shift Cellular Bioenergetics to a More Oxidative and Glycolytic Phenotype with a Strain-Specific Requirement for Glutamine

Affiliations

Rubella Viruses Shift Cellular Bioenergetics to a More Oxidative and Glycolytic Phenotype with a Strain-Specific Requirement for Glutamine

Nicole C Bilz et al. J Virol. .

Abstract

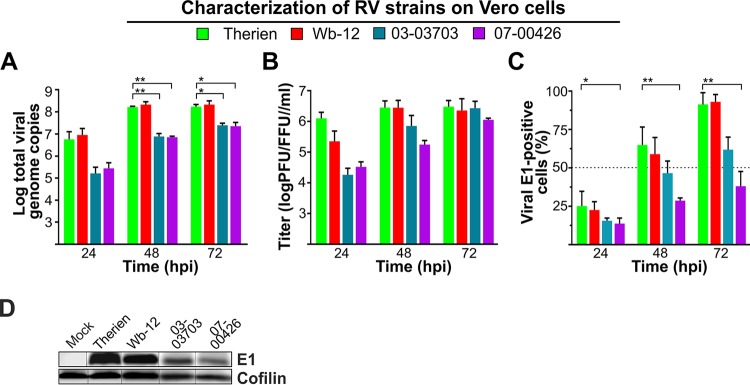
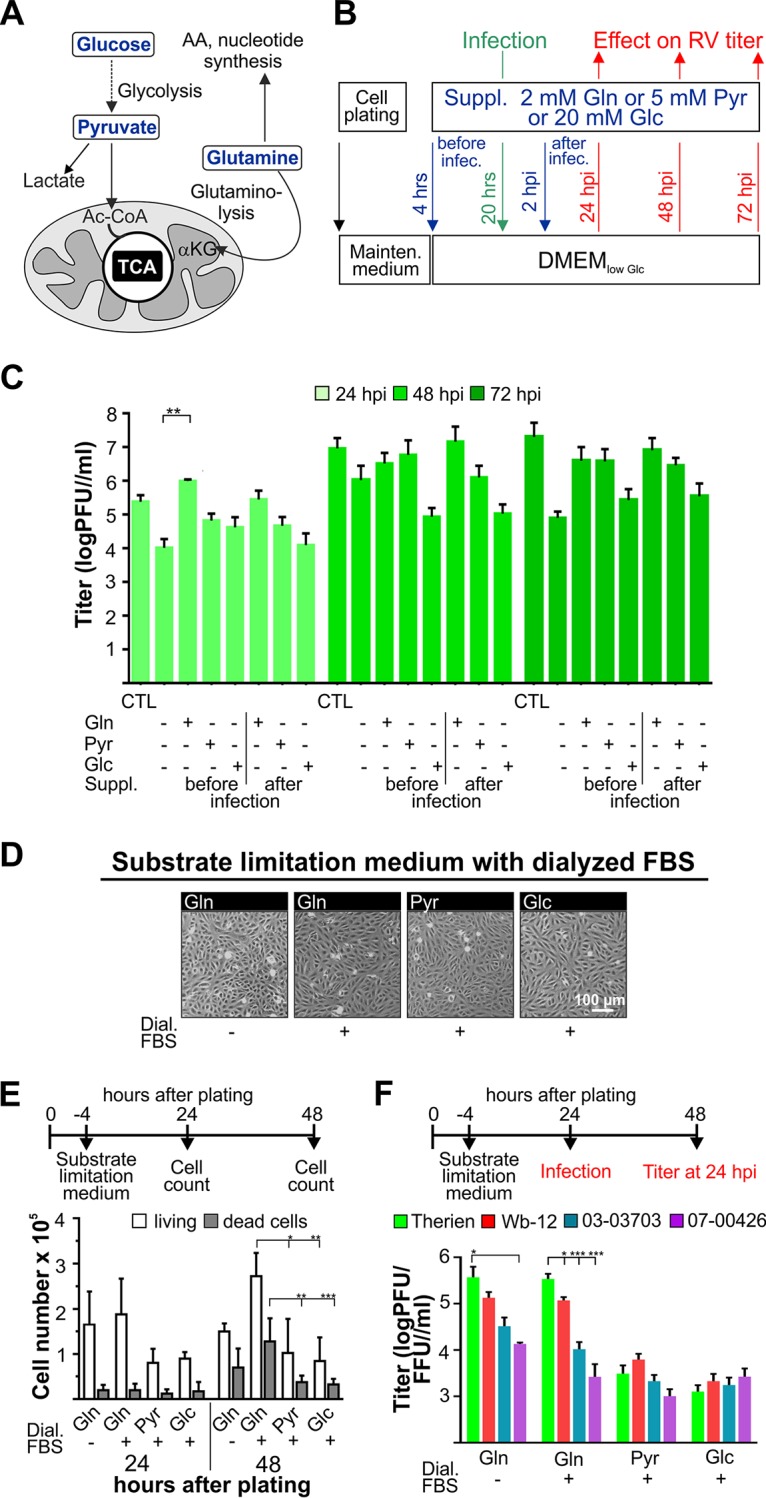
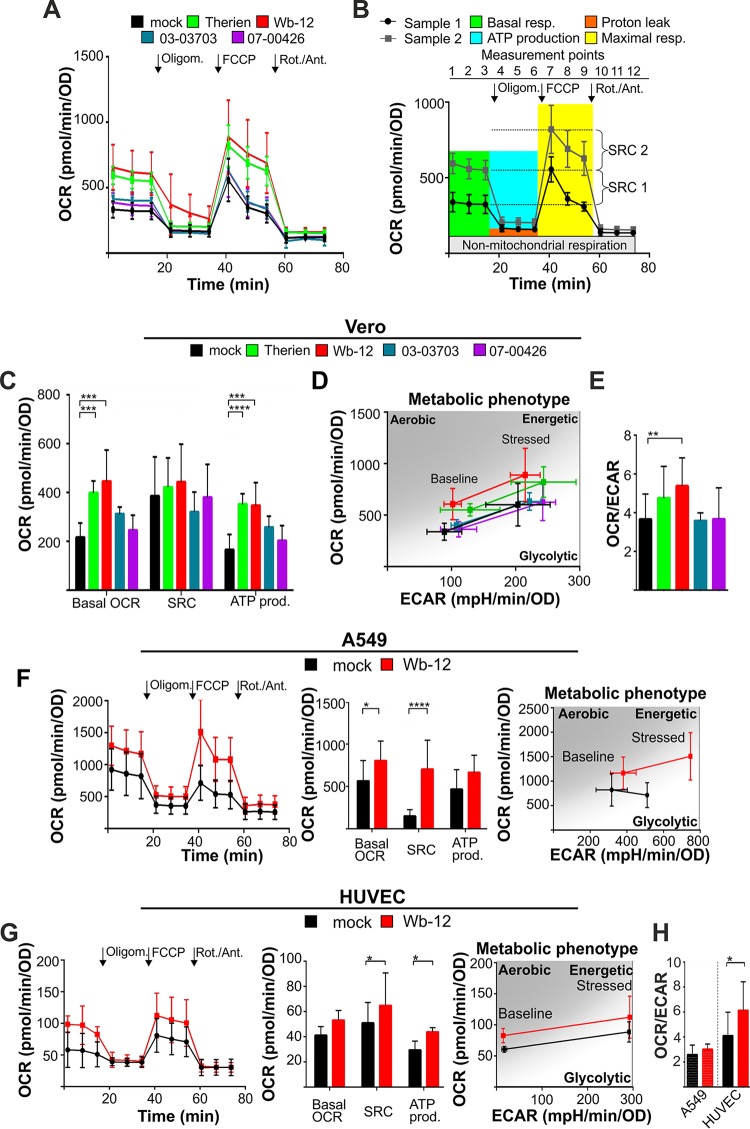
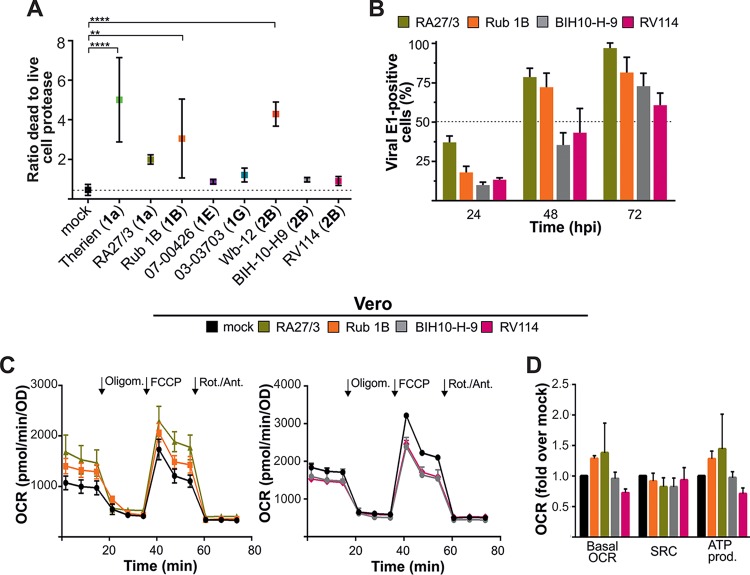
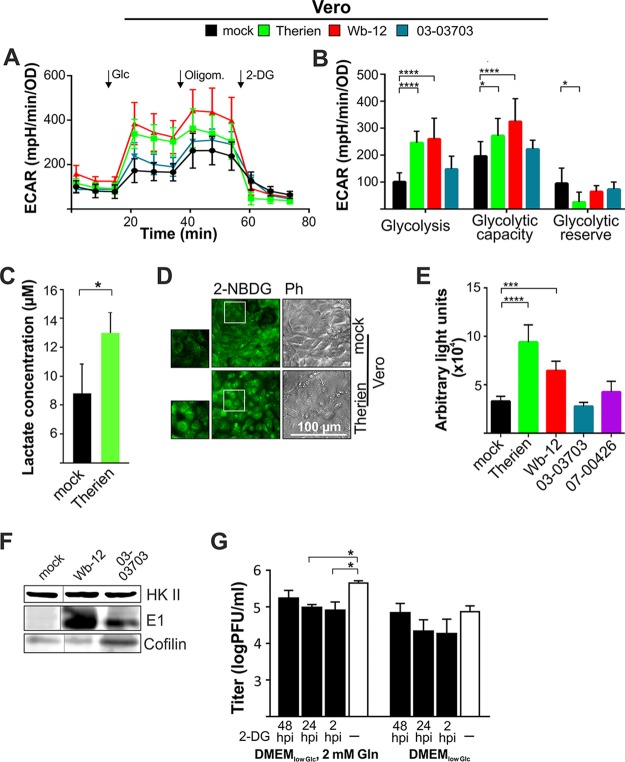
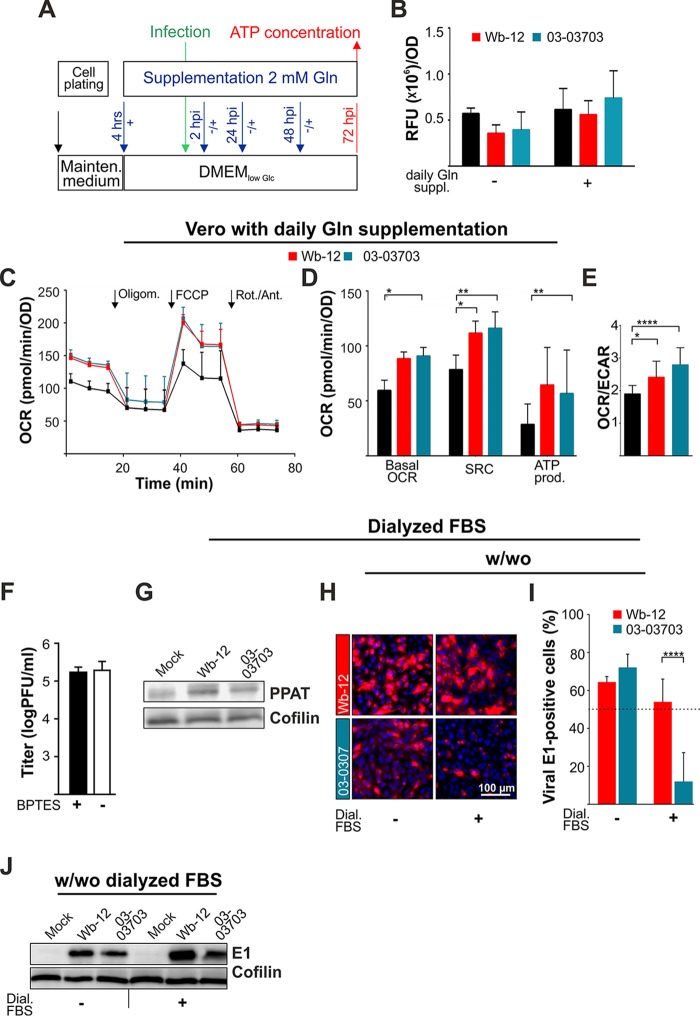
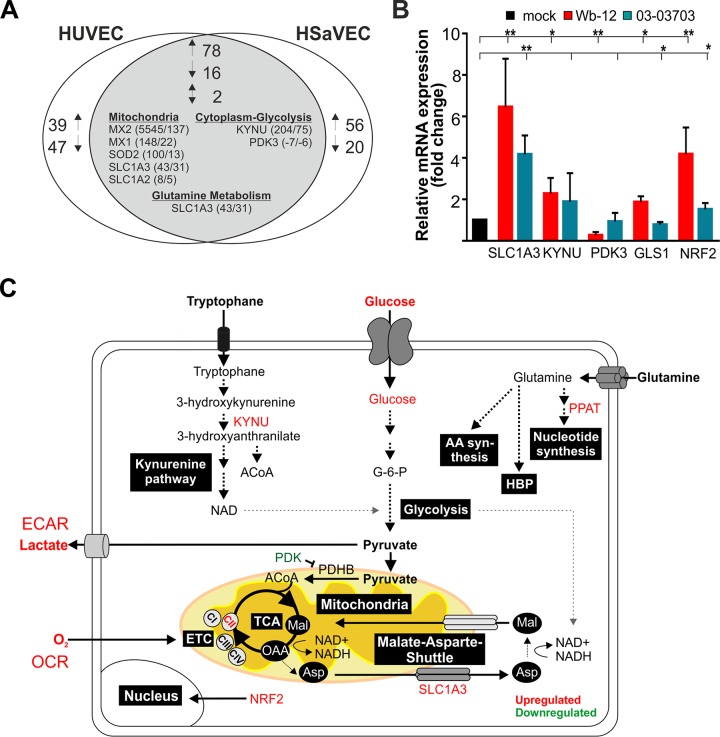
The flexible regulation of cellular metabolic pathways enables cellular adaptation to changes in energy demand under conditions of stress such as posed by a virus infection. To analyze such an impact on cellular metabolism, rubella virus (RV) was used in this study. RV replication under selected substrate supplementation with glucose, pyruvate, and glutamine as essential nutrients for mammalian cells revealed its requirement for glutamine. The assessment of the mitochondrial respiratory (based on the oxygen consumption rate) and glycolytic (based on the extracellular acidification rate) rate and capacity by respective stress tests through Seahorse technology enabled determination of the bioenergetic phenotype of RV-infected cells. Irrespective of the cellular metabolic background, RV infection induced a shift of the bioenergetic state of epithelial cells (Vero and A549) and human umbilical vein endothelial cells to a higher oxidative and glycolytic level. Interestingly there was a RV strain-specific, but genotype-independent demand for glutamine to induce a significant increase in metabolic activity. While glutaminolysis appeared to be rather negligible for RV replication, glutamine could serve as donor of its amide nitrogen in biosynthesis pathways for important metabolites. This study suggests that the capacity of RVs to induce metabolic alterations could evolve differently during natural infection. Thus, changes in cellular bioenergetics represent an important component of virus-host interactions and could complement our understanding of the viral preference for a distinct host cell population.IMPORTANCE RV pathologies, especially during embryonal development, could be connected with its impact on mitochondrial metabolism. With bioenergetic phenotyping we pursued a rather novel approach in virology. For the first time it was shown that a virus infection could shift the bioenergetics of its infected host cell to a higher energetic state. Notably, the capacity to induce such alterations varied among different RV isolates. Thus, our data add viral adaptation of cellular metabolic activity to its specific needs as a novel aspect to virus-host evolution. In addition, this study emphasizes the implementation of different viral strains in the study of virus-host interactions and the use of bioenergetic phenotyping of infected cells as a biomarker for virus-induced pathological alterations.

Keywords: 2-deoxyglucose; ECAR; OCR; extracellular acidification rate; extracellular flux analysis; glucose uptake; glutaminolysis; glycolysis; kynurenine pathway; metabolic phenotype; mitochondrial respiration; nucleotide biosynthesis; oxygen consumption rate; rubella virus.


Figures

FIG 1
FIG 1
Characterization of the replication rate of RV strains on Vero cells. (A) The number of viral RNA genomes was verified for the indicated time points by TaqMan RT-qPCR. (B) The amount of viral progeny generated over time of incubation was determined by plaque assay (Therien and Wb-12) and focus-forming assay (03-03703 and 07-00426). (C) The number of viral E1-positive cells was determined in random microscopic fields after immunofluorescence analysis with anti-E1 antibodies. Total cell number was quantified through counting of stained nuclei per microscopic field. (D) Western blot analysis of mock- and RV-infected Vero cells (72 hpi) with an antibody against RV E1 protein to compare its expression level among the indicated RV strains. A spliced image was used to combine data from different gels and to adhere to the order of the respective samples applied to the figures of the manuscript.
FIG 2
FIG 2
Effect of selected substrate supplementation on RV replication and Vero cell growth rate. d-Glucose (Glc), l-glutamine (Gln), and sodium pyruvate (Pyr) as important carbon sources for mammalian cells were used for selected substrate supplementation (suppl.) of mock- and RV-infected Vero cells. (A) Summary of the metabolic pathways fueled by the applied nutrients. AA, amino acid; α-KG, α-ketoglutarate. (B) Schematic illustration of the application of the indicated supplements either 4 h after plating (supplementation before infection) or 2 hpi (supplementation after infection). (C) Viral titer (assessed for the Therien strain by a standard plaque assay) was determined for the indicated substrate supplementation conditions at 24, 48, and 72 hpi. CTL, control in maintenance medium. (D) For assessment of cell morphology and density under given substrate supplementation conditions, phase-contrast images of mock-infected Vero cells were obtained 24 h after plating before the initiation of infection with RV. (E) The number of live and dead cells was determined by trypan blue exclusion assay at 24 and 48 h after cell plating for the indicated substrate supplementation conditions. (F) Viral titers were determined by plaque assay (Therien and Wb-12) and focus-forming assay (03-03703 and 07-00426) at 24 hpi.
FIG 3
FIG 3
Oxygen consumption rate and metabolic phenotype of RV-infected epithelial cells (Vero and A549) and HUVECs. (A) The OCR was measured at 72 hpi in mock- and RV-infected Vero cells under basal and stressed conditions using Seahorse technology with a Mito stress test kit. Sequential injection of oligomycin (Oligom.), FCCP, and rotenone/antimycin A (Rot./Ant.) is indicated. (B) Calculation of mitochondrial activity was done as illustrated. Maximal respiration is the OCR after the injection of FCCP minus the OCR after injection of oligomycin. Proton leak is the OCR after the injection of rotenone/antimycin A minus OCR after injection of oligomycin. ATP production (based on respiration) is the difference between the basal respiration and the respiration after the injection of oligomycin. The spare respiratory capacity (SRC) is the OCR after the injection of FCCP minus the OCR at basal respiration (measurement point 3). (C) The data obtained in panel A were used to calculate the SRC and ATP production (ATP prod.), as described in panel B. (D) Metabolic phenotype indicative of the bioenergetic state of mock- and RV-infected Vero cells (72 hpi) generated through OCR and extracellular acidification rate (ECAR) values under basal (normal) conditions and stressed conditions (application of oxidative phosphorylation [OXPHOS] inhibitors of the Mito stress test kit). (E) The ratio of the OCR to the ECAR was calculated based on the values obtained for baseline (normal) conditions in mock- and RV-infected Vero cells (72 hpi). An increase in the OCR/ECAR ratio compared to the mock-infected cells is indicative of a higher OXPHOS activity. (F and G) For mock- and RV-infected A549 (at 72 hpi) cells (F) and HUVECs (at 36 hpi) (G), the OCR was measured under basal and stressed conditions using a Mito stress test kit. Sequential injection of the indicated inhibitors was used to calculate the SRC and ATP production, as described in panel B, and to generate the metabolic phenotype. (H) OCR/ECAR ratio based on OCR and ECAR values obtained for baseline (normal) conditions in mock- and RV-infected A549 cells (72 hpi) and HUVECs (36 hpi). An increase in the OCR/ECAR ratio compared to mock-infected cells indicates a higher OXPHOS activity.
FIG 4
FIG 4
Analysis of the cytopathogenic and metabolic potential of selected RV strains representing clade 1 and 2 genotypes. (A) A fluorescence-based MultiTox-Fluor multiplex cytotoxicity assay was used to measure the number of live and dead cells at 72 hpi in Vero cells. The corresponding genotype is given in parentheses adjacent to the respective RV strain. (B) The number of viral E1-positive cells was determined in random microscopic fields by immunofluorescence analysis with anti-E1 antibodies. The total cell number was quantified by counting the stained nuclei per microscopic field. (C) The OCR was measured at 72 hpi in mock-infected and RV-infected (using the indicated strains) Vero cells under basal and stressed conditions using a Mito stress test kit. The sequential injection of the indicated inhibitors (oligomycin [Oligom.], FCCP, and rotenone/antimycin A [Rot./Ant.]) was used to calculate the SRC and ATP production (D), as described in Fig. 3B. OCR is expressed as the increase versus mock-infected cells (mock = 100%).
FIG 5
FIG 5
Impact of rubella virus infection on cellular glycolytic activity and glucose uptake rate. (A) The extracellular flux measurement based on the medium conditions of the glycolysis stress test kit was applied at 72 hpi to Vero cells infected with the indicated RV strains. (B) Sequential injection of the substrate glucose and the inhibitors oligomycin (Oligom.) and 2-DG was used to calculate glycolytic capacity and reserve. (C) The observed increase in the ECAR in Therien-infected Vero cells (see panel A) was correlated with the extracellular lactate concentration at 72 hpi through the internal lactate standard of the glycolysis cell-based assay kit. (D and E) The glucose uptake rate was qualitatively analyzed through microscopic analysis (D) and quantitatively on a microplate reader for mock- and RV-infected Vero cells (72 hpi) through uptake of 2-NBDG as the fluorescent analogue of glucose (E). Cells were cultivated in DMEMlow Glc supplemented with glutamine. (F) Extracts of mock- and RV-infected Vero cells were obtained at 72 hpi and processed for Western blot analysis with anti-cofilin (loading control) and anti-hexokinase II (HKII) and anti-E1 antibodies. A spliced image of the same gel was used to adhere to the order of the respective samples applied to the figures in the manuscript. (G) The impact of the application of the glycolytic inhibitor 2-DG (at a concentration of 5 mM) at the indicated time points on the replication of RV strain Wb-12 was assessed by titer determination using a standard plaque assay.
FIG 6
FIG 6
Glutamine-centered cellular pathways contribute to metabolic alterations induced by RV at a strain-specific rate. (A) Application scheme for the supplementation of DMEMlow Glc with (+) or without (−) the daily addition of glutamine (Gln). Glutamine supplementation was started 4 h after plating. (B) The intracellular ATP content in mock- and RV-infected Vero cells (72 hpi) was determined by a CellTiter-Glo luminescent cell viability assay for the indicated substrate conditions. The relative fluorescence units (RFU) were normalized by dividing the average of each triplicate sample by the mean OD value of standard Bradford protein assay (blank corrected). (C and D) The bioenergetic profiles of mock- and RV-infected cells were determined after daily supplementation with glutamine. (C) The OCR was measured at 72 hpi in mock-infected and RV-infected (using the indicated strains) Vero cells under basal and stressed conditions using a Mito stress test kit. Sequential injection of indicated inhibitors (oligomycin [Oligom.], FCCP, and rotenone/antimycin A [Rot./Ant.]) was used for the calculation of the SRC and ATP production (D), as described in Fig. 3B. The OCR is expressed as the increase over mock-infected cells (mock = 100%). (E) The ratio of the OCR to the ECAR was calculated with the values obtained for baseline (normal) conditions in mock- and RV-infected Vero cells (72 hpi). An increase in the OCR/ECAR ratio indicates a higher oxidative phosphorylation (OXPHOS) activity. (F) The impact of the glutaminase inhibitor BPTES (at a concentration of 10 μM) on the replication of RV strain Wb-12 was assessed by titer determination for supernatants collected at 48 hpi using standard plaque assay. (G) Western blot analysis of the PPAT expression level in Vero cells (72 hpi) after daily supplementation of DMEMlow Glc with glutamine. (H) Representative images obtained after immunofluorescence analysis performed at 24 hpi with anti-E1 antibody (shown in red) for RV-infected Vero cells. Experiments were performed under supplementation of DMEMlow Glc with Gln in the presence (+) or absence (−) of dialyzed (Dial.) FBS. (I) The immunofluorescence assays were used to calculate the number of E1-positive cells in random microscopic fields. The total cell number was quantified by counting the stained nuclei per microscopic field. (J) Western blot analysis of E1 expression level at 72 hpi after daily supplementation of DMEMlow Glc with Gln in the presence (+) or absence (−) of dialyzed (Dial.) FBS.
FIG 7
FIG 7
Analysis of cellular factors involved in metabolic alterations induced by RV. (A) Diagram showing the intersection between upregulated (↑), downregulated (↓), and contraregulated transcripts in HUVECs and HSaVECs after RV infection that were assigned for biological process GO terms containing the word “mitochondria,” “mitochondrion,” “glutamine,” or “glycolysis.” Data were obtained from microarray analyses described elsewhere (24). (B) Identified hits and relevant target genes were confirmed by RT-qPCR for cDNA samples derived from the RNA extracted at 72 hpi from Wb-12- and 03-03703-infected Vero cells (MOI of 5). The expression level is indicated relative to the corresponding mock-infected control (set as 1). SLC1A3, glutamate transporter/solute carrier family 1, member 3; KYNU, kynureninase; PDK3, pyruvate dehydrogenase complex (PDH) kinase 3; GLS1, glutaminase 1; NRF2, nuclear factor E2-related factor 2. (C) Summarizing figure for cellular targets with an altered expression level under RV infection with respect to their assigned metabolic pathways as outlined in the manuscript text. AA, amino acids; HBP, hexosamine biosynthesis pathway.

Similar articles

Cited by

References

    1. Mills EL, O'Neill LA. 2016. Reprogramming mitochondrial metabolism in macrophages as an anti-inflammatory signal. Eur J Immunol 46:13–21. doi:10.1002/eji.201445427. - DOI - PubMed
    1. Hesterberg RS, Cleveland JL, Epling-Burnette PK. 2018. Role of polyamines in immune cell functions. Med Sci 6:E22. doi:10.3390/medsci6010022. - DOI - PMC - PubMed
    1. Sanchez EL, Lagunoff M. 2015. Viral activation of cellular metabolism. Virology 479-480:609–618. doi:10.1016/j.virol.2015.02.038. - DOI - PMC - PubMed
    1. Vastag L, Koyuncu E, Grady SL, Shenk TE, Rabinowitz JD. 2011. Divergent effects of human cytomegalovirus and herpes simplex virus-1 on cellular metabolism. PLoS Pathog 7:e1002124. doi:10.1371/journal.ppat.1002124. - DOI - PMC - PubMed
    1. Fontaine KA, Camarda R, Lagunoff M. 2014. Vaccinia virus requires glutamine but not glucose for efficient replication. J Virol 88:4366–4374. doi:10.1128/JVI.03134-13. - DOI - PMC - PubMed

Publication types

MeSH terms

LinkOut - more resources