. 2018 Jun 27;10(447):eaap9328.
doi: 10.1126/scitranslmed.aap9328.

Preclinical assessment of antiviral combination therapy in a genetically humanized mouse model for hepatitis delta virus infection

Affiliations

Preclinical assessment of antiviral combination therapy in a genetically humanized mouse model for hepatitis delta virus infection

Benjamin Y Winer et al. Sci Transl Med. .

Abstract

Chronic delta hepatitis, caused by hepatitis delta virus (HDV), is the most severe form of viral hepatitis, affecting at least 20 million hepatitis B virus (HBV)-infected patients worldwide. HDV/HBV co- or superinfections are major drivers for hepatocarcinogenesis. Antiviral treatments exist only for HBV and can only suppress but not cure infection. Development of more effective therapies has been impeded by the scarcity of suitable small-animal models. We created a transgenic (tg) mouse model for HDV expressing the functional receptor for HBV and HDV, the human sodium taurocholate cotransporting peptide NTCP. Both HBV and HDV entered hepatocytes in these mice in a glycoprotein-dependent manner, but one or more postentry blocks prevented HBV replication. In contrast, HDV persistently infected hNTCP tg mice coexpressing the HBV envelope, consistent with HDV dependency on the HBV surface antigen (HBsAg) for packaging and spread. In immunocompromised mice lacking functional B, T, and natural killer cells, viremia lasted at least 80 days but resolved within 14 days in immunocompetent animals, demonstrating that lymphocytes are critical for controlling HDV infection. Although acute HDV infection did not cause overt liver damage in this model, cell-intrinsic and cellular innate immune responses were induced. We further demonstrated that single and dual treatment with myrcludex B and lonafarnib efficiently suppressed viremia but failed to cure HDV infection at the doses tested. This small-animal model with inheritable susceptibility to HDV opens opportunities for studying viral pathogenesis and immune responses and for testing novel HDV therapeutics.


Conflict of interest statement

Competing financial interests. The authors declare no relevant conflicts of interest.

Figures

Figure 1.
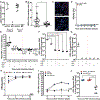
Figure 1.. hNTCP-BAC NRG mice facilitate uptake of HBVcc and HDVcc.
(A) hNTCP expression levels as compared to housekeeping gene HPRT1 in hNTCP-BAC C57BL/6 (n=4), hNTCP-NRG (n=12) with C57BL/6 (n=2) and NRG (n=2) mice using relative RT-qPCR and comparing ΔΔCt. Mice were challenged with infectious 5-ethynyl-2′-deoxycytidine (EdC) labeled HBVcc. (B) Quantification of HBVcc-EdC entry into murine hepatocytes [percent cells positive for HBV DNA in an entire slide section] of hNTCP-BAC NRG (n=3) versus NRG (n=3) WT animals. (C) Representative images of HBVcc-EdC entry in hNTCP-BAC (top) and NRG WT (bottom) hepatocytes. HBV DNA (red) and nuclei (blue) were observed (scale bar = 200 μm). (D) HBsAg quantification over two weeks for hNTCP-BAC NRG (blue, n=5) and NRG WT (red, n=5) mice challenged with HBVcc. Quantitation of HDV RNA in serum (E), HDV genomic RNA in liver (F), HDV anti-genomic in liver (G), in hNTCP-BAC NRG (n=4) versus WT NRG (n=4) mice with or without expression of HBV envelope proteins. The red dashed lines separate the hNTCP-expressing (left) from non-expressing mice (right) in each of the panels. hNTCP-BAC/1.3× HBV HDD NRG mice were challenged with patient-derived HDV virions (HDVpat n=6), HDVcc, or were non-infected. (H) Longitudinal HBsAg data, (I). Longitudinal HDV RNA in the serum of animals and (J). Quantification of genomic HDV RNA in the liver. All data are represented as ± s.e.m. Statistical significance was as follows: *, p < 0.05; **, p ≤ 0.001, ***, p ≤ 0.001, ****, p ≤ 0.0001, using an ordinary one-way ANOVA with a Bonferroni’s multiple comparisons test.
Figure 2.
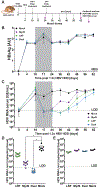
Figure 2.. HDV infects hNTCP-BAC/1.3× HBV HDD NRG mice through native entry mechanisms.
(A) Schematic of time course for peptide inhibition assay. Normalized quantification of HDV RNA in hNTCP-BAC/1.3×HBV HDD NRG mice treated with mock (black, n=5), preS1-FITC peptide (blue, n=5), or a non-inhibitory control peptide (red, n=5) in serum (B) or liver (C). All data are represented as ± s.e.m. Statistical significance was as follows: *, p < 0.05; **, p ≤ 0.001, ***, p ≤ 0.001, ****, p ≤ 0.0001, using an ordinary one-way ANOVA with a Bonferroni’s multiple comparisons test.
Figure 3.
Figure 3.. Characterization of persistent HDV infection in hNTCP-BAC NRG mice.
hNTCP-BAC/1.3× HBV HDD NRG (blue, n=8) or hNTCP-BAC/Adv-HBV Env (red, n=5) mice challenged with HDV. HDV RNA in serum (A); HBsAg quantification (B); firefly luciferase quantification in mice over time (C). (D) IVIS image of hNTCP-BAC/AdV HBV Env mouse (left) compared to NRG WT mice (right). (E) HDV genomic RNA (red) and DAPI (blue) visualization by PLAYR technique in HDV-challenged hNTCP-BAC/Adv-HBV Env (left) versus NRG WT (right). Scale bar = 200 nM. (F) Quantification of HDV genomic RNA in hNTCP-BAC/Adv-HBV Env versus NRG WT mice [percent cells HDV RNA positive/slide imaged]. (G) HDV RNA quantification by RT-qPCR in the liver of hNTCP-BAC/1.3× HBV (blue), hNTCP-BAC/Adv-HBV env (red), and NRG WT mice (black). (H) Highlighter plot of ribozyme domain in hNTCP-BAC/1.3× HBV HDD mice at day 3 and day 56 p.i. (red = transversion mutations, light blue = transition mutations). (I) Highlighter plot of HDVAg sequence for hNTCP-BAC/1.3× HBV NRG animals (orange = non-synonymous mutations). All data are represented as ± s.e.m. Statistical significance was as follows: *, p < 0.05; **, p ≤ 0.001, ***, p ≤ 0.001, ****, p ≤ 0.0001, using an ordinary one-way ANOVA with a Bonferroni’s multiple comparisons test.
Figure 4.
Figure 4.. Single and combination therapy with Myrcludex B and Lonafarnib efficiently suppresses HDV viremia in vivo.
(A) Schematic of drug treatment experimental time course. (B) Longitudinal HBsAg ELISA data. (C) Longitudinal analysis of HDV RNA in serum of mock carrier control, LNF, MyrB, and dually treated groups. (D) HDV RNA in liver at the treatment endpoint (18 days post HDV infection, 14 days post drug treatment) (n=6 for each treatment condition). (E) HDV RNA in liver of HDV-challenged hNTCP-BAC NRG mice that had drug treatment stopped (n=4 for each drug condition). All data are represented as ± s.e.m. Statistical significance was as follows: *, p < 0.05; **, p ≤ 0.001, ***, p ≤ 0.001, ****, p ≤ 0.0001, using an ordinary one-way ANOVA with a Bonferroni’s multiple comparisons test.
Figure 5.
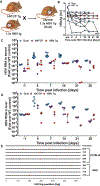
Figure 5.. Characterization of HDV acute infection in immunocompetent hNTCP-BAC C57BL/6 mice.
(A) Schematic of hNTCP-BAC C57BL/6 and 1.3× HBV tg mice crossed to generate hNTCP-BAC/1.3× HBV Tg C57BL/6 mice. (B) HBsAg quantification of hNTCP-BAC/1.3× HBV tg versus HBV tg mice over a month’s time. NEG = indicates the threshold for the assay above which HBsAg levels are considered positive. Normalized HDV RNA in serum (C) and liver (D) of hNTCP-BAC/1.3× HBV tg, hNTCP-BAC tg, and HBV tg animals. (E) Highlighter plot analysis of HDVAg sequences in immunocompetent hNTCP-BAC/1.3× HBV tg C57BL/6 mice (day 14) versus hNTCP-BAC/1.3× HBV NRG mice (day 56) (red= site of mutation). For each time point, hNTCP only (n=4), hNTCP-BAC/1.3× HBV tg (n=4), and HBV tg (n=4) mice were euthanized. All data are represented as ± s.e.m. Statistical significance was as follows: *, p < 0.05; **, p ≤ 0.001, ***, p ≤ 0.001, ****, p ≤ 0.0001, using an ordinary one-way ANOVA with a Bonferroni’s multiple comparisons test.
Figure 6.
Figure 6.. Characterization of histopathology in HDV challenged hNTCP-BAC/1.3× HBV Tg animals.
(A) ALT levels for hNTCP-BAC/1.3× HBV tg, hNTCP-BAC tg, HBV tg, and WT animals. (B) Histopathological analysis of the liver from hNTCP-BAC/1.3× HBV tg and HBV tg animals. Scale bar = 400 μm. (C) Normalized fold change of ISGs MX1, IP-10, OASL2, and PKR in the livers of hNTCP-BAC/1.3× HBV tg animals compared to HBV tg. (D) Cytokine analysis in sera of HDV-challenged hNTCP-BAC/1.3× HBV and HBV tg C57BL/6 animals at days 0, 3, and 14 p.i. Cellular immune response in the spleens of HDV-challenged hNTCP-BAC/1.3× HBV tg, hNTCP Tg, HBV tg, and WT mice: NK cells (E); NKT cells (F); and MAIT cells (G). Frequencies of CD45+ lymphocytes are indicated. Each data point is the average of four different animals. All data are represented as ± s.e.m. Statistical significance was as follows: *, p < 0.05; **, p ≤ 0.001, ***, p ≤ 0.001, ****, p ≤ 0.0001, using an ordinary one-way ANOVA with a Bonferroni’s multiple comparisons test.

References

    1. Rizzetto M, Canese MG, Arico S, Crivelli O, Trepo C, Bonino F, Verme G, Immunofluorescence detection of new antigen-antibody system (delta/anti-delta) associated to hepatitis B virus in liver and in serum of HBsAg carriers. Gut 18, 997–1003 (1977). - PMC - PubMed
    1. Lempp FA, Ni Y, Urban S, Hepatitis delta virus: insights into a peculiar pathogen and novel treatment options. Nature reviews. Gastroenterology & hepatology 13, 580–589 (2016). - PubMed
    1. Shirvani-Dastgerdi E, Tacke F, Molecular interactions between hepatitis B virus and delta virus. World J Virol 4, 36–41 (2015). - PMC - PubMed
    1. Taylor JM, Hepatitis delta virus. Virology 344, 71–76 (2006). - PubMed
    1. Winer BY, Ploss A, Determinants of hepatitis B and delta virus host tropism. Curr Opin Virol 13, 109–116 (2015). - PMC - PubMed

Publication types

MeSH terms

LinkOut - more resources