. 2018 Jul;21(7):941-951.
doi: 10.1038/s41593-018-0175-4. Epub 2018 Jun 27.

A 3D human triculture system modeling neurodegeneration and neuroinflammation in Alzheimer's disease

Affiliations

A 3D human triculture system modeling neurodegeneration and neuroinflammation in Alzheimer's disease

Joseph Park et al. Nat Neurosci. 2018 Jul.

Abstract

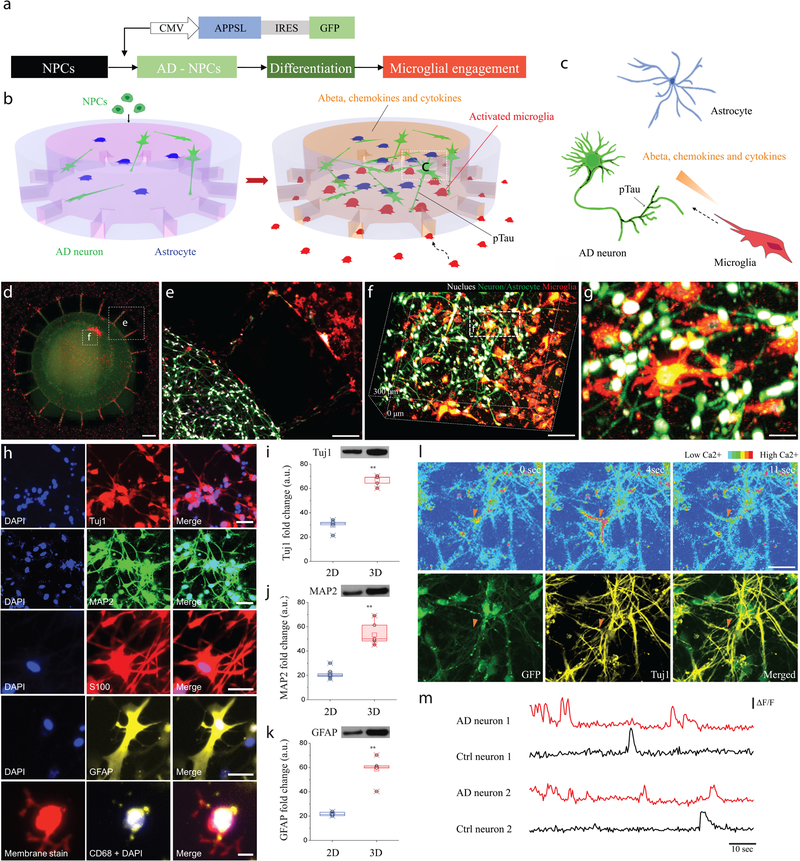
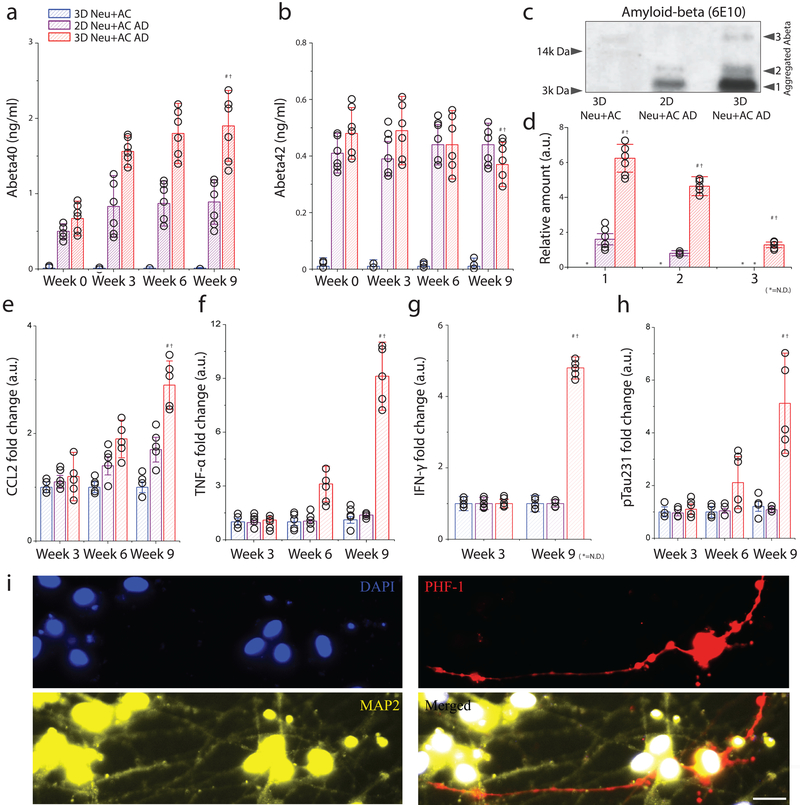
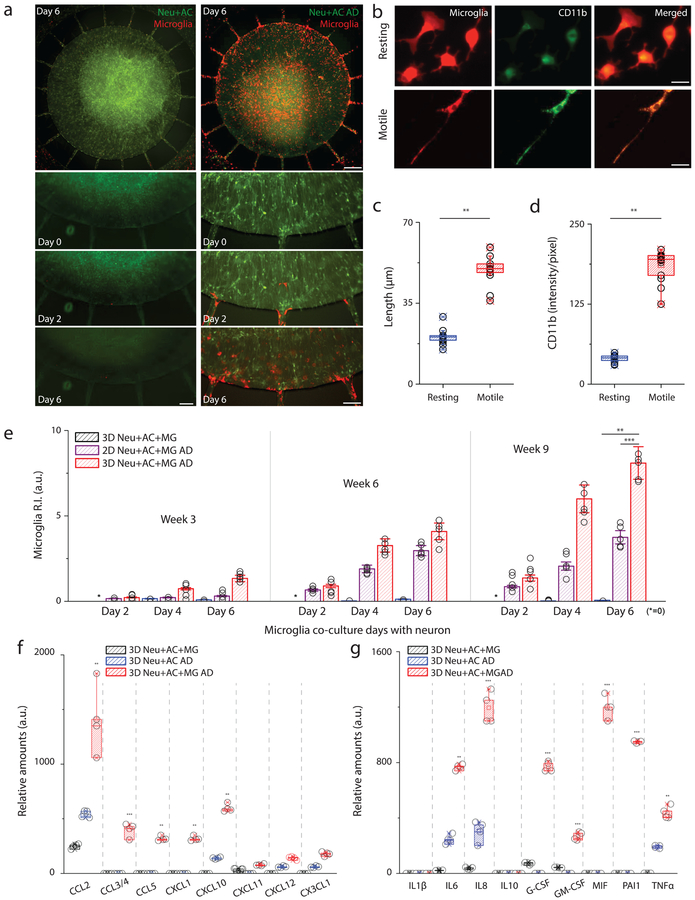
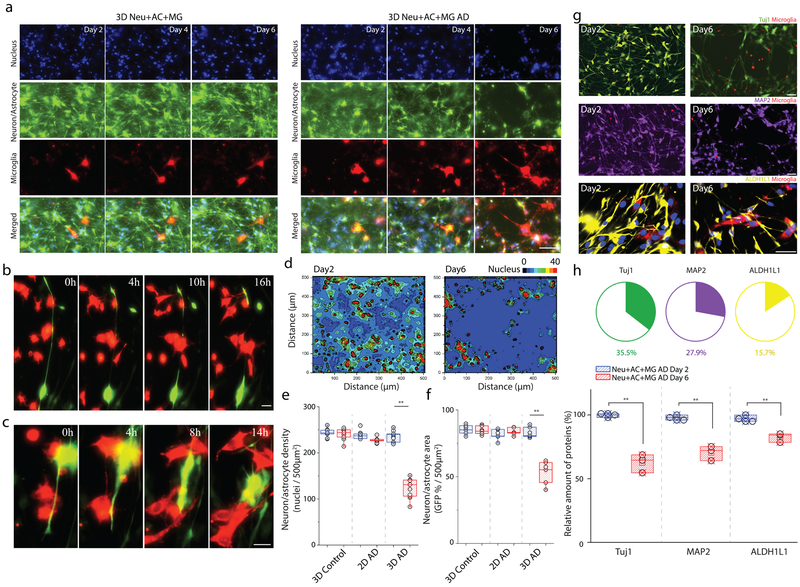
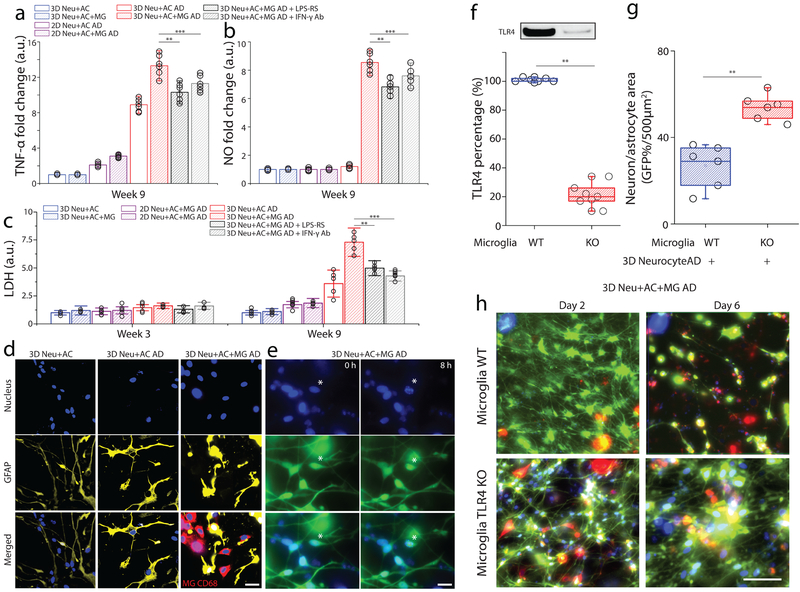
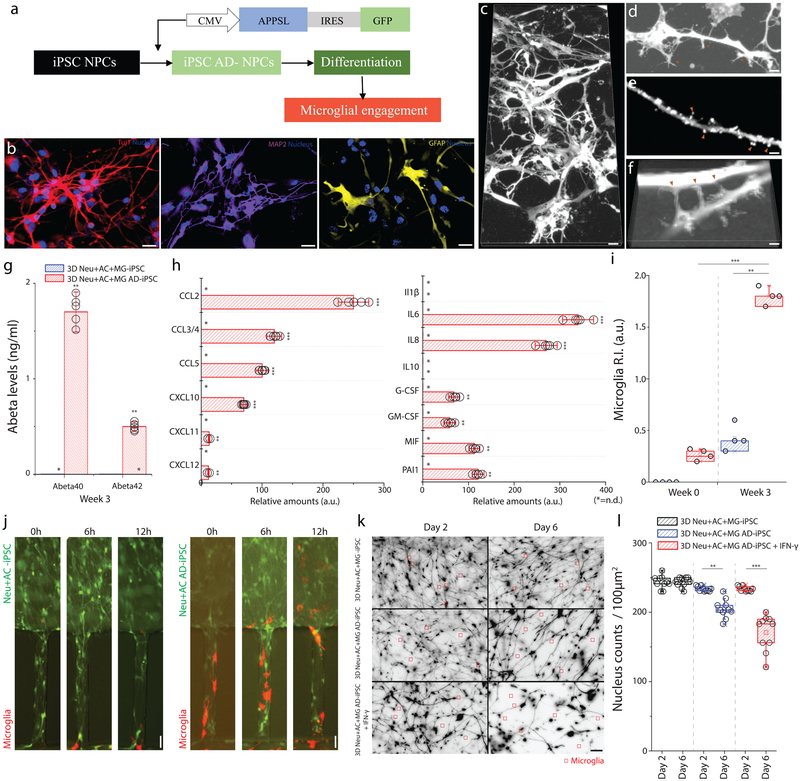
Alzheimer's disease (AD) is characterized by beta-amyloid accumulation, phosphorylated tau formation, hyperactivation of glial cells, and neuronal loss. The mechanisms of AD pathogenesis, however, remain poorly understood, partially due to the lack of relevant models that can comprehensively recapitulate multistage intercellular interactions in human AD brains. Here we present a new three-dimensional (3D) human AD triculture model using neurons, astrocytes, and microglia in a 3D microfluidic platform. Our model provided key representative AD features: beta-amyloid aggregation, phosphorylated tau accumulation, and neuroinflammatory activity. In particular, the model mirrored microglial recruitment, neurotoxic activities such as axonal cleavage, and NO release damaging AD neurons and astrocytes. Our model will serve to facilitate the development of more precise human brain models for basic mechanistic studies in neural-glial interactions and drug discovery.


Conflict of interest statement

Competing Financial Interests Statement

The authors declare no competing interests.

Figures

Figure 1.
Figure 1.. Construction of a 3D organotypic human AD culture model (3D NeuroGliAD: 3D Neu+AC+MG AD): a tri-culturing system of AD neurons, astrocytes differentiated from human neural progenitor cells (hNPCs), and human adult microglia in a 3D microfluidic platform.
(a) Schematic of differentiation of NPCs to AD Neuron/astrocyte and microglial engagement. Schematics describe multicellular 3D layouts in (b) a microfluidic human AD culture model and (c) a human AD brain tissue. (d) Fluorescent Microphotographs show the layout of human AD neuron+astrocyte (green) in a central chamber (CC) and microglia (red) in an angular chamber (AC). (e) Microglia are recruited across micro-channels between the CC and the AC by soluble factors from the AD culture cells. (f-g) Representative confocal microphotographs in the CC highlight the physiological 3D cellular engagement of neurons (green), astrocyte (green), and microglia (red) with nuclear staining (white). (h) Immunofluorescent microphotographs validate the differentiated neurons (blue: nucleus) with class III beta-tubulin Tuj1 (red) and MAP2 (green), astrocytes (blue: nucleus) with S100 (red) and GFAP (yellow), and the recruited microglia (blue: nucleus, red: pre-stained membrane) with CD68 (yellow). (i-k) Western blots assay demonstrates the increased expression of neuronal (Tuj1; left; df: t=9.105, df=5.24, R squared = 0.9405, F = 41.68, p=0.0009, ndevice= 20 from 3 week 1:1 thick culture condition; MAP2; middle; df: t=25.64, df=7.526, R squared = 0.9887, F = 1.67, p=0.0027, ndevice= 20 from 3 week 1:1 thick culture condition) and astrocyte markers (GFAP; right; df: t=12.58, df=7.828, R squared = 0.9529, F = 1.349, p=0.0019, ndevice= 20 from 3 week 1:1 thick culture condition) of the 3D culture system compared to a 2D culture after 3-week of differentiation. Data are normalized to undifferentiated hNPCs. All experiments were repeated ≥ 3 times. (l) Time-lapse microphotographs show calcium signaling with Cal590 fluorescent dyes from firing neurons (top, red triangle) and are compared with immunostained neuronal marker of Tuj1 in yellow and membrane in green (bottom). (m) Normalized values (ΔF/F) from neurons representative for control and the AD model after 3-week of differentiation indicate functionally connected neuronal activities All experiments were repeated ≥3 times: unpaired, two-sided Student’s t-test; **P < 0.01; All parameters are presented as the mean ± SEM. Scale bars: 250 μm in (d, e), 100 μm in (f), 40 μm in (g), 40 μm for Tuj1 and MAP2, 20 μm for S100, GFAP and CD68 in (h), 50 μm in (l), respectively.
Figure 2.
Figure 2.. Recapitulation of pathological AD signatures: amyloid beta, phosphorylated tau, and IFN-γ in the 3D human AD neuron model (3D Neu+AC AD).
(a) Soluble Aβ 40 and (b) Aβ 42 were measured after 0-, 3-, 6-, and 9-week of differentiation in a 3D control (3D Neu+AC; blue), a 2D AD model (2D Neu+AC AD; purple), and a 3D AD model (3D Neu+AC AD; red), respectively. ndevice= 6 from 3 week 1:1 thick culture condition (c) Western blot analysis confirms the presence of SDS-resistant Aβ multimeric forms in 3D Neu+AC AD. All experiments were repeated ≥3 times (d) Quantification of elevated levels of multiple forms shown in Fig. 3c (F(DFn,DFd) = F(2,9) = 530.6, SS= 6.438). Noticeable increases of (e) CCL2 (R square =0.9804, F (2, 12) = 300.6), (f) TNF-α were observed in the 3D Neu+AC AD model (R square=0.9953, F (2, 12) = 1271). (g) IFN-γ (R square=0.7584, F (2, 12) = 18.84), (h) soluble p-tau (pSer231 tau, R square=0.9235, F (2, 12) = 72.39), and (i) p-tau accumulation (PHF-1; red) in neuronal cell body and neurites (green) were observed only after 9 weeks in the 3D Neu+AC AD model. All experiments were repeated ≥3 times: One-way ANOVA with Tukey–Kramer test; Statistical significance is denoted by # 3D Neu+AC week9 vs 3D Neu+AC ADweek9, † 2D Neu+AC+MG ADweek9 vs 3D Neu+AC+MG ADweek9, P < 0.001 with numberdevice = 5 in (a-h). Scale bar: 25 μm in (i).
Figure 3.
Figure 3.. Activation of microglial inflammation: morphogenesis, marker expression, recruitment and inflammatory mediator release.
(a) Time-lapse microphotographs show microglial (red) recruitment by AD neuron+astrocyte (Neu+AC AD, green) compare to a control (Neu+AC, green). (b) Microglia are ramified (resting) on day 0 in the annular chamber (AC), become elongated (motile) on day 2, and migrate along the micro-channels toward the central chamber (CC). All experiments were repeated ≥3 times. Both the (c) length and (d) level of CD11b expression increase in the motile microglia (F (1, 14) = 564.7), All experiments were repeated ≥3 times: unpaired, two-sided Student’s t-test, ncells= 10 at Day4 culture condition. (e) Tri-culture in the 3D AD model (red, 3D Neu+AC+MG AD) leads to a dramatic increase in microglia recruitment as measured by the total number of microglia accumulated in the CC compared to the 3D control (blue, 3D Neu+AC+MG) and the 2D AD model (purple, 2D Neu+AC+MG AD) (R-square=0.9745, F (2, 12) = 228.9), All experiments were repeated ≥3 times: unpaired, Two-way ANOVA tests, ndevice= 5 at each culture condition. The 3D Neu+AC+MG AD also produced discernable amounts of (f) chemokines and (g) pro-inflammatory soluble factors (F (7, 21) = 115.6). All experiments were repeated ≥3 times, Two-way ANOVA tests, ndevice= 4 at each culture condition; Statistical significance is denoted by **P < 0.001, ***P < 0.0001 with numberdevice = 5 in (a), numbercell = 100 in (b, c, d), numberdevice = 5 in (e, f, g), respectively. n.s. stands for non-significant. All parameters are presented as the mean ± SEM. Scale bars: 25 μm (left) and 200 μm (right) in (a), 10 μm in (b), respectively.
Figure 4.
Figure 4.. Exacerbated neuronal damage through the interactions with reactive microglial cells.
Time-lapse microphotographs highlight the neurotoxic interactions among recruited microglia (red) and AD neurons/astrocytes (green) with nucleus staining (blue) in a real time: (a) gradual depletion of neurons/astrocytes from day 2 to day 6, (b) axonal cleavage, (c) and retraction of neuronal neurite (16 hours of observation) in microglial co-localizing regions of interest (ROI) of 3D Neu+AC+MG AD model compared to a control of 3D Neu+AC+MG. (d) Localized neuronal damage proximate to the recruited microglia is visualized on a contour heat map. All experiments were repeated ≥3 times Neuronal loss is quantified by measuring (e) the number of nucleus, (f) GFP-overlaying surface area of neurons/astrocytes in the 3D Neu+AC (3D control), the 2D Neu+AC AD (2D AD), and 3D Neu+AC AD (3D AD) in the absence (blue) and the presence of microglia (red). nimages= 20 & ndevice= 5 at each culture condition (g) Cell types are identified by immunostaining specific markers (Tuj1: green, MAP2: purple, ALDH1L1: yellow) and (h) the amounts of surviving neurons/astrocytes are compared between day 2 and day 6 after microglial recruitment (F (1, 6) = 95.12). Two-way ANOVA with Tukey–Kramer test; Statistical significance is denoted by **, P<0.0001 with numberimages = 20 in (d-f), numberdevice = 5 in (d-f, h), respectively. All parameters are presented as the mean ± SEM. Scale bars: 80 μm in (a), 10 μm in (b), 10 μm in (c), 80 μm (Tuj1 and MAP2) 10 μm (GFAP) in (g), respectively.
Figure 5.
Figure 5.. Assessment of neurotoxic neuron-glia interactions mediated by TLR4 and IFN-γ receptor.
In a tri-culture, 3D Neu+AC+MG AD express elevated levels of (a) TNF-α and (b) NO compared to the control (3D Neu+AC+MG and 2D/3D Neu+AC AD) and treatment using either TLR4 antagonist or blocking IFN-γ antibody reduced the concentrations of TNF-α and NO (R-square=0.9024, F(DFn, DFd)=1.061(4, 10), F= 23.11), All experiments were repeated ≥3 times, Two-way ANOVA. (c) In the 3D Neu+AC+MG AD after 9-week of differentiation, neurotoxic interactions were mimicked by LDH concentrations (R-square=0.7104, F (1, 14) = 15.65); the damage was attenuated through inhibition using a TLR4 antagonist and a blocking IFN-γ antibody (f, R-square=0.8954, F (1, 14) = 22.61). (d) Immunostaining of the astrocyte marker GFAP (yellow) and microglial CD68 (red) demonstrated the activation of astrocytes and microglia in 3D Neu+AC AD and 3D Neu+AC+MG AD compared to 3D Neu+AC. (e) Apoptotic cells with fragmented nuclei observed after 8h in 3D Neu+AC+MG AD. (f) Immunoblot and quantification of proteins isolated from WT and TLR4 knock-down microglia. Fold change was determined by normalizing TLR4 band intensity to Actin band (R-square=0.8934, F (1, 3) = 21.65). Reduced neuron+astrocyte loss was (g) measured with GFP-overlaying surface area (R-square=0.8240, F (1, 3) = 19.25) and (h) visualized with fluorescent microphotographs in 3D Neu+AC AD with TLR4-KO microglia. All experiments were repeated ≥3 times. Two-way ANOVA test; Statistical significance is denoted by # IFN-γ vs IFN-γ + Aβ, † Aβ vs IFN-γ + Aβ, #* IFN-γ + Aβ vs IFN-γ + Aβ + TLR4 Ab, †* IFN-γ + Aβ vs IFN-γ + Aβ + LPS-RS P<0.0002 and **p<0.001, ***p<0.0001with numberwell = 5 in (a, b), numberdevice = 5 in (c, d, e), respectively. All parameters are presented as the mean ± SEM. Scale bars: 10 μm in (d), 5 μm in (i) 40 μm in (i), respectively.
Figure 6.
Figure 6.. Neuron-glia interactions recapitulated with human iPSC-derived AD neurons/astrocytes.
(a) Schematics describe the procedure used to generate iPSC-AD NPCs and illustrate the plating. (b) Immunofluorescent microphotographs validate the differentiated neuron (blue: nucleus) with class III beta-tubulin Tuj1 (red) and MAP2 (purple), astrocytes (blue: nucleus) with GFAP (yellow) following 3-week of differentiation. (c) Representative microphotographs of differentiated neurons/astrocytes show (d) protrusion of dendritic spines, (e) synaptic boutons, and (f) connections. (g) 3D Neu+AC+MG AD-iPSC express elevated levels of Aβ40 and Aβ42 compared to the control (3D Neu+AC+MG -iPSC) (F (2, 4) = 125.6), All experiments were repeated ≥3 times. (h) The 3D Neu+AC+MG AD-iPSC also produces discernable amounts of chemokines (left) and pro-inflammatory soluble factors (right) (F (1, 22) = 321.3). (i-j) Tri-culture in 3D Neu+AC+MG AD-iPSC (red bars in i, right microphotographs in j) leads to a dramatic increase in microglia recruitment as measured by the total number of microglia accumulated in the CC compared to the 3D control (blue bars in i, left microscopic images in j) (R-square=0.7954, F (2, 12) = 199.7), All experiments were repeated ≥3 times: unpaired, Two-way ANOVA tests, ndevice= 5 at each culture condition. (k) Representative microscopic images show the reduced density of neurons/astrocytes tri-cultured with microglia (red square) after microglial engagement for 2 days and 6 days. (l) The amounts of surviving neurons/astrocytes are measured in 3D Neu+AC AD-iPSC treated with IFN-γ compared with untreated controls (3D Neu+AC+MG -iPSC, 3D Neu+AC AD-iPSC) ((R-square=0.9731, F (1, 10) = 17.45)). Two-way ANOVA test; Statistical significance is denoted by **p<0.001, ***p<0.0001 with numberdevice = 5 in (g, h, i). All parameters are presented as the mean ± SEM. Scale bars: 20 μm in (b, c, k), 5 μm in (d, e, f), 10 μm in (j), respectively.

Comment in

References

    1. 2016 Alzheimer’s disease facts and figures. Alzheimer’s & Dementia 12, 459–509 (2016). - PubMed
    1. Tanzi RE & Bertram L Twenty Years of the Alzheimer’s Disease Amyloid Hypothesis: A Genetic Perspective. Cell 120, 545–555 (2005). - PubMed
    1. Karran E & De Strooper B The amyloid cascade hypothesis: are we poised for success or failure? Journal of Neurochemistry 139, 237–252 (2016). - PubMed
    1. A Armstrong R A critical analysis of the ‘amyloid cascade hypothesis’. Folia Neuropathologica 3, 211–225 (2014). - PubMed
    1. Paquet D et al. Efficient introduction of specific homozygous and heterozygous mutations using CRISPR/Cas9. Nature 533, 125–129 (2016). - PubMed

Publication types