. 2018 Jun 27;9(1):2502.
doi: 10.1038/s41467-018-04774-9.

mTORC1 accelerates retinal development via the immunoproteasome

Affiliations

mTORC1 accelerates retinal development via the immunoproteasome

Ji-Heon Choi et al. Nat Commun. .

Abstract

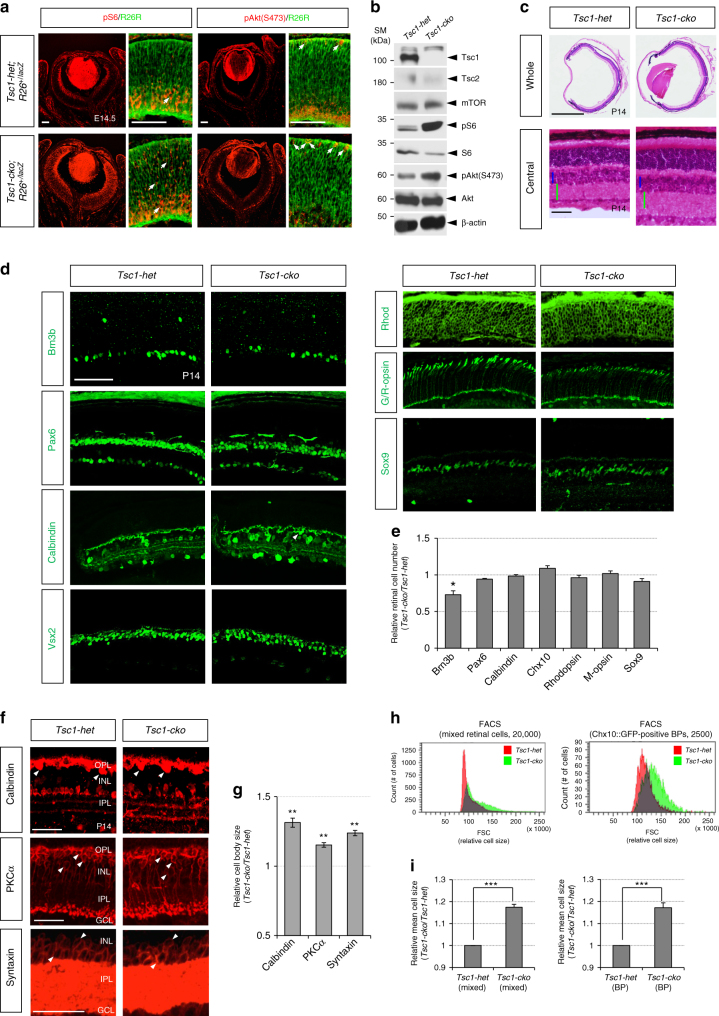
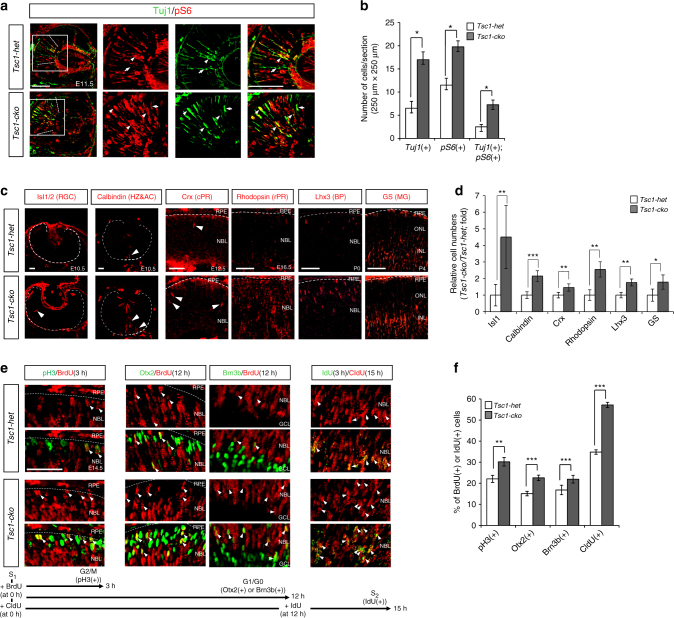
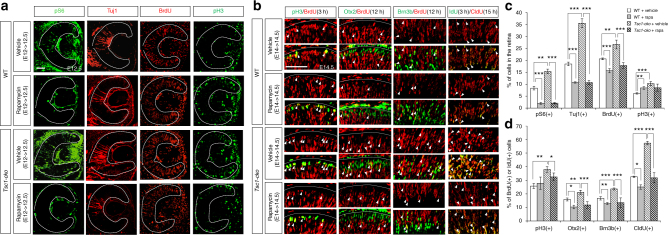
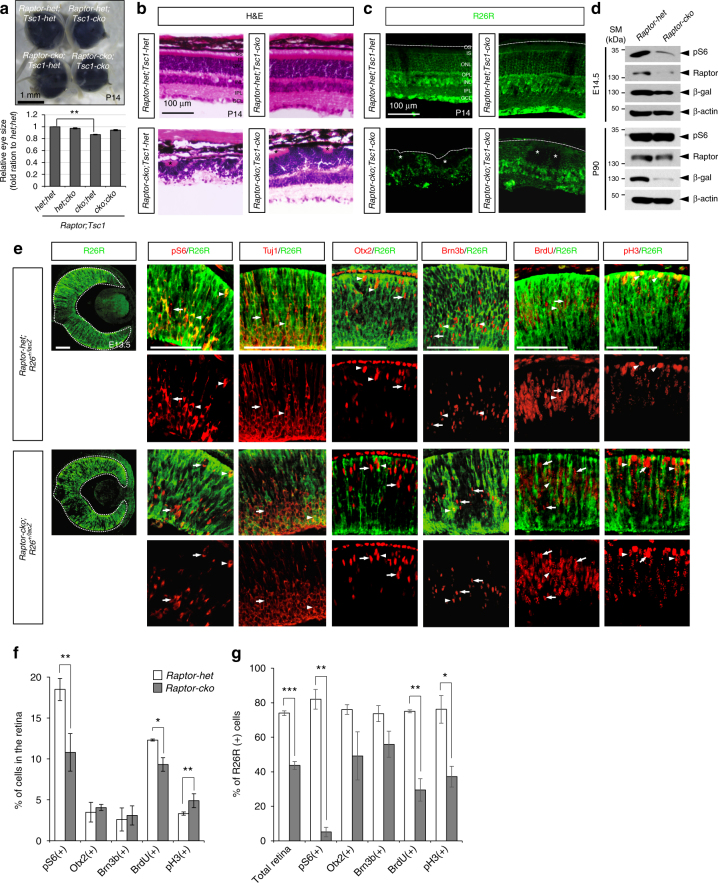
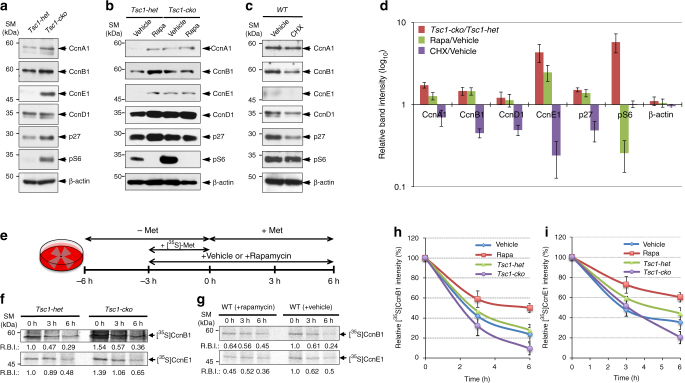
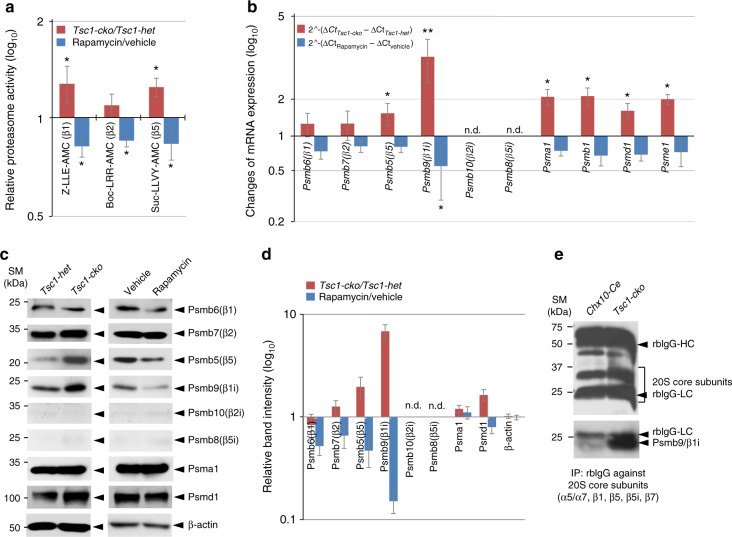
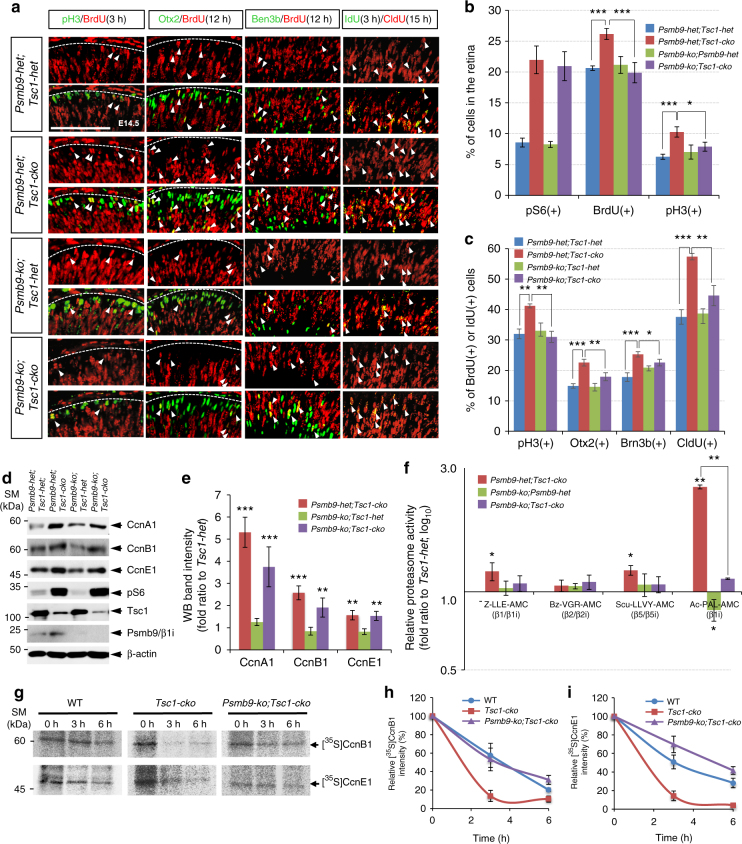
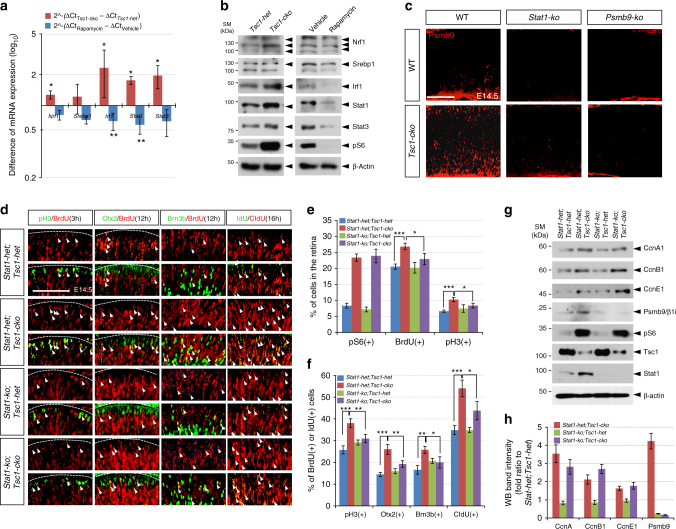
The numbers and types of cells constituting vertebrate neural tissues are determined by cellular mechanisms that couple neurogenesis to the proliferation of neural progenitor cells. Here we identified a role of mammalian target of rapamycin complex 1 (mTORC1) in the development of neural tissue, showing that it accelerates progenitor cell cycle progression and neurogenesis in mTORC1-hyperactive tuberous sclerosis complex 1 (Tsc1)-deficient mouse retina. We also show that concomitant loss of immunoproteasome subunit Psmb9, which is induced by Stat1 (signal transducer and activator of transcription factor 1), decelerates cell cycle progression of Tsc1-deficient mouse retinal progenitor cells and normalizes retinal developmental schedule. Collectively, our results establish a developmental role for mTORC1, showing that it promotes neural development through activation of protein turnover via a mechanism involving the immunoproteasome.


Conflict of interest statement

The authors declare no competing interests.

Figures

Fig. 1
Fig. 1
Normal cell composition but neuronal enlargement of Tsc1-cko mouse retina. a Distribution of cells underwent Cre-mediated deletion of Tsc1 gene in E14.5 Tsc1-cko;R26+/lacZ mouse retina was visualized indirectly by immunodetection of ß-galactosidase (ß-gal), which is expressed from a lacZ gene at Cre-recombined R26R locus. Activities of mTORC1 and mTORC2 in the retinas were also measured by immunodetection of pS6 and pAkt(S473), respectively. Scale bars, 100 μm. b Relative levels of mTOR pathway components in the mouse retinas were examined by western blotting (WB) with antibodies against corresponding proteins. SM size marker. c Hematoxylin and eosin (H&E) staining images of P14 Tsc1-het and Tsc1-cko littermate mouse retinal sections. Sizes of blue and green bars in two bottom images are same. Scale bars, 100 μm. d P14 littermate mouse eye sections were stained with antibodies that recognize Brn3b (RGC), Pax6 (AC), Calbindin (AC subset and HZ [arrowheads]), Chx10 (BP), Rhodopsin (Rhod; rPR), green/red-opsin (G/R-opsin; cPR), and Sox9 (MG). Scale bars, 200 μm. e Relative numbers of cells expressing the markers in the Tsc1-cko retinas were obtained by comparing with those in the Tsc1-het retinas. Numbers of retina analyzed are 4 (from 3 independent litters). f HZ, rod BP, and AC cells in P14 Tsc1-het and Tsc1-cko littermate mouse retinas are visualized by immunostainings with antibodies detecting respective markers Calbindin, protein kinase C-α (PKCα), and Syntaxin. Arrowheads indicate cell bodies of those retinal neurons. g Average area of the neuronal cell body in P14 Tsc1-cko mouse retinas was compared with that of littermate Tsc1-het mouse retinas. Values are averages of 200 cells in 4 different mouse retinas collected from 3 independent litters. h (Left) P14 Tsc1-het and Tsc1-cko mouse retinal cells were analyzed by FACS to compare their relative cell sizes by measuring forward scatter (FSC) values. (Right) Relative sizes of Chx10::GFP-positive bipolar cells in those littermate mouse retinas were also compared by measuring FSC values. i Mean sizes of the cells in the Tsc1-cko mouse retinas were obtained and shown in a graph as relative values to Tsc1-het samples (n = 3). Error bars in the graphs denote standard deviations (SD). P-values are obtained by Student’s t-test and shown in the graphs (*<0.05; **<0.01; ***<0.001)
Fig. 2
Fig. 2
mTORC1 activation accelerates RPC cell cycle and retinal development. a E11.5 Tsc1-het and Tsc1-cko littermate mouse retinal sections (coronal, 12 μm) were co-stained with mouse anti-tubulin-βIII antibody (Tuj1; green) and rabbit anti-pS6 antibody (red). Images in three right columns are corresponding to the lined boxes in the left. Dotted lines indicate dorsal (top) and ventral (bottom) margins of Tuj1-positive cell population. Scale bar, 100 μm. b Numbers of stained retinal cells in an area (250 μm × 250 μm) were shown in a graph. Numbers (n) of retinas analyzed are 5 obtained from 3 independent litters. c Distribution of retinal neurons in littermate Tsc1-het and Tsc1-cko mouse retinas at corresponding time points, when each retinal subtype is produced prominently, was analyzed by immunostainings of various cell type-specific markers. Dotted lines mark retina-RPE borders. Arrowhead indicates marker-positive post-mitotic neurons. Scale bar, 100 μm. d Relative numbers of retinal cells in the Tsc1-cko mice were compared with those in Tsc1-het mice and shown in a graph. Numbers of samples analyzed are 6 (E10.5, E12.5 and E16.5) and 4 (P0 and P4) prepared from 4 and 3 independent litters, respectively. e Pregnant female mice were injected with BrdU (5 mg/kg) at 3 h (for pH3 co-staining) or 12 h (for Otx2 or Brn3b co-staining) prior to the collection of embryos at 14.5 dpc. Alternatively, mice were injected with CldU and IdU at 15 and 3 h prior to the collection of the embryos, respectively. Retinal sections were then co-stained with rat anti-BrdU (red) and corresponding rabbit antibodies (green) for the former analyses, and mouse anti-CldU (green) and rabbit anti-IdU (red) antibodies for the latter analysis. Arrowheads indicate cells co-expressing BrdU and corresponding markers. Scale bar, 50 μm. f Ratio of BrdU-co-expressing cells to total marker-expressing cells was obtained from 5 different samples from 3 independent litters and shown in a graph. Values in the graph are average and error bars are SD. P-values are obtained by Student’s t-test and shown in the graphs (*<0.05; **<0.01; ***<0.001)
Fig. 3
Fig. 3
mTORC1 inhibition by rapamycin inhibits RPC cell cycle and retinal development. a Pregnant mice were injected with vehicle (see Methods) or rapamycin (5 mg/kg) into the peritoneum at 12 dpc, and the embryos were collected at 12.5 dpc (E12.5). BrdU were injected at 3 h prior to the embryo collection. Distribution of each marker in the embryonic retinas was investigated by immunostaining with corresponding antibodies. Dotted lines mark retinal margins. Scale bar, 100 μm. b Cell cycle progression of embryonic RPCs in the rapamycin-injected mice was examined as described in Fig. 2f. Scale bar, 100 μm. c Percentages of cells expressing the markers in a are shown in a graph. Values are averages (n = 5 from 3 independent litters) and error bars denote SD. d Ratios of BrdU-co-expressing cells to total marker-expressing cells are shown in a graph (n = 5 from 3 independent litters). Error bars denote SD. P-values are obtained by one-way ANOVA test and shown in the graphs (*<0.05; **<0.01; ***<0.001)
Fig. 4
Fig. 4
Raptor-deficient RPC fails to progress cell cycle. a Top, images of P30 Raptor-het;Tsc1-dhet, Raptor-het;Tsc1-cko, Raptor-cko;Tsc1-het, and Raptor-cko;Tsc1-cko littermate mouse eyes. Bottom, relative eye sizes are shown in a graph by comparing average diameter of the eyes. Number of eyes measured the size is 8 (Raptor-het;Tsc1-het and Raptor-het;Tsc1-cKO), 6 (Raptor-cko;Tsc1-het), and 5 (Raptor-cko;Tsc1-cko). **P-value < 0.01 (ANOVA test). b H&E staining images of P14 Raptor-het;Tsc1-het, Raptor-het;Tsc1-cko, Raptor-cko;Tsc1-het, and Raptor-cko;Tsc1-cko littermate mouse retinal sections. c Distribution of Raptor-deficient cells in P14 littermate mouse retina was visualized indirectly by immunodetection of R26R, which is expressed from Cre-recombined R26lacZ loci. d Levels of pS6, Raptor, and R26R (ß-gal) in E14.5 and P90 Raptor-het and Raptor-cko littermate mouse retinas were compared by WB with corresponding antibodies. Relative amounts of protein loaded in each lane were determined by WB detection of ß-actin. e Distributions of retinal markers in E13.5 Raptor-het;R26R+/lacZ and Raptor-cko;R26R+/lacZ littermate mouse embryonic retinas were examined by immunostaining with corresponding antibodies. The R26R-positive cells (green) are potentially the Raptor-deficient cells. BrdU was injected to pregnant mice at 3 h prior to embryo collection. Arrows and arrowheads indicate R26R-negative and R26R-positive cells that express specific markers (red), respectively. Scale bar, 100 μm. f Percentage of retinal cells expressing each marker in the retinas was provided in a graph (representative images are shown in Supplementary Fig. 7). g Ratios of R26R co-expressing cells to total marker-expressing cells in a are shown in a graph. Numbers of samples used for obtaining graphs in b and c are 4 (from 3 independent litters); error bars denote SD. P-values are obtained by Student’s t-test and shown in the graphs (*<0.05; **<0.01; ***<0.001)
Fig. 5
Fig. 5
Cyclin turnover in RPC is sensitive to mTORC1 activity. a Proteins (20 μg) of cell lysates of E14.5 Tsc1-het and Tsc1-cko littermate mouse retinas were analyzed by WB with corresponding antibodies. Alternatively, pregnant mice can produce either Tsc1-het or Tsc1-cko mice were injected with vehicles (control in b and c), rapamycin (5 mg/kg; b), or cycloheximide (CHX; 5 mg/kg; c) at 14 dpc prior to collecting the embryonic retina at 14.5 dpc for WB analyses. d Image pixels of WB bands were calculated by the ImageJ software and relative intensities were obtained by comparing the pixel numbers with those of control samples (Tsc1-het retina for Tsc1-cko; vehicle-injected retinas for rapamycin and CHX). Values are average measurements of 3 independent WB results. Error bars denote SD. e Experimental schedule for labeling and chasing of newly synthesized cyclin proteins in mouse retinal explants. E13.5 littermate retinal explants were incubated in methionine (Met)-free growth media for 3 h and then added with [35S]-Met (250 μCi/ml) for 3 h to label newly synthesized proteins in the retinas. The explants were then incubated in normal growth media containing unlabeled Met for the indicated time. For the analysis in g, WT C57BL6/J mouse retinal explants were added with growth media containing vehicle or rapamycin as indicated. f, g CcnB1 and CcnE1 in the retinal explants were isolated by immunoprecipitation with corresponding antibodies and the immunoprecipitates were analyzed by 10% SDS-PAGE followed by detection of radioactivities of [35S]-labeled protein bands using BAS-7000 (Fuji Inc.). Relative band intensities (RBI) of [35S]-CcnB1 and [35S]-CcnB1 were obtained by comparing the image pixel numbers [35S]-CcnB1 and [35S]-CcnB1 bands of each sample with Tsc1-het (f) and vehicle-treated (g) samples at time 0 (0 h) using ImageJ software, and presented below the band images. To examine the decay rates of [35S]-labeled CcnB1 (h) and CcnE1 (i) in Tsc1-cko and rapamycin-treated mouse retinas, relative intensities against the values at 0 h were obtained and shown in the graphs. The values are average band intensity obtained from 4 independent experiments. Error bars denote SD
Fig. 6
Fig. 6
mTORC1-induced developmental acceleration of the retina requires an immunoproteasome subunit Psmb9. a The 20S proteasomes were purified from E14.5 Tsc1-het and Tsc1-cko littermate mouse retinas by 20S Proteasome Purification Kit® (Enzo Life Sciences), and caspase-like (β1/β1i), trypsin-like (β2/β2i), and chymotrypsin-like (β5/β5i) activities of the purified proteasomes were analyzed by measuring fluorescent intensities produced by cleaved peptide substrates Z-LLE-AMC (β1/β1i), Bz-VGF-AMC (β2/β2i), and Scu-LLVY-AMC (β5/β5i) (see details in Methods). The values are averages and error bars denote SD (n = 3; 3 independent litters). b Relative mRNA levels of 20S proteasome subunits in E14.5 Tsc1-cko and rapamycin-treated mouse retinas were obtained by comparing real-time quantitative PCR (RT-qPCR) values with those of Tsc1-het and vehicle-treated mouse retinas at the same age. The values are averages obtained by 6 (Tsc1-cko/Tsc1-het) and 7 (rapamycin/vehicle) independent measurements with mRNA isolated from 4 (Tsc1-cko/Tsc1-het) and 6 (rapamycin/vehicle) independent batches. c Relative levels of 20S proteasome subunit proteins in the mouse retinas were also examined by WB with corresponding antibodies. d Image pixels of WB bands in Tsc1-cko samples were calculated by the ImageJ software and relative intensities were obtained by comparing the pixel numbers with those Tsc1-het samples. Values are average measurements of 4 independent WB results. e Incorporation of Psmb9 into the proteasome was examined by WB detection of Psmb9 in 20S proteasome core complex, which was isolated by the 20S Proteasome Purification Kit. P-values are obtained by Student’s t-test and shown in the graphs (*<0.05; **<0.01)
Fig. 7
Fig. 7
Psmb9 is necessary for the accelerated cyclin turnover in Tsc1-cko RPC. a Cell cycle progression of RPCs in E14.5 mouse retinas with combinatorial Tsc1-cko and Psmb9-ko alleles was examined as described in Fig. 2f. Scale bar, 100 μm. b Average percentage of cells expressing each marker in the retinas was provided in a graph (representative images are shown in Supplementary Fig. 12a). c Ratio of BrdU-co-expressing cells to total marker-expressing cells in (a) was also shown in a graph. Numbers of mice used for b and c are 4 (Tsc1-cko;Psmb9-ko) or 5 (the rest genotypes) and from 4 independent litters; error bars denote SD. d Retinal cell lysates (20 μg proteins/lane) obtained from E14.5 littermate mouse embryos were analyzed by WB with corresponding antibodies. e Image pixels of WB bands in each retinal sample were calculated by ImageJ software and relative intensities were obtained by comparing the pixel numbers with those of Psmb9-het;Tsc1-het samples. Values are average measurements of 3 independent WB results. Error bars denote SD. f Activities of the purified proteasomes were analyzed as described in Fig. 6a. The values are averages and error bars denote SD (n = 4; 2 independent litters). g Synthesis and degradation of CcnB1 in the mouse retinas were analyzed by [35S]-Met pulse labeling and chasing experiments explained in Fig. 5e. Relative radioactivities of [35S]-labeled CcnB1 (h) and CcnE1 (i) bands in the retinal explants were obtained by comparing corresponding bands at 0 h. The values are average obtained from 3 independent experiments. Error bars denote SD. P-values are obtained by one-way ANOVA test and shown in the graphs (*<0.05; **<0.01; ***<0.001)
Fig. 8
Fig. 8
mTORC1 mediates Stat1 to induce Psmb9 in RPCs. a Relative mRNA levels of transcription factors, which have been known as regulators of proteasome subunit expression, , , in E14.5 Tsc1-cko and rapamycin-treated mouse retinas were obtained by comparing RT-qPCR values with those of Tsc1-het and vehicle-treated mouse retinas at the same age. Error bars denote SD (n = 5). b The transcription factor proteins in E14.5 mouse retinas were analyzed by WB with corresponding antibodies. Multiple bands of Nrf1 are products of glycosylation. c Distribution of Psmb9 in E14.5 mouse retinas with indicated genotypes was examined by immunostaining with anti-Psmb9 antibody. Scale bar, 100 μm. d Cell cycle progression of RPCs in E14.5 mouse retinas with combinatorial Tsc1-cko and Psmb9-ko alleles was examined as described in Fig. 2f. Scale bar, 100 μm. e Average percentage of cells expressing each marker in the retinas was provided in a graph. f Ratio of BrdU-co-expressing cells to total marker-expressing cells in d was also shown in a graph. Numbers of mice used are 4 and from 3 independent litters; error bar denotes SD. g Retinal cell lysates (20 μg proteins/lane) obtained from E14.5 littermate mouse embryos were analyzed by WB with corresponding antibodies. h Image pixels of WB bands in each retinal sample were calculated by ImageJ software and relative intensities were obtained by comparing the pixel numbers with those of Stat1-het;Tsc1-het samples. Values are average measurements of 3 independent WB results. Error bars denote SD. P-values are obtained by one-way ANOVA test and shown in the graphs (*<0.05; **<0.01; ***<0.001)

References

    1. Cepko C. Intrinsically different retinal progenitor cells produce specific types of progeny. Nat. Rev. Neurosci. 2014;15:615–627. doi: 10.1038/nrn3767. - DOI - PubMed
    1. Bjornsson CS, Apostolopoulou M, Tian Y, Temple S. It takes a village: constructing the neurogenic niche. Dev. Cell. 2015;32:435–446. doi: 10.1016/j.devcel.2015.01.010. - DOI - PMC - PubMed
    1. Alexiades MR, Cepko C. Quantitative analysis of proliferation and cell cycle length during development of the rat retina. Dev. Dyn. 1996;205:293–307. doi: 10.1002/(SICI)1097-0177(199603)205:3<293::AID-AJA9>3.0.CO;2-D. - DOI - PubMed
    1. Sicinski P, et al. Cyclin D1 provides a link between development and oncogenesis in the retina and breast. Cell. 1995;82:621–630. doi: 10.1016/0092-8674(95)90034-9. - DOI - PubMed
    1. Das G, Choi Y, Sicinski P, Levine EM. Cyclin D1 fine-tunes the neurogenic output of embryonic retinal progenitor cells. Neural Dev. 2009;4:15. doi: 10.1186/1749-8104-4-15. - DOI - PMC - PubMed

Publication types

MeSH terms

Substances