. 2018 Jul;559(7712):109-113.
doi: 10.1038/s41586-018-0257-1. Epub 2018 Jun 27.

Parasitic helminths induce fetal-like reversion in the intestinal stem cell niche

Affiliations

Parasitic helminths induce fetal-like reversion in the intestinal stem cell niche

Ysbrand M Nusse et al. Nature. 2018 Jul.

Erratum in

Abstract

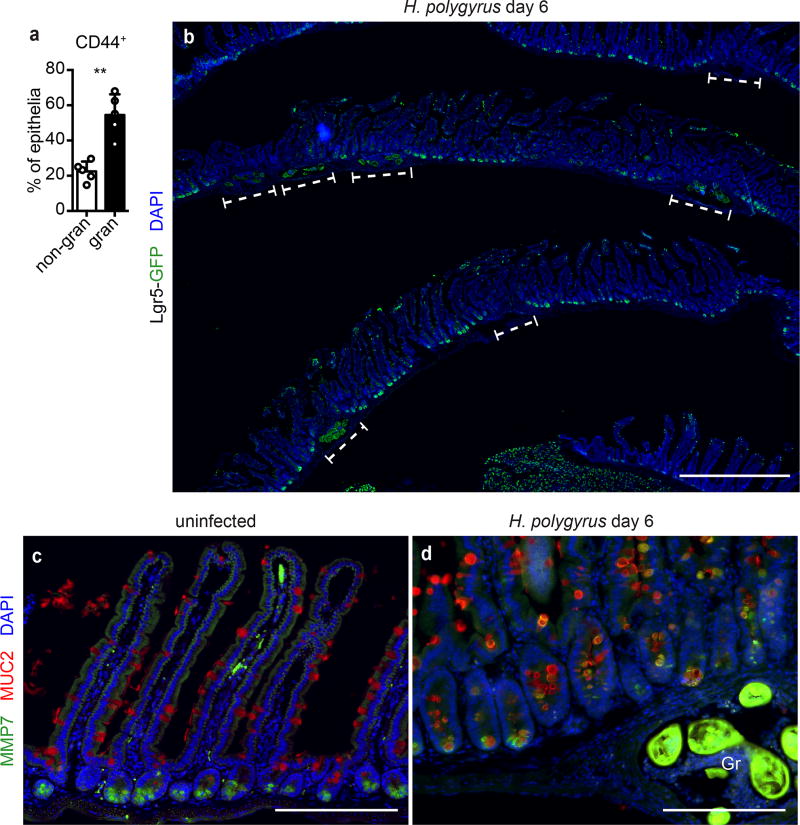
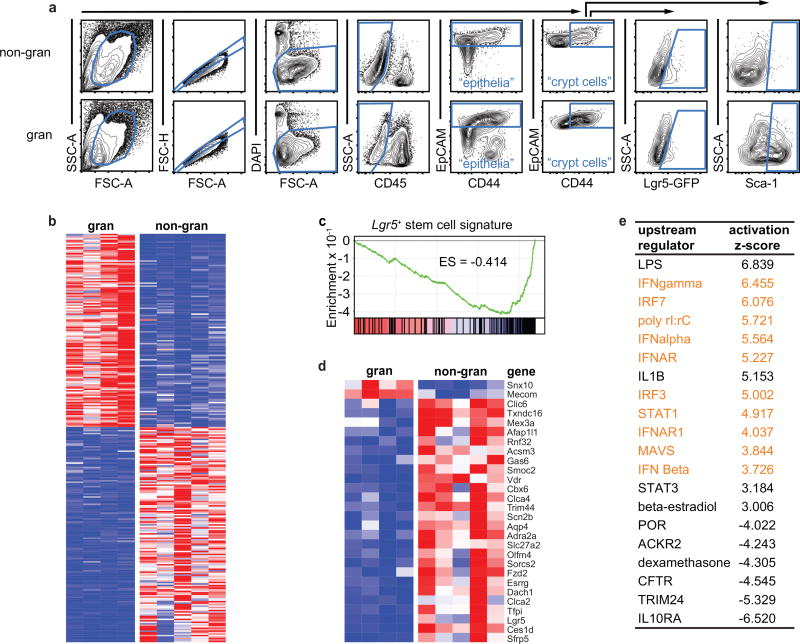
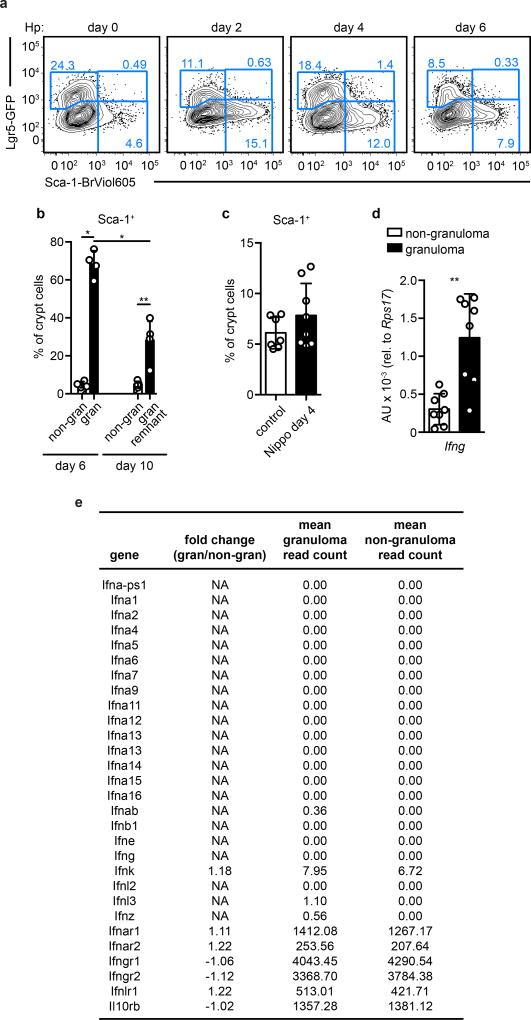
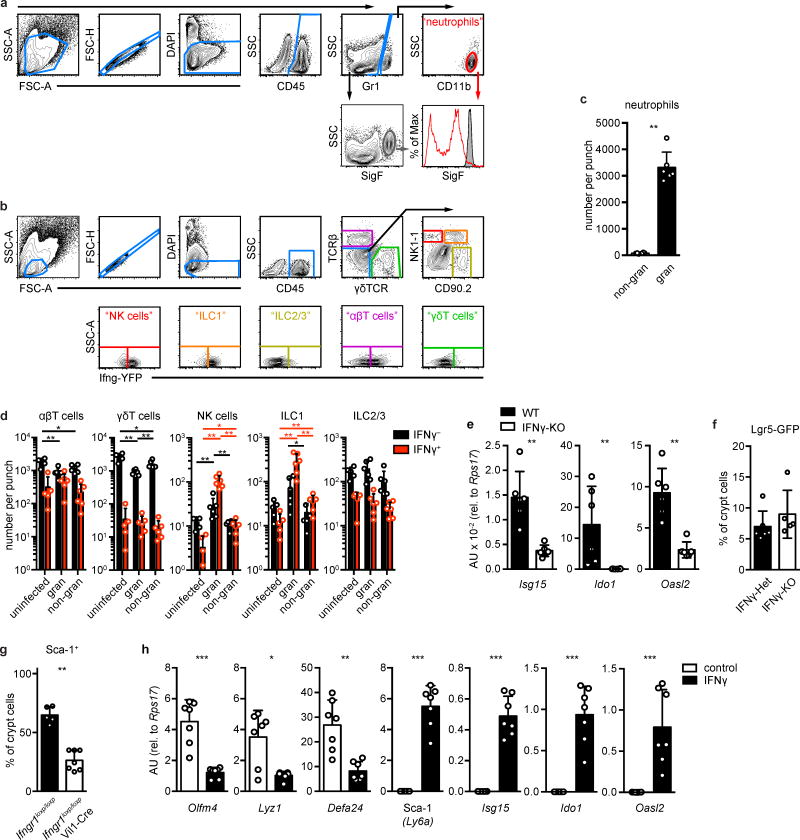
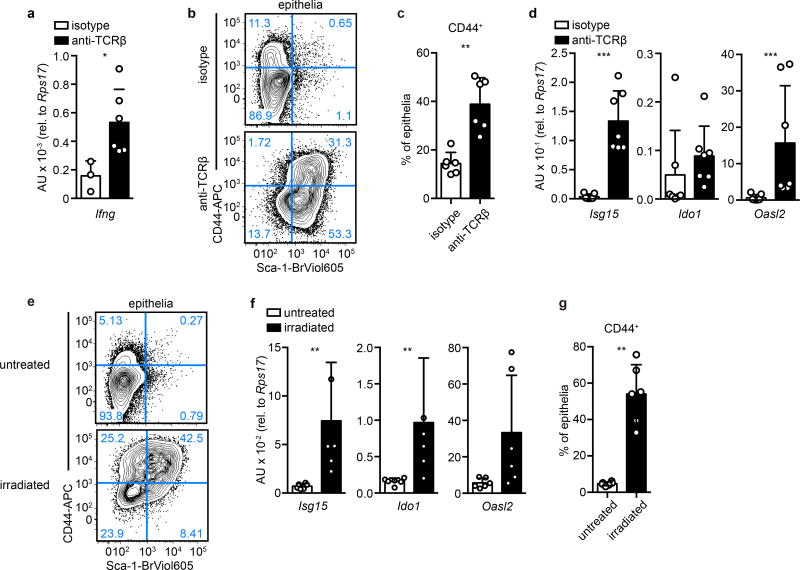
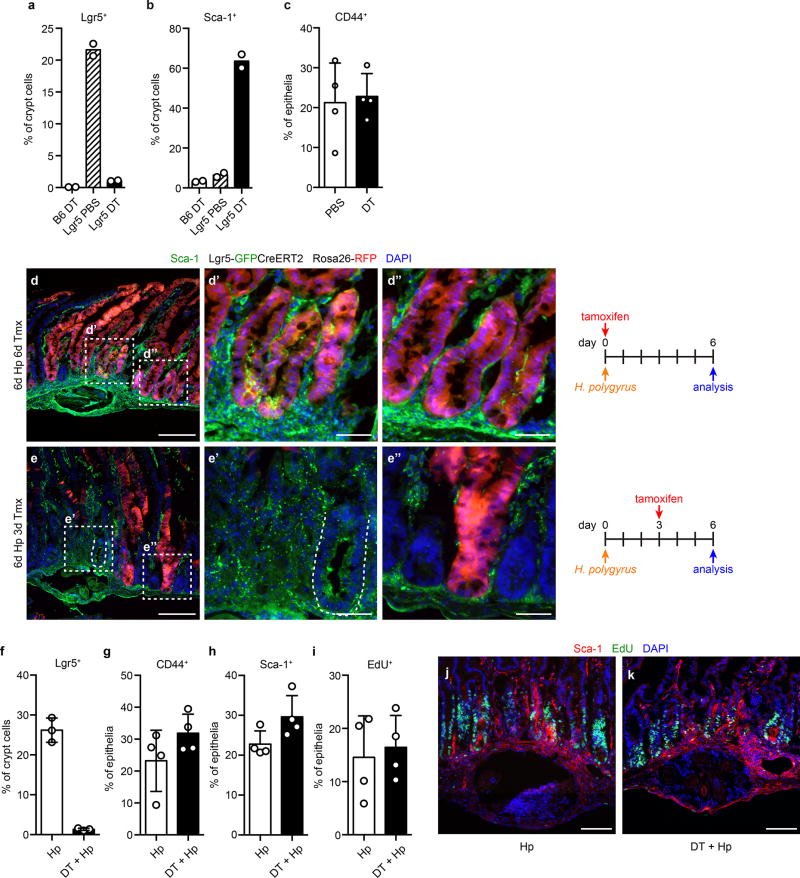
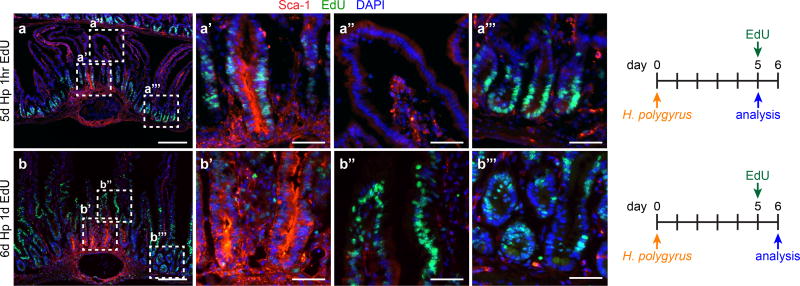
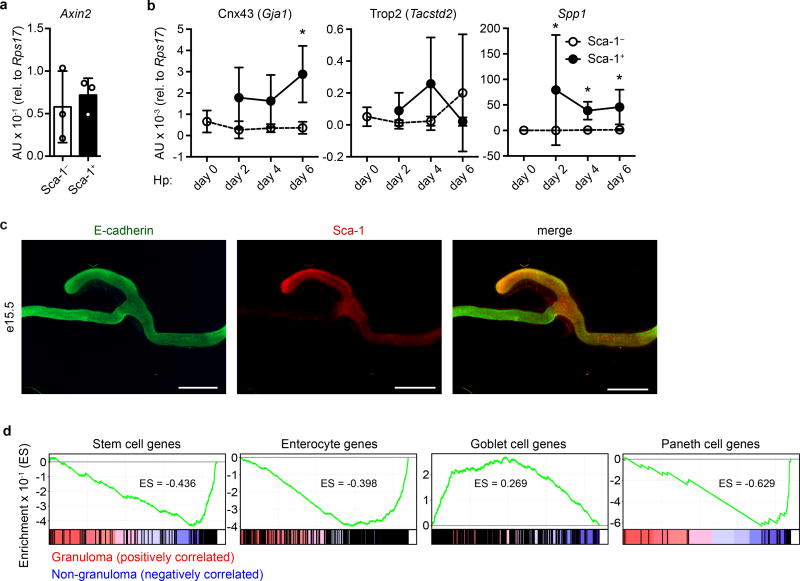
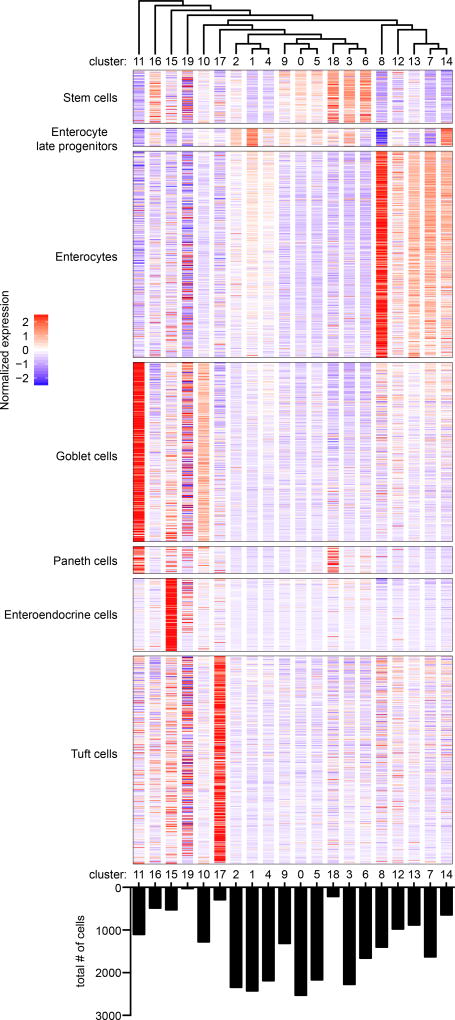
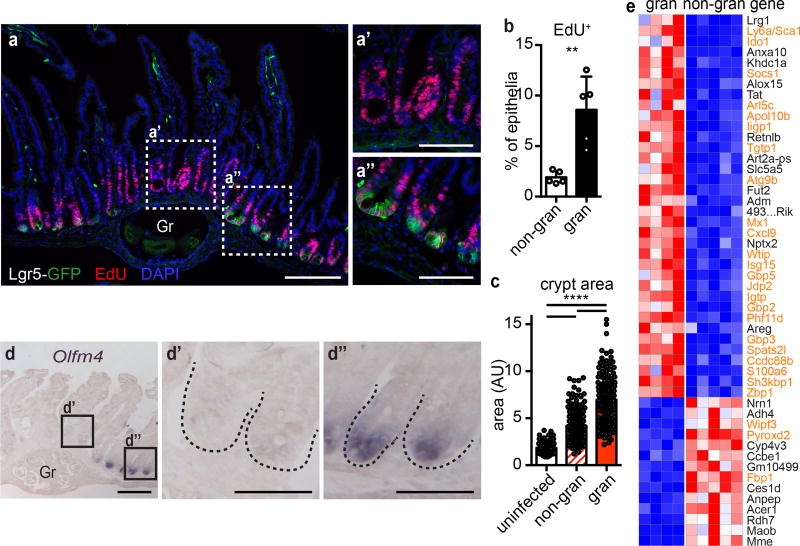
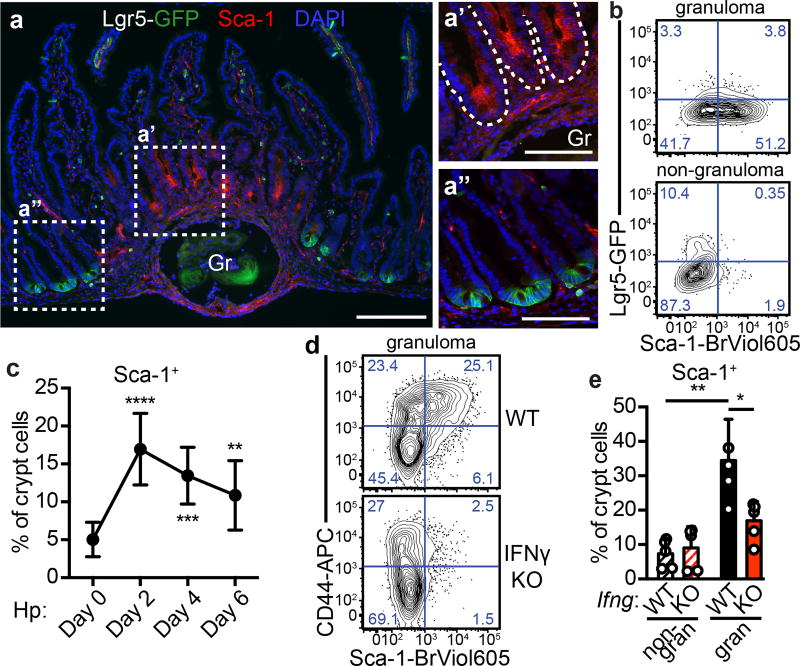
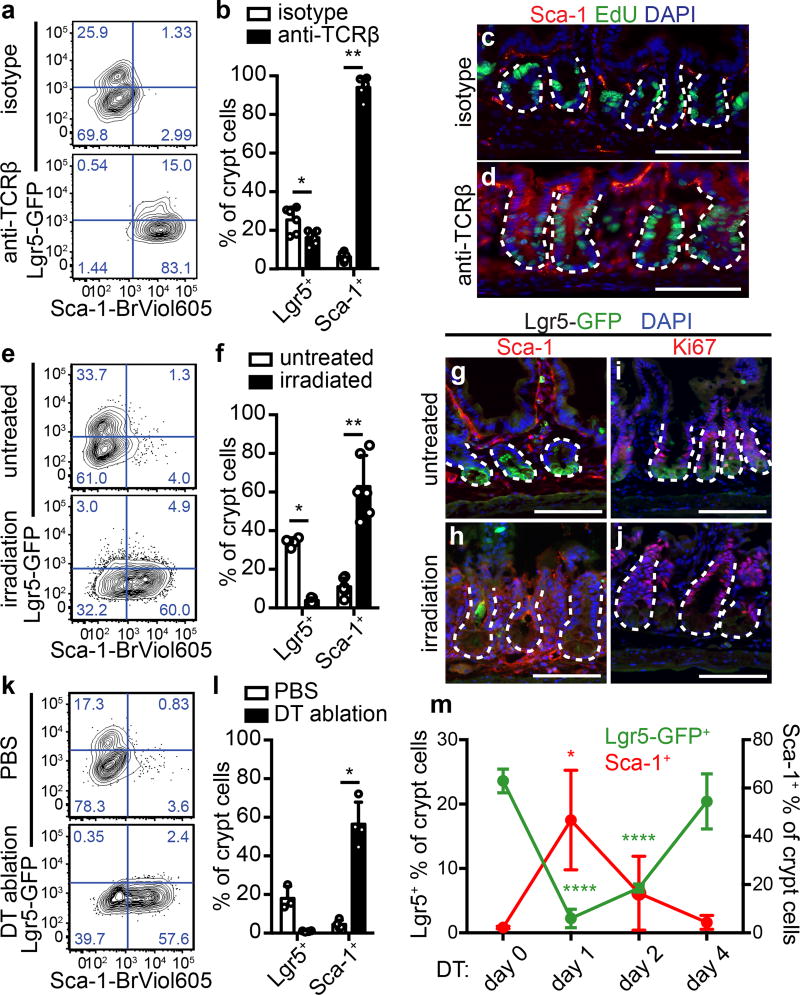
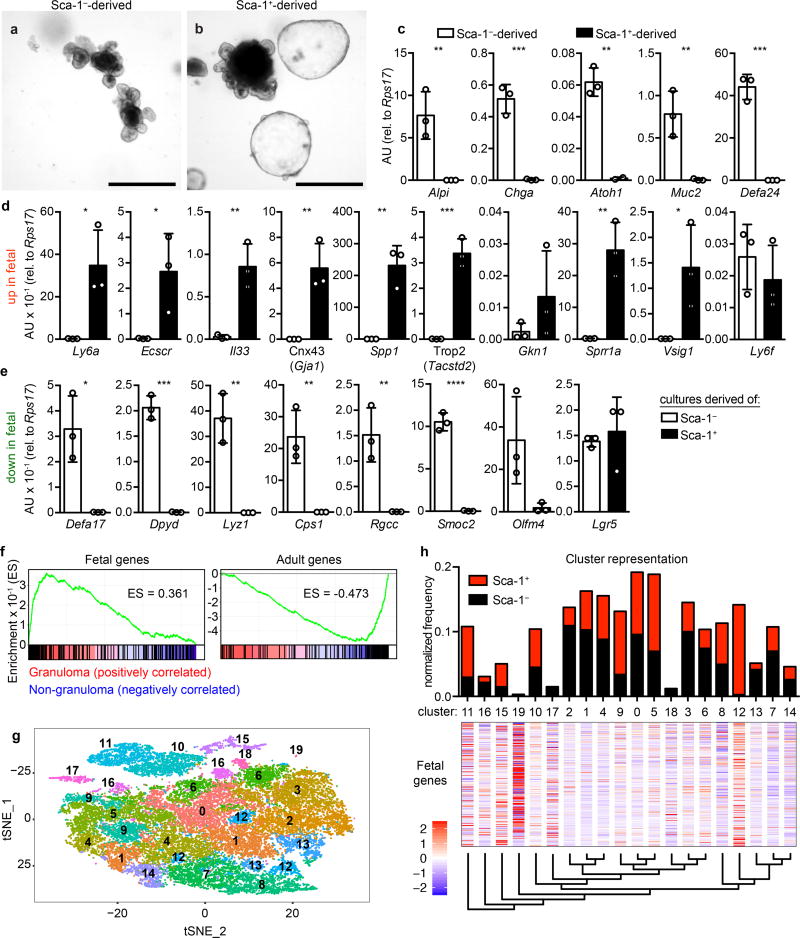
Epithelial surfaces form critical barriers to the outside world and are continuously renewed by adult stem cells1. Whereas dynamics of epithelial stem cells during homeostasis are increasingly well understood, how stem cells are redirected from a tissue-maintenance program to initiate repair after injury remains unclear. Here we examined infection by Heligmosomoides polygyrus, a co-evolved pathosymbiont of mice, to assess the epithelial response to disruption of the mucosal barrier. H. polygyrus disrupts tissue integrity by penetrating the duodenal mucosa, where it develops while surrounded by a multicellular granulomatous infiltrate2. Crypts overlying larvae-associated granulomas did not express intestinal stem cell markers, including Lgr53, in spite of continued epithelial proliferation. Granuloma-associated Lgr5- crypt epithelium activated an interferon-gamma (IFN-γ)-dependent transcriptional program, highlighted by Sca-1 expression, and IFN-γ-producing immune cells were found in granulomas. A similar epithelial response accompanied systemic activation of immune cells, intestinal irradiation, or ablation of Lgr5+ intestinal stem cells. When cultured in vitro, granuloma-associated crypt cells formed spheroids similar to those formed by fetal epithelium, and a sub-population of H. polygyrus-induced cells activated a fetal-like transcriptional program, demonstrating that adult intestinal tissues can repurpose aspects of fetal development. Therefore, re-initiation of the developmental program represents a fundamental mechanism by which the intestinal crypt can remodel itself to sustain function after injury.


Figures

Extended Data Figure 1
Extended Data Figure 1. Helminth infection alters the crypt and intestinal stem cell niche
Day 6 of H. polygyrus infection. a, Flow cytometry of CD44+ epithelium from non-gran or gran biopsies. n=5. b, Lgr5-GFP staining in the duodenum. Granulomas are indicated by the dashed brackets. In some granulomas, the helminth larva is recognizable by autofluorescence. The presence of rare Lgr5-GFP negative crypts is likely due to a sectioning artifact. Representative of n=3. Scale bar represents 1 mm. c–d, MMP7 and MUC2 staining in normal duodenum or duodenum from mice infected with H. polygyrus. Gr, granuloma. Representative of n=5. Scale bars represent 200 µm. Unpaired, two-tailed Mann-Whitney test; mean ± S.D. (a). ** P < 0.01.
Extended Data Figure 2
Extended Data Figure 2. RNAseq analysis of granuloma-associated crypt epithelium
a, Representative gating example of epithelia, crypt cells, Lgr5-GFP, and Sca-1 in biopsied tissue 6 days after H. polygyrus infection. Unfractionated tissue preps (as in Extended Data Fig. 3a) were gated similarly. b–e, Crypt epithelium was sorted from granuloma and non-granuloma biopsies and subjected to RNAseq analysis as indicated in the Methods. b, The data were filtered for ≥ 100 reads average in either group, false discovery rate ≤ 0.05, and fold-change comparison of ≥ 2. The 277 genes that passed were compiled into a heat map demonstrating high (red) and low (blue) relative expression. c, GSEA for Lgr5+ signature genes. FDR < 0.01. ES, enrichment score. d, Lgr5+ intestinal stem cell signature genes were cross-referenced to the RNAseq data set. Data were filtered as in (b) except no fold-change requirement was applied. e, The unfiltered RNAseq data set was analyzed for upstream regulators using Ingenuity Pathways Analysis. The activation Z-score indicates the extent of enrichment of targets within the RNAseq dataset downstream of the indicated regulator, with a positive score indicating enrichment. IFN related pathways are highlighted in orange.
Extended Data Figure 3
Extended Data Figure 3. Sca-1 is expressed on granuloma crypt epithelium and IFNγ is present in granulomas
a, Lgr5-GFP and Sca-1 expression on crypt cells from unfractionated duodenum preps of Lgr5-GFP mice were analyzed after H. polygyrus (Hp) infection. Representative of n=5 (day 0) or 4 (days 2, 4, 6). b, Sca-1 expression on crypt cells from biopsies from mice 6 or 10 days after infection with Hp. n=4 (day 6) or 5 (day 10). c, Sca-1 expression on crypt cells from unfractionated duodenum preps of mice 4 days after infection with N. brasiliensis (Nippo). n=7 (controls) or 8 (Nippo). d, Non-granuloma or granuloma biopsies from WT mice were analyzed for Ifng transcript. n=8. e, Fold change and read counts of IFN and IFN receptor genes from RNAseq performed as in Extended Data Fig. 2b with no filter applied. “NA” results from division by zero. Unpaired, two-tailed Mann-Whitney test; mean ± S.D. (b–d). * P < 0.05, ** P < 0.01.
Extended Data Figure 4
Extended Data Figure 4. IFNγ produced by Hp-responsive immune cells drives the granuloma gene signature
a–f, Mice were infected with H. polygyrus (Hp) and analyzed at day 6, unless otherwise indicated. a–b, Representative gating example of neutrophils (a) and NK cells, ILC1, ILC2/3, αβ T cells, and γδ T cells (b). c, Neutrophils were enumerated from non-granuloma (“non-gran”) or granuloma (“gran”) biopsies. n=6. d, Ifng reporter mice were untreated (uninfected) or infected (gran, non-gran) with Hp and analyzed 5–6 days later for hematopoietic (CD45+) populations: NK cells, ILC1, ILC2/3, αβ T cells, γδ T cells. No reporter signal was seen in non-lymphoid populations. n=5 (uninfected) or 6 (gran, non-gran). e, Crypt cells were sorted from granuloma biopsies of IFNγ-null (KO) mice and analyzed for the indicated transcripts. n=6/group. f, Lgr5-GFP mice were bred to IFNγ-KO mice and analyzed for Lgr5-GFP expression in crypt epithelia from granuloma biopsies. n=6 (Het) or 5 (KO). g, Ifngr1loxp/loxp mice were bred to Vil1-Cre mice and analyzed for Sca-1 expression in crypt epithelia from granuloma biopsies. n=5 (Ifngr1loxp/loxp) or 7 (Ifngr1loxp/loxp;Vil1-Cre). h, Wild type organoids were treated with 5 ng/ml IFNγ for 24 hours and analyzed for the indicated transcripts. n=7 cultures per group. Unpaired, two-tailed Mann-Whitney test; mean ± S.D. (c–h). * P < 0.05, ** P < 0.01, *** P < 0.001.
Extended Data Figure 5
Extended Data Figure 5. Inflammation via immune cell activation and irradiation induces granuloma-like epithelial responses
a–d, Mice were treated with 20 µg isotype antibody or anti-TCRβ (H57) and analyzed 24 hours later. a, Unfractionated tissue analyzed for Ifng transcript. n=3 (isotype) or 6 (anti-TCRβ). b, Total epithelium was analyzed for CD44 and Sca-1. Representative of n=6/group. c, Epithelium was assessed for crypt size by flow cytometry using frequency of CD44. n=6/group. d, Crypt cells were sorted and analyzed for the indicated transcripts. n=7/group. e–g, Mice were untreated or subjected to 10 gray irradiation and analyzed 3 days later. e, CD44 and Sca-1 expression on total epithelium. Representative of n=6/group. f, Crypt cells were sorted and analyzed for the indicated transcripts. n=6/group. g, Frequency of CD44+ crypt cells among total epithelium. n=6/group. Unpaired, two-tailed Mann-Whitney test; mean ± S.D. (a, c, d, f, g). * P < 0.05, ** P < 0.01, *** P < 0.001.
Extended Data Figure 6
Extended Data Figure 6. Granuloma crypt epithelium arises from pre-existing Lgr5+ cells but does not require Lgr5+ cells
a–c, Lgr5DTRGFP/+ (Lgr5) or wild-type (B6) mice were treated with diphtheria toxin (DT) and analyzed 1 day later for Lgr5-GFP (a), Sca-1 (b), or frequency of crypt cells among total epithelium (c). n=2/group (a,b) or 4/group (c). d–e, Lineage tracing of Lgr5+ precursors and Sca-1 staining. Lgr5GFP-CreERT2/+ Rosa26RFP/+ mice were administered 2.5 mg tamoxifen either immediately prior to (d) or 3 days after (e) infection with H. polygyrus (Hp). Mice were analyzed at day 6. Scale bars represent 200 µm (d,e) or 50 µm (d’,d”,e’,e’’). Representative of n=3 (d) or n=2 (e). f–k, Lgr5DTRGFP/+ mice were treated with DT immediately prior to infection with Hp and analyzed by flow cytometry at day 1 for Lgr5-GFP (f), or at day 6 for CD44 (g), Sca-1 (h), and EdU (i) in epithelial cells from granuloma biopsies. n=3/group (f) or 4/group (g–i). j–k, Sca-1 and EdU detection. Scale bars represent 100 µm. Representative of n=3. Mean ± S.D. (c, f–i).
Extended Data Figure 7
Extended Data Figure 7. Granuloma crypt epithelium contributes to epithelial turnover
a–b, WT mice were injected with EdU at day 5 of infection and analyzed after 1 hour (a) or 24 hours (b). Scale bars represent 200 µm (a–b) or 50 µm (a’–b’’’). Representative of n=4 (day 5) or n=6 (day 6).
Extended Data Figure 8
Extended Data Figure 8. Granuloma crypt epithelium activates a fetal-like program and exhibits altered differentiation
a, Material from the cultures described in Fig. 4a–b was analyzed for Axin2 transcript. Cultures derived of n=3 mice. b, Sca-1+ or Sca-1 crypt cells were sorted from mice infected with H. polygyrus for the indicated times and analyzed for fetal transcripts. n=5 (Sca-1 day 0), or 4 (all others). c, Whole mount embryonic day 15.5 (e15.5) fetal intestine was fixed and stained for Sca-1 and E-cadherin. Representative of n=3 embryonic day 15.5–16.5 fetuses. Scale bar represents 1 mm. d, Bulk RNAseq data (as in Fig. 1e) were analyzed by Gene Set Enrichment Analysis for intestinal epithelial signature genes. Enrichment score (ES) is indicated and all analyses have FDR < 10−3. n=5 (non-granuloma, 25 mice total) or 4 (granuloma, 20 mice total) independently sorted samples. Unpaired, two-tailed Mann-Whitney test; mean ± S.D. (a–b). * P < 0.05.
Extended Data Figure 9
Extended Data Figure 9. Markers of adult intestinal cell types in single cell analysis of Sca-1+ and Sca-1 crypt epithelium
Clusters identified by unsupervised hierarchical clustering were arranged per the unsupervised dendrogram of cluster relatedness (upper panel) and normalized expression values for intestinal cell type gene signatures were displayed as a heat map in each cluster (middle panel). The total number of cells in each cluster are shown (lower panel).
Figure 1
Figure 1. Helminth infection induces an Lgr5 program in affected crypt epithelium
Day 6 of H. polygyrus infection. a, Lgr5-GFP and EdU in crypts overlying (a’) and adjacent to (a”) Hp granulomas (“Gr”). n=5; scale bars, 200 µm (a), 100 µm (a’,a”). b, EdU in flow cytometry of total epithelium from granuloma (“gran”) or non-granuloma (“non-gran”) biopsies. n=5. c, Crypt area from uninfected mice, non-gran or gran of infected mice. n=123 crypts from 6 mice (uninfected), 264 (non-gran) and 183 (gran) crypts from 15 infected mice. d, Olfm4 in gran-associated (d’) or non-gran crypts (d”). n=5; scale bars, 200 µm (d), 50 µm (d’,d”). e, RNAseq of crypt epithelium from non-gran or gran biopsies. Data were filtered for ≥ 100 reads average in either group, FDR ≤ 10−4, and the 50 highest genes for fold-change are presented; high (red) and low (blue) relative expression. Orange gene names are predicted IFN targets. n=5 (non-granuloma, 25 mice total) or 4 (granuloma, 20 mice total) independently sorted samples. Unpaired, two-tailed Mann-Whitney test; mean ± S.D. (b–c). ** P < 0.01, **** P < 0.0001.
Figure 2
Figure 2. IFNγ mediates the helminth-induced crypt phenotype
Day 6 of H. polygyrus infection, except as noted. a, Lgr5-GFP and Sca-1 in crypts overlying (a’) and adjacent to (a”) granulomas (“Gr”). n=5; scale bars, 200 µm (a), 100 µm (a’,a”). b, Lgr5-GFP and Sca-1 in crypt biopsies. n=4. c, Sca-1 on crypts from unfractionated epithelium at various time points. n=9 (day 0) or 8 (all others). Significance vs. day 0. d, CD44 and Sca-1 in epithelia from granuloma biopsies from IFNγ-KO mice. n=5/group. e, Cells analyzed as in (d). n=5/group. Unpaired, two-tailed Mann-Whitney test; mean ± S.D. (c, e). * P < 0.05, ** P < 0.01, *** P < 0.001, **** P < 0.0001.
Figure 3
Figure 3. The crypt response to H. polygyrus is a generalized response to tissue injury
a–d, Mice were treated with 20 µg anti-TCRβ and analyzed 24 hours later for Lgr5-GFP and Sca-1 in crypt cells (a–b) or Sca-1 and EdU (c–d). n=6/group (a–b). n=4/group; scale bars, 100 µm (c–d). e–j, Mice were treated with 10 gray irradiation and analyzed at 3 days for Lgr5-GFP and Sca-1 in crypt cells (e–h) or Lgr5-GFP and Ki67 (i–j). n=4 (Lgr5, untreated), 5 (Lgr5, irradiated), or 6 (Sca-1) (e–f). n=3/group; scale bars, 100 µm (g–j). k–m, Lgr5DTRGFP/+ mice were treated with diphtheria toxin (DT) and analyzed for Lgr5-GFP and Sca-1 in crypt cells at 24 hours (k–l) or indicated time points (m). n=3 (Lgr5, untreated), or 4 (all others) (k–l). n=3 (day 0) or 4 (days 1, 2, 4) (m). Unpaired, two-tailed Mann-Whitney test (b, f, l) or unpaired, two-tailed t tests (m); mean ± S.D. (b, f, l, m). * P < 0.05, ** P < 0.01, **** P < 0.0001.
Figure 4
Figure 4. Helminth-associated crypts acquire a fetal-like program
a–e, Sorted Sca-1 (a) or Sca-1+ (b) crypt cells from H. polygyrus (Hp)-infected mice were cultured in organoid conditions and imaged after one passage (a–b), and analyzed for markers of differentiated cells (c) and fetal-derived cultures (d–e). n=15; scale bars, 500 µm (a–b). Derived of n=3 mice; P values are from unpaired two-tailed t tests; mean ± S.D. (c–e). f, Bulk RNAseq data (as in Fig. 1e) were analyzed by GSEA for cell signature genes. ES, enrichment score (ES). All analyses have FDR < 10−3. n=5 (non-granuloma, 25 mice total) or 4 (granuloma, 20 mice total) independently sorted samples. g–h, Single-cell RNA sequencing from n=19,754 Sca-1 and n=6,669 Sca-1+ individually sorted crypt cells from Hp-infected mice. g, t-SNE distribution color coded to represent clusters identified independently by unsupervised hierarchical clustering. The relation of cluster identity to transcriptional signatures of mature lineages can be found in Extended Data Fig. 9. h, Sca-1 and Sca-1+ cell frequency within each cluster, normalized to the total number of cells sequenced from each population (upper panel). Normalized expression values for the fetal gene signature were mapped to the clusters (middle panel) and arranged per the unsupervised dendrogram of cluster relatedness (lower panel). * P < 0.05, ** P < 0.01, *** P < 0.001, **** P < 0.0001.

Comment in

Similar articles

Cited by

References

    1. Karin M, Clevers H. Reparative inflammation takes charge of tissue regeneration. Nature. 2016;529:307–315. - PMC - PubMed
    1. Maizels RM, et al. Immune modulation and modulators in Heligmosomoides polygyrus infection. Exp. Parasitol. 2012;132:76–89. - PMC - PubMed
    1. Barker N, et al. Identification of stem cells in small intestine and colon by marker gene Lgr5. Nature. 2007;449:1003–7. - PubMed
    1. Tian H, et al. A reserve stem cell population in small intestine renders Lgr5-positive cells dispensable. Nature. 2011;478:255–9. - PMC - PubMed
    1. Ferguson A, Jarrett EE. Hypersensitivity reactions in small intestine. I Thymus dependence of experimental ‘partial villous atrophy’. Gut. 1975;16:114–7. - PMC - PubMed

Publication types