. 2018 Jul;559(7712):67-72.
doi: 10.1038/s41586-018-0255-3. Epub 2018 Jun 27.

Structure of a human synaptic GABAA receptor

Affiliations

Structure of a human synaptic GABAA receptor

Shaotong Zhu et al. Nature. 2018 Jul.

Abstract

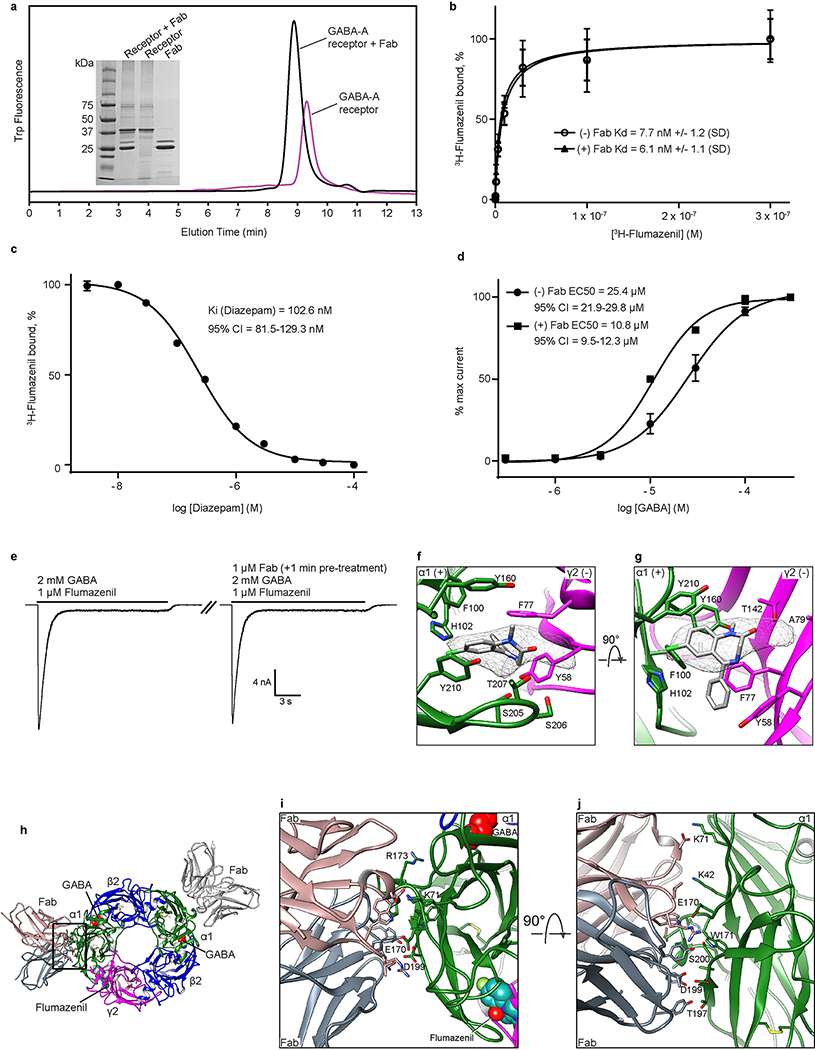
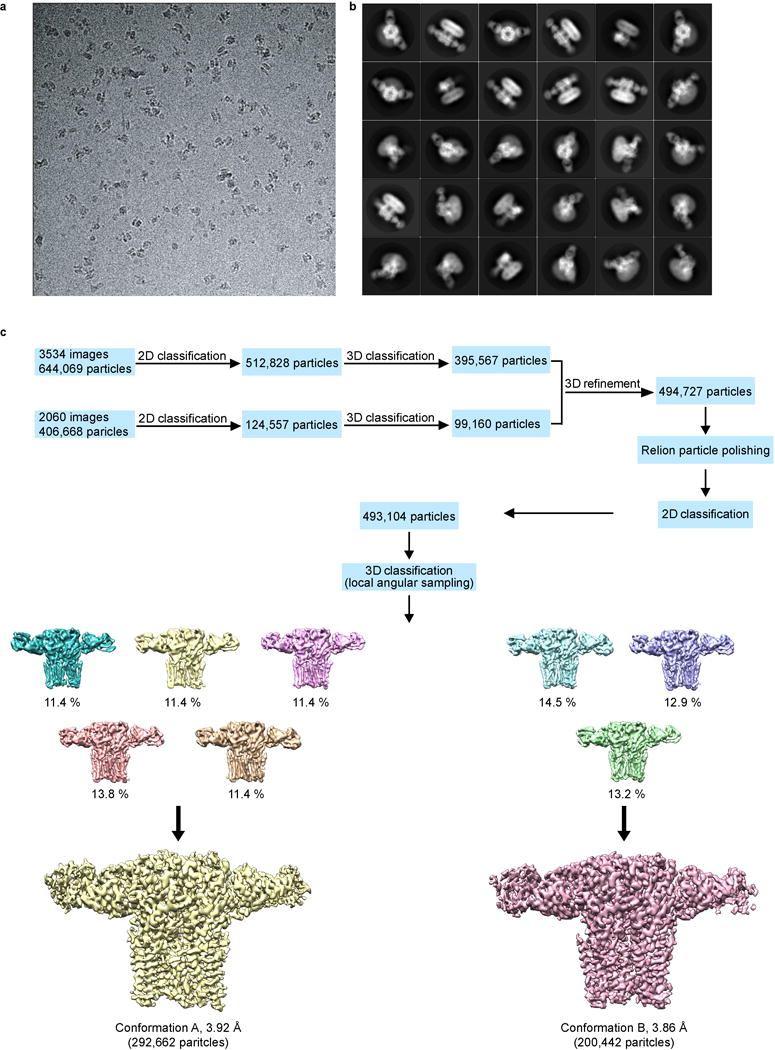
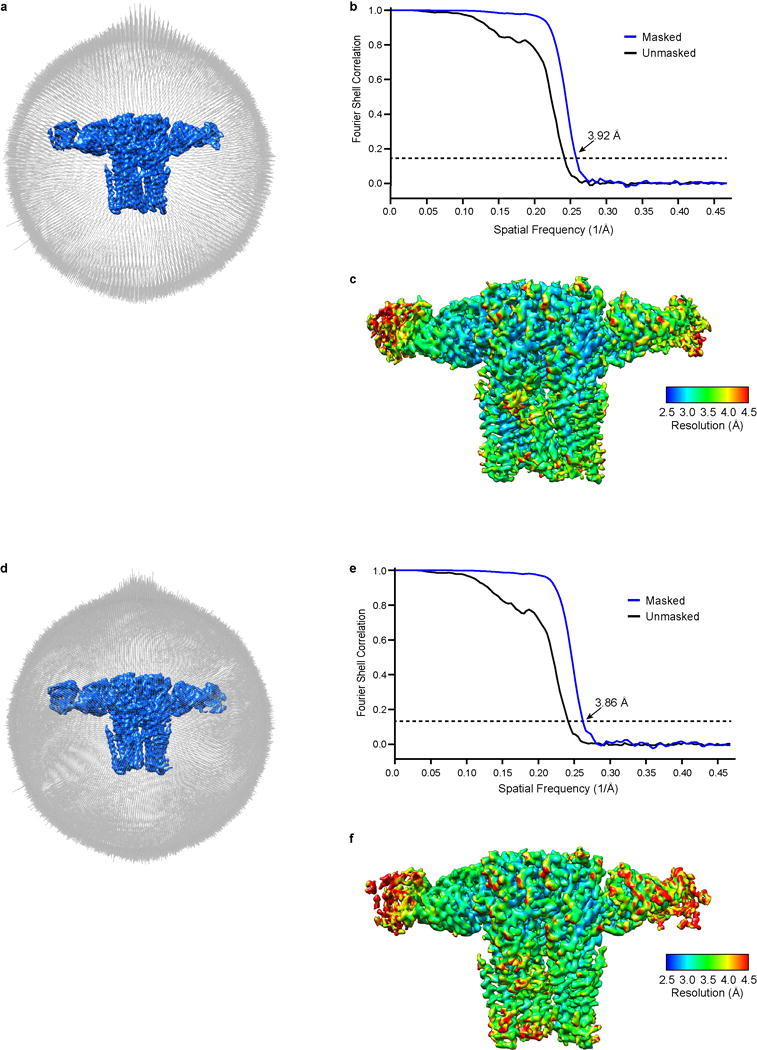
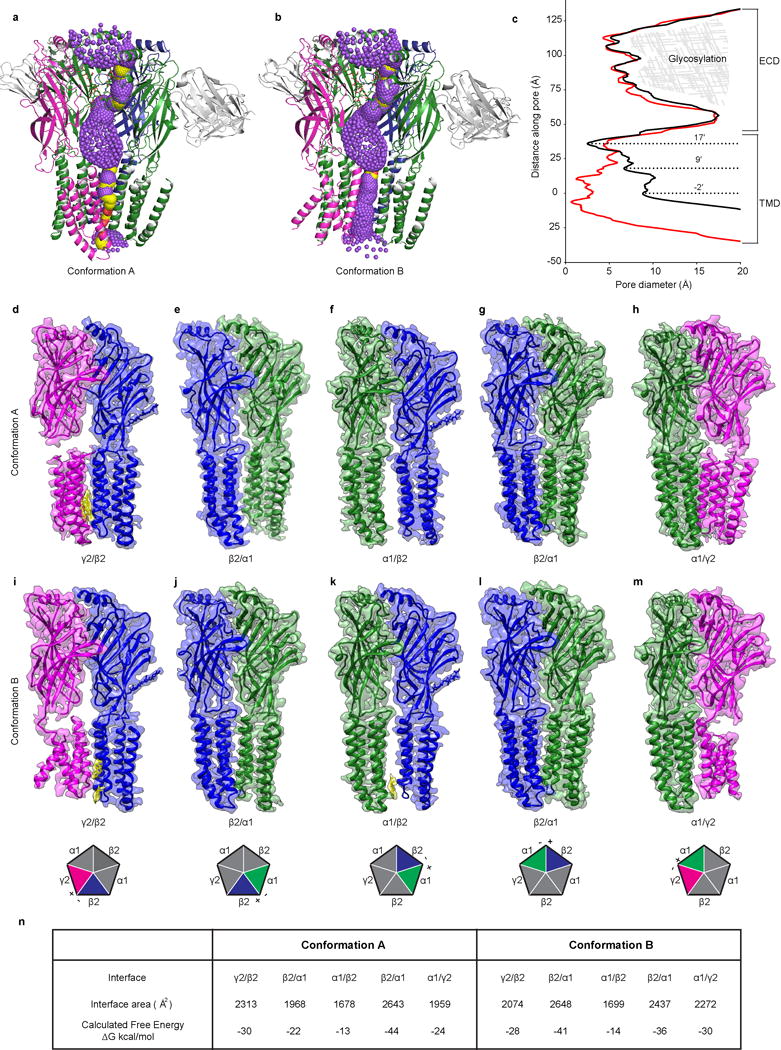
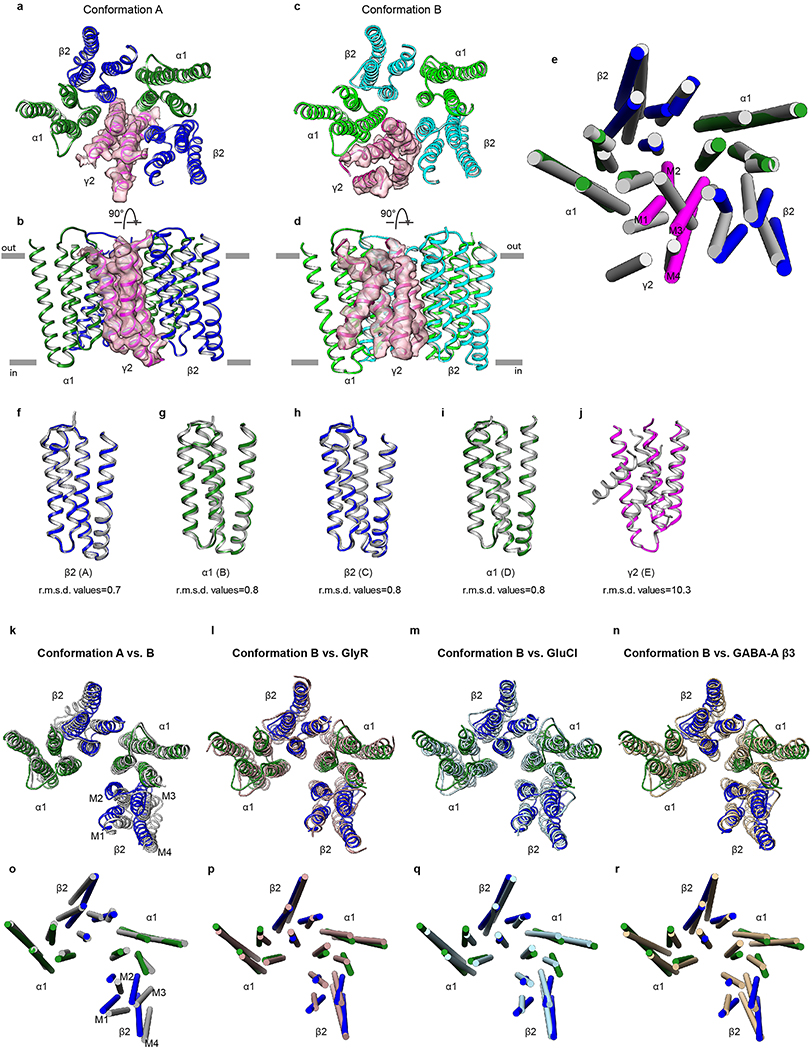
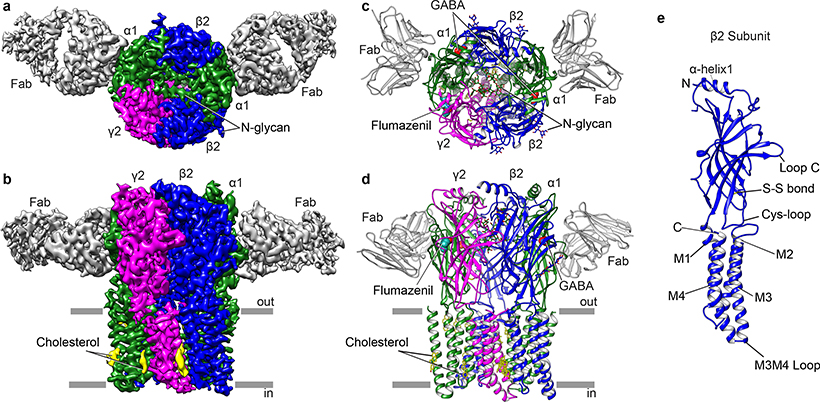
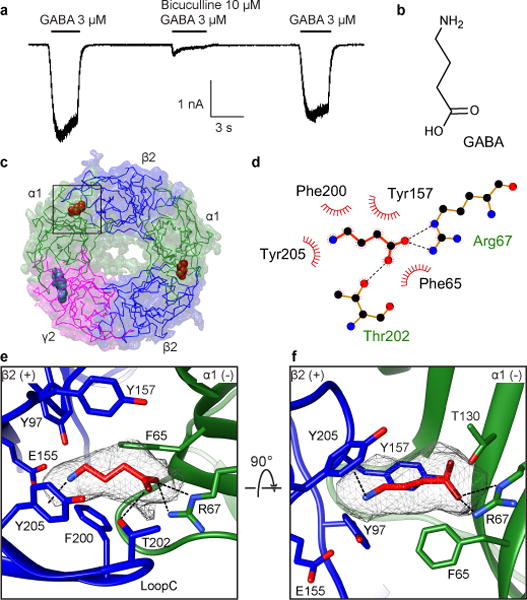
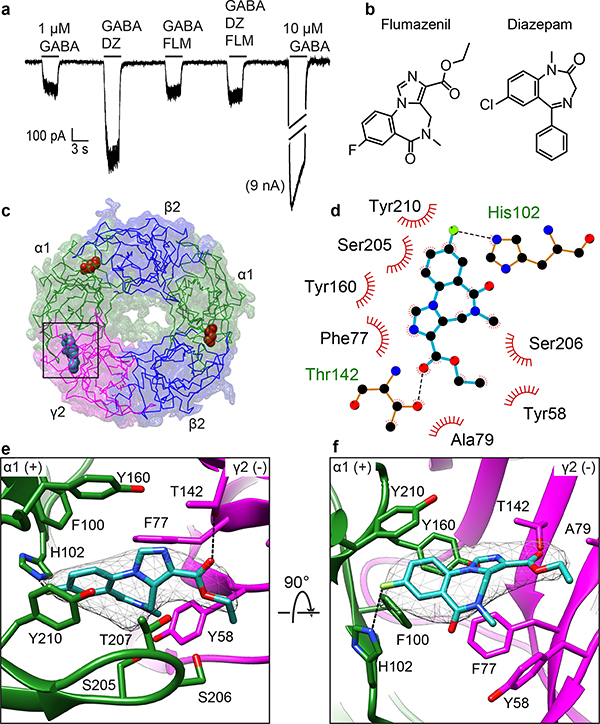
Fast inhibitory neurotransmission in the brain is principally mediated by the neurotransmitter GABA (γ-aminobutyric acid) and its synaptic target, the type A GABA receptor (GABAA receptor). Dysfunction of this receptor results in neurological disorders and mental illnesses including epilepsy, anxiety and insomnia. The GABAA receptor is also a prolific target for therapeutic, illicit and recreational drugs, including benzodiazepines, barbiturates, anaesthetics and ethanol. Here we present high-resolution cryo-electron microscopy structures of the human α1β2γ2 GABAA receptor, the predominant isoform in the adult brain, in complex with GABA and the benzodiazepine site antagonist flumazenil, the first-line clinical treatment for benzodiazepine overdose. The receptor architecture reveals unique heteromeric interactions for this important class of inhibitory neurotransmitter receptor. This work provides a template for understanding receptor modulation by GABA and benzodiazepines, and will assist rational approaches to therapeutic targeting of this receptor for neurological disorders and mental illness.


Conflict of interest statement

Author Information: The authors declare no competing financial interests. Readers are welcome to comment on the online version of the paper.

Figures

Extended Data Figure 1
Extended Data Figure 1. Alignment of GABA-A and other Cys-loop receptor subunits
EM constructs (γ2 affinity tag not shown) are numbered starting with the first residue of the mature protein. Sequences aligned (UniProt or PDB accession codes): Homo sapiens α1 GABA-A (HS, P14867), H. sapiens β2 GABA-A (P47870), H. sapiens γ2 GABA-A (P18507), H. sapiens GABA-A β3 (4COF), H. sapiens glycine α3 (5CFB), Danio rerio glycine α1 (DR, 3JAE), Caenorhabditis elegans α (CE, 3RHW), H. sapiens α4 nAChR (5KXI), H. sapiens β2 nAChR (5KXI) and Mus musculus 5-HT3 receptor (MM, 4PIR). α-helices (cylinders), β-strands (arrows), and inserted linker (cyan) are indicated.
Extended Data Figure 2
Extended Data Figure 2. Biochemistry and binding assay
a, FSEC of GABA-A receptor with and without Fab bound and SDS-PAGE analysis of a representative purification (from n>10 purifications). b, Saturation binding assay with [3H]-flumazenil. Single site binding fits for receptor alone and receptor plus Fab both exhibited a Hill slope of ~1 (0.97 and 0.89 respectively). Plotted results are from a representative experiment performed in triplicate. n=3 independent experiments. Data point center is the mean. Error bars are standard deviation, shown for a representative triplicate measurement. c, Competition of 10 nM [3H]-flumazenil with diazepam. Calculated Ki for diazepam assumes a Kd of [3H]-flumazenil of 7.7 nM. n=2 independent experiments in triplicate. Error bars are standard error of the mean (s.d.), shown for a representative triplicate measurement. d, Dose-response experiments in the presence or absence of Fab. HEK cells were transfected with EM constructs and patch-clamped with or without pretreatment of 1 μM Fab for one minute. Hill slopes are 1.7 and 1.4 with and without Fab, respectively. Published values for GABA EC50 range from 6.6 μM – 107 μM. n=3 experiments from different cells. Data point center is the mean. Error bars are standard deviation. e, Whole cell patch clamp recording of long application of EM ligands at concentrations used in EM sample to assess conformational state at equilibrium. The two traces shown are from one continuous recording; in between the two responses, Fab was added to 1 μM for one minute to saturate all receptor sites before second application of GABA and flumazenil (including Fab). n=3 independent experiments. f-g, Docking of diazepam at the benzodiazepine binding site based on superposition of benzodiazepine rings. The phenyl ring of diazepam would orient toward the membrane, possibly forming π-π stacking interactions with Y58 on the complementary subunit. Similar to flumazenil, the halogen of diazepam could interact with H102, suggesting this contact is conserved broadly among benzodiazepines and flumazenil. This orientation is largely consistent with predictions from a modeling and docking study and distinct from that suggested by affinity labeling. In this latter prediction, the diazepam phenyl group orients away from the membrane and would require local reorganization of side chains to avoid atomic clashes. h-j, Structural details of Fab-α1 interaction. Labeled residues are on α subunit. i, Top view. j, Side view.
Extended Data Figure 3
Extended Data Figure 3. Cryo-EM image processing procedure
a, Representative cryo-electron micrograph of the GABA-A receptor-Fab complex. n=5,594 images. b, Images of selected two dimensional classes from reference-free two-dimensional classification by Relion. c, Overview of the image processing procedure (see Methods).
Extended Data Figure 4
Extended Data Figure 4. Three-dimensional reconstructions of the two GABA-A receptor conformations
a, Angular distribution histogram of GABA-A receptor conformation A particle images. b, Fourier shell correlation (FSC) of conformation A maps before (black) and after (blue) masking. c, Local resolution of the GABA-A receptor estimated by ResMap. d-f, as in a-c but for GABA-A receptor conformation B.
Extended Data Figure 5
Extended Data Figure 5. GABA-A receptor model-map validation
a, Table 1, data collection and refinement statistics. b,c, FSC curves for cross-validation between the maps and models of both conformation A (b) and conformation B (c). FSC curves for final model versus summed map (whole) in black, for model versus half map in green (work), and for model versus half map not used for refinement in blue (free).
Extended Data Figure 6
Extended Data Figure 6. Cryo-EM density of the GABA-A receptor in conformation A
a-e, EM density map of the GABA-A receptor conformation A for a representative of each subunit. f-h, EM density segments of Loop C in α1, β2 and γ2 subunits. i-k, EM density segments of M2 helix in α1, β2 and γ2 subunits. l-n, EM density maps of ligand binding sites. l, Flumazenil; m-n, two GABA binding sites.
Extended Data Figure 7
Extended Data Figure 7. Cryo-EM density of the GABA-A receptor in conformation B
a-e, EM density map of the GABA-A receptor conformation B for a representative of each subunit; chain IDs are in parentheses. f-h, EM density segments of Loop C in α1, β2 and γ2 subunits. i-k, EM density segments of M2 helix in α1, β2 and γ2 subunits. l-n, EM density maps of ligand binding sites. l, Flumazenil; m-n, two GABA binding sites.
Extended Data Figure 8
Extended Data Figure 8. Superposition of subunits
a-e, Subunits of conformation A are compared to the corresponding subunit from conformation B. f-j, Superposition of subunits within conformation A. k-o, Superposition of subunits within conformation B. Chimera MatchMaker was used to generate alignments; r.m.s.d. values in Å are for Cα atoms over entire subunit. Chain IDs are in parentheses.
Extended Data Fig. 9
Extended Data Fig. 9. Permeation pathway and subunit interfaces
a, Cartoon of permeation pathway for conformation A. Single β2 subunit is removed for clarity. Purple spheres indicate pore diameters >5.6 Å; yellow is >2.8 Å and <5.6 Å; red is <2.8 Å. b, Same as a but for conformation B. c, Pore diameters for conformation A (red) and conformation B (black). The zero value along the y-axis of the plot is aligned with the α-carbon of the −2′ position of conformation B. d-m, Side view of two adjacent subunits in conformations A (d-h) and B (i-m). View is from the periphery of the receptor toward the pore axis. Cholesterol at the interface is also shown in yellow in d, i and k. Cartoon pentagons (bottom) are colored to illustrate all subunits composing the displayed interface; subunits not participating in the displayed interface are grey. Principal (+) and complementary (-) sides of the displayed interface are labeled on each pentagon. n, Analysis of the subunit interfaces of both conformations using PDBePISA server.
Extended Data Figure 10
Extended Data Figure 10. Transmembrane domain flexibility and comparison with reference structures
a-b, Top and side view of the TMD of conformation A with density for the γ2-subunit shown. c-d, As in a, but for conformation B. e, Transmembrane domain superposition of conformation A (subunits in color) over conformation B (gray). α-helices are represented as cylinders. f-j, Superposition of single subunit TMD in conformation A (colored) with its corresponding subunit in conformation B (gray). k-r, Superpositions of the 4 non-γ subunits. Top and bottom rows contain same superpositions in different representations. Conformation B is shown in all panels with α subunits in green and β subunits in blue. Reference structures include the glycine receptor with ivermectin bound (3JAF), GluCl with ivermectin bound (3RHW) and the GABA-A β3 homopentamer (4COF).
Figure 1
Figure 1. Overall structure of the GABA-A receptor-Fab complex
a,b, Top and side views of the 3D reconstruction of GABA-A receptor-Fab complex colored by subunit: α1-green, β2-blue, γ2- magenta; Fab-gray, CHS-yellow. Conformation A is shown. c,d, Top and side view of the atomic model, colored as in a. Flumazenil is shown as cyan spheres, GABA as red spheres and CHS and N-linked glycans are modeled as sticks. e, Structure of single β2 subunit.
Figure 2
Figure 2. Neurotransmitter binding site
a, Electrophysiology of the GABA-A EM construct in HEK cells. n=3 independent experiments. b, GABA chemical structure. c, View from synapse; box indicates one of two equivalent GABA binding sites at β2-α1 interfaces. d, LigPlot schematic of GABA interactions showing electrostatic (dashes) and hydrophobic interactions (eyelashes). e,f, Detailed architecture of GABA binding pocket boxed in c. e, Synaptic view as in c. Putative hydrogen bonding and cation-π interactions are represented as dashed lines. f, Side view of the GABA binding pocket with loop C backbone hidden for clarity.
Figure 3
Figure 3. Flumazenil interactions at the benzodiazepine binding site
a, Electrophysiology of the cryo-EM construct showing flumazenil (3 μM) blocks GABA-A receptor potentiation by diazepam (1 μM). n=3 independent experiments. b, Flumazenil and diazepam chemical structures. c, View from synapse, as in Fig. 2; box indicates flumazenil bound at α1-γ2 interface. d, Schematic of flumazenil interactions showing electrostatic (dashes) and hydrophobic interactions (eyelashes). e,f, Detailed architecture of flumazenil binding pocket boxed in c, with orientations and representations as in Fig. 2e-f.
Figure 4
Figure 4. Pseudo-ligand sites vs. GABA and flumazenil sites
a, Synaptic view, with colored boxes indicating the distinct pseudo-agonist sites. b,e, Detailed structural information of pseudo-agonist interfaces α-β and γ-β boxed in a. c,f, Superposition of GABA binding site (in gray) on α-β and γ-β interfaces respectively. d,g, Superposition of flumazenil binding site (in taupe) on the α-β and γ-β interfaces respectively. h, Sequence alignment of the loops involved in ligand binding pockets. Blue residues are involved in flumazenil binding; red residues are involved in GABA binding.
Figure 5
Figure 5. Vestibule and non-vestibule N-glycosylation
a, Synaptic view of receptor with glycosylation sites indicated. b,d, Side view of vestibule N-glycosylation attached to α1 subunits. Subunits β2 and γ2 are hidden for clarity. N-linked glycans are indicated by dashed black boxes. c,e, Detailed structures of N-linked glycans. c, NAG1-NAG2-BMA3-MAN4-MAN5-MAN6-MAN7-MAN8. e, NAG1-NAG2-BMA3-MAN4-MAN5. f,g, Reference and detailed structures of peripheral N-linked glycosylation on β2 subunits. Chain IDs are in parentheses.
Figure 6
Figure 6. Conformational arrangements of transmembrane domain
a,b Side and top views of the TM domain in conformation A. c,d, Side and top views of the TM domain in Conformation B. In b,d, putative cholesterol molecules are shown as sticks. Red arrows indicate sites that overlap with proposed endocannabinoid and pregnenolone sulfate (PS) sites. Blue arrows indicate sites shared with PS. Black arrows indicate sites shared with the neurosteroids pregnanolone and THDOC.

Comment in

References

    1. Nutt DJ, Malizia AL. New insights into the role of the GABA(A)-benzodiazepine receptor in psychiatric disorder. Br J Psychiatry. 2001;179:390–396. - PubMed
    1. Maconochie DJ, Zempel JM, Steinbach JH. How quickly can GABAA receptors open? Neuron. 1994;12:61–71. - PubMed
    1. Braat S, Kooy RF. The GABAA Receptor as a Therapeutic Target for Neurodevelopmental Disorders. Neuron. 2015;86:1119–1130. doi: 10.1016/j.neuron.2015.03.042. - DOI - PubMed
    1. Chuang SH, Reddy DS. Genetic and Molecular Regulation of Extrasynaptic GABA-A Receptors in the Brain: Therapeutic Insights for Epilepsy. J Pharmacol Exp Ther. 2018;364:180–197. doi: 10.1124/jpet.117.244673. - DOI - PMC - PubMed
    1. Jacob TC, Moss SJ, Jurd R. GABA(A) receptor trafficking and its role in the dynamic modulation of neuronal inhibition. Nat Rev Neurosci. 2008;9:331–343. doi: 10.1038/nrn2370. - DOI - PMC - PubMed

Publication types

MeSH terms