. 2018 Jun 20:11:3573-3581.
doi: 10.2147/OTT.S158868. eCollection 2018.

Impact of RNA integrity and blood sample storage conditions on the gene expression analysis

Affiliations

Impact of RNA integrity and blood sample storage conditions on the gene expression analysis

Yanting Shen et al. Onco Targets Ther. .

Abstract

Background: The reliability of RNA sequencing (RNA-seq) output is affected by the quality of RNAs, which is in turn dependent on the quality of samples. Therefore, the purposes of this study were to reconsider the threshold of the RNA integrity number (RIN) and propose a simple and efficient storage scheme of blood samples for RNA-seq.

Patients and methods: The RNAs were extracted from blood samples that were stored at different conditions and used for sequencing. The bioinformatic analyses were performed to evaluate the impact of RNA integrity and blood sample storage conditions on the gene expression analysis.

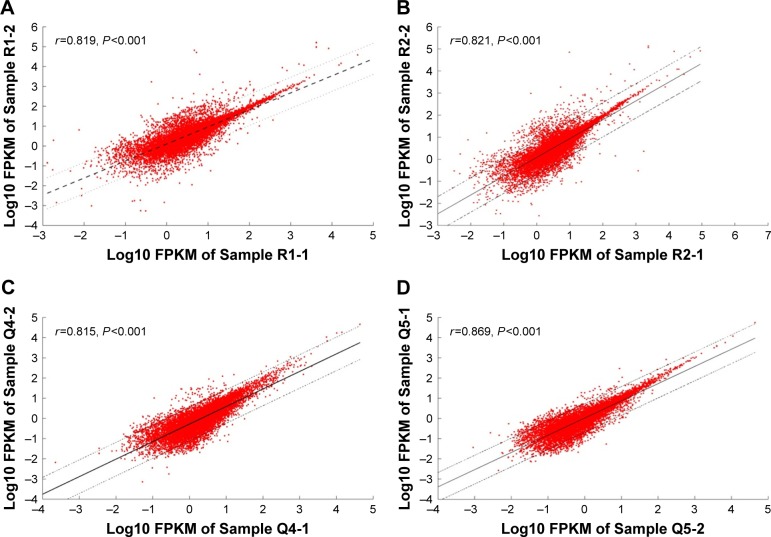
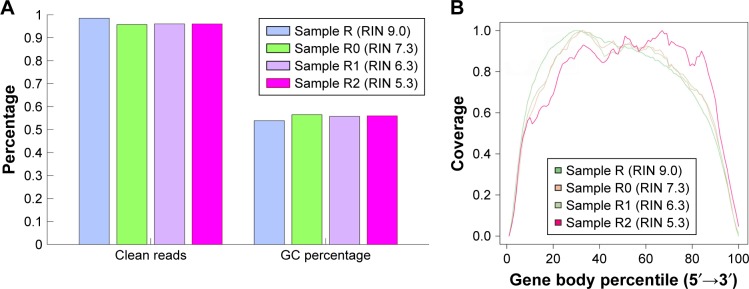
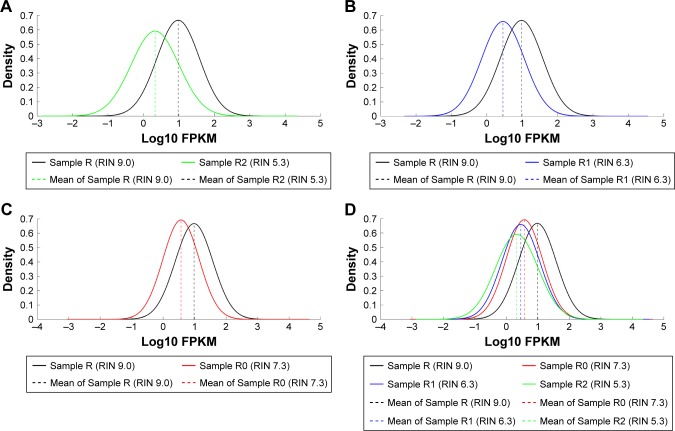
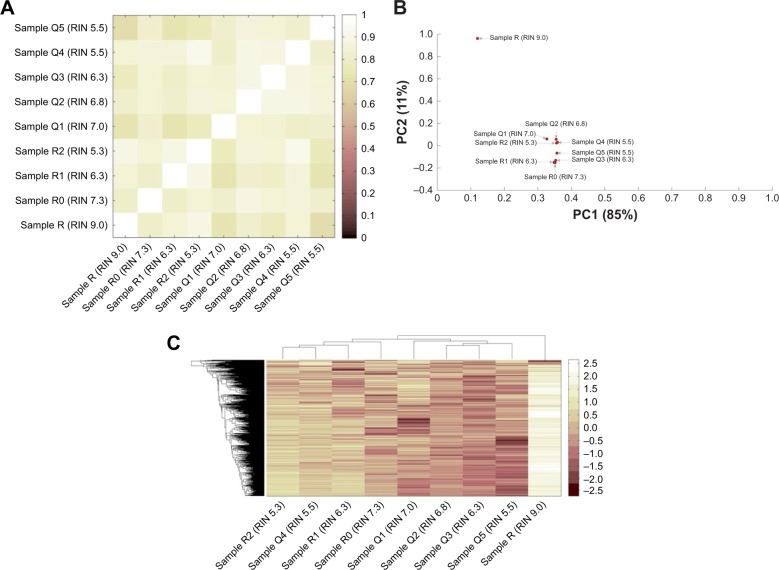
Results: Our outcomes showed that the samples with RIN values more than 5.3 scarcely affected the quantitative results of RNA-seq, and the influence of inherent cellular physiological processes on RNA-seq output could be negligible.

Conclusion: The blood samples stored at 4°C within 7 days with RIN values more than 5.3 were available for RNA-seq.

Keywords: NGS; RIN; RNA; blood; integrity; sequencing.


Conflict of interest statement

Disclosure The authors report no conflicts of interest in this work.

Figures

Figure 1
Figure 1
Reproducibility of library replicates. Notes: (A) The correlation between Sample R1-1 and Sample R1-2 (r=0.819, P<0.001). (B) The correlation between Sample R2-1 and Sample R2-2 (r=0.821, P<0.001). (C) The correlation between Sample Q4-1 and Sample Q4-2 (r=0.815, P<0.001). (D) The correlation between Sample Q5-1 and Sample Q5-2 (r=0.869, P<0.001). “R” represents the samples that were used to extract RNA immediately, and then the RNAs were stored at room temperature (25°C) for different times (30 min–24 h); “Q” represents the samples that were stored at 4°C for 4 hours, 1 day, 3 days, 5 days and 7 days prior to RNA extraction, respectively. “R1-1” and “R1-2” were the 2 replicates of samples at 1 time point; the same with “R2-1” and “R2-2”, “Q4-1” and “Q4-2”, and “Q5-1” and “Q5-2”. Abbreviation: FPKM, fragments per kilo base transcript per million.
Figure 2
Figure 2
Number of clean reads, GC percentage and gene body coverage of the samples with different RIN values. Notes: (A) The number of clean reads and GC percentage of the samples with different RIN values. Percentage of clean reads: Sample R (RIN 9.0) was 98.5%; Sample R0 (RIN 7.3) was 96.0%; Sample R1 (RIN 6.3) was 96.0% (average percentage of clean reads of Sample R1-1 and R1-2); Sample R2 (RIN 5.3) was 96.0% (average percentage of clean reads of Sample R2-1 and R2-2); GC percentage: Sample R (RIN 9.0) was 53.9%; Sample R0 (RIN 7.3) was 56.5%; Sample R1 (RIN 6.3) was 55.8% (average GC percentage of Sample R1-1 and R1-2); Sample R2 (RIN 5.3) was 56.0% (average GC percentage of Sample R2-1 and R2-2). (B) Gene body coverage of samples with different RIN values. “R” represents the samples that were used to extract RNA immediately, and then the RNAs were stored at room temperature (25°C) for different times (30 min–24 h). Abbreviation: RIN, RNA integrity number.
Figure 3
Figure 3
Changes in library complexity. Notes: Dashed lines indicate mean FPKM of the samples with different RIN values. (A) RIN=9.0 and RIN=5.3; (B) RIN=9.0 and RIN=6.3; (C) RIN=9.0 and RIN=7.3; (D) density plots of FPKM values among all 4 individuals with RIN values of 9.0, 7.3, 6.3 and 5.3, respectively. “R” represents the samples that were used to extract RNA immediately, and then the RNAs were stored at room temperature (25°C) for different times (30 min–24 h). Abbreviations: FPKM, fragments per kilo base transcript per million; RIN, RNA integrity number.
Figure 4
Figure 4
Impact of RNA integrity and blood sample storage conditions on the gene expression profiles. Notes: Sample R, Sample R0, Sample R1 and Sample R2 were the RNA samples that were extracted immediately after blood collection and then stored at room temperature (25°C) for different time periods. Sample Q1, Sample Q2, Sample Q3, Sample Q4 and Sample Q5 were the RNA samples extracted from the blood samples that were stored at 4°C for 4 hours, 1 day, 3 days, 5 days and 7 days. (A) Correlation matrix based on the Gene Expression Data; (B) Loading Factors Plot of PCA: 2-dimensional PCA plot of genome-wide expression profiles showing PC1 and PC2. The first axis (PC1) accounts for 85% of the overall variance of the data, the second axis accounts for 11% (PC2). At the PC1, the loading coefficients were 0.12 for Sample R (RIN 9.0), 0.35 for Sample R0 (RIN 7.3), 0.35 for Sample R1 (RIN 6.3), 0.36 for Sample R2 (RIN 6.3), 0.33 for Sample Q1 (RIN 7.0), 0.35 for Sample Q2 (RIN 6.8), 0.35 for Sample Q3 (RIN 6.3), 0.36 for Sample Q4 (RIN 5.5) and 0.36 for Sample Q5 (RIN 5.5). (C) Heatmap of cluster analysis. “R” represents the samples that were used to extract RNA immediately, and then the RNAs were stored at room temperature (25°C) for different times (30 min–24 h). “Q” represents the samples that were stored at 4°C for 4 hours, 1 day, 3 days, 5 days and 7 days prior to RNA extraction, respectively. Abbreviations: PCA, principal components analysis; PC1, principal components 1; PC2, principal components 2; RIN, RNA integrity number.

Similar articles

Cited by

References

    1. Sewall C, Bell DA, Clark GC, et al. Induced gene transcription: implications for biomarkers. Clin Chem. 1995;41(12 Pt 2):1829–1834. - PubMed
    1. Pfaffl MW. Guest editor’s introduction for BDQ special issue: ‘Advanced Molecular Diagnostics for Biomarker Discovery’. Biomol Detect Quantif. 2015;5:1–2. - PMC - PubMed
    1. Romero IG, Pai AA, Tung J, Gilad Y. RNA-seq: impact of RNA degradation on transcript quantification. BMC Biol. 2014;12:42. - PMC - PubMed
    1. Copois V, Bibeau F, Bascoul-Mollevi C, et al. Impact of RNA degradation on gene expression profiles: assessment of different methods to reliably determine RNA quality. J Biotechnol. 2007;127(4):549–559. - PubMed
    1. Fleige S, Pfaffl MW. RNA integrity and the effect on the real-time qRT-PCR performance. Mol Aspects Med. 2006;27(2–3):126–139. - PubMed