. 2018 Jun 13:9:1213.
doi: 10.3389/fmicb.2018.01213. eCollection 2018.

Growth and Product Formation of Clostridium ljungdahlii in Presence of Cyanide

Affiliations

Growth and Product Formation of Clostridium ljungdahlii in Presence of Cyanide

Florian Oswald et al. Front Microbiol. .

Abstract

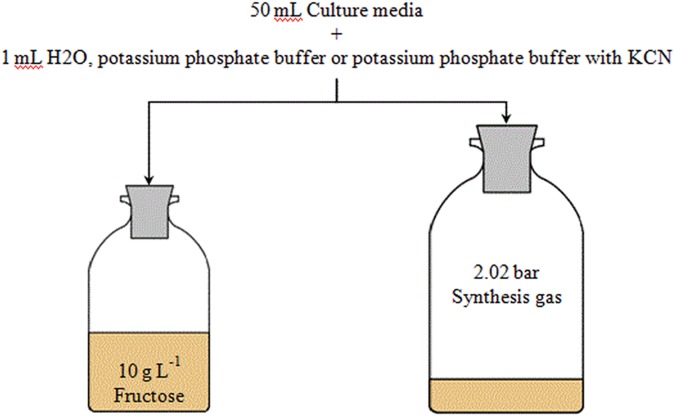
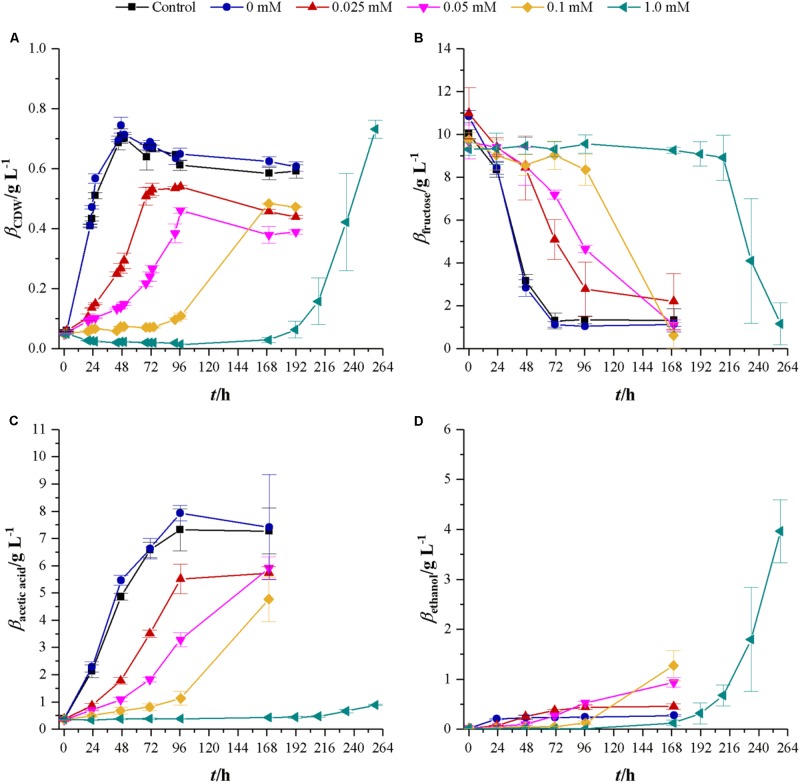
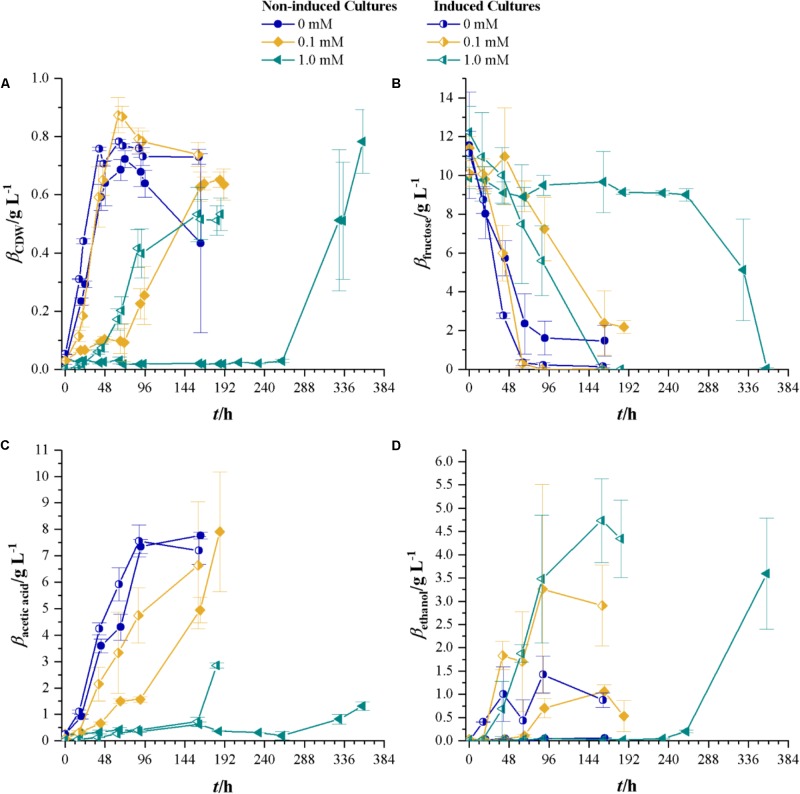
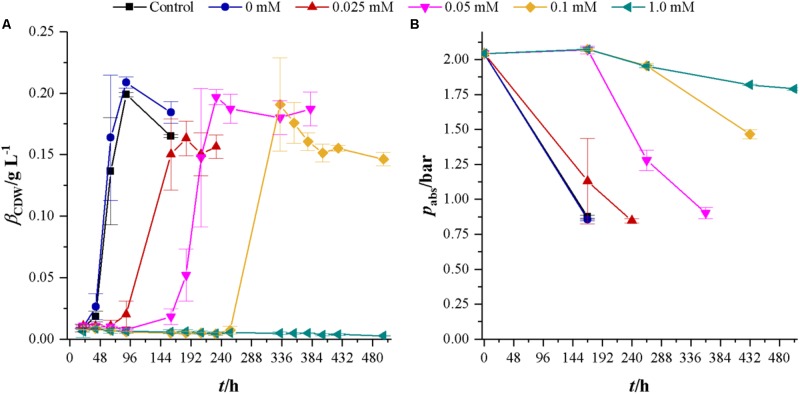
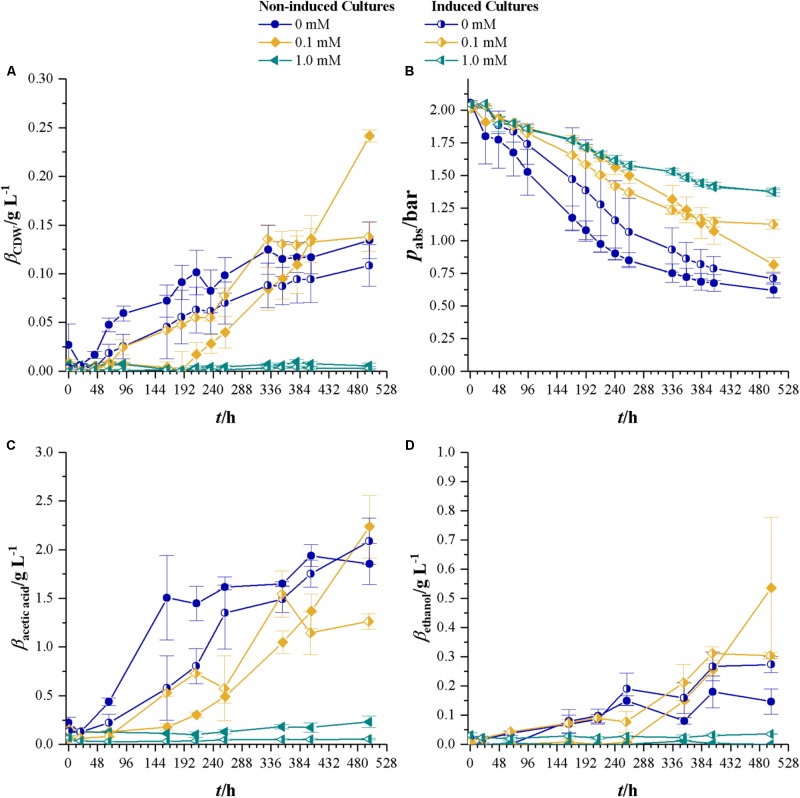
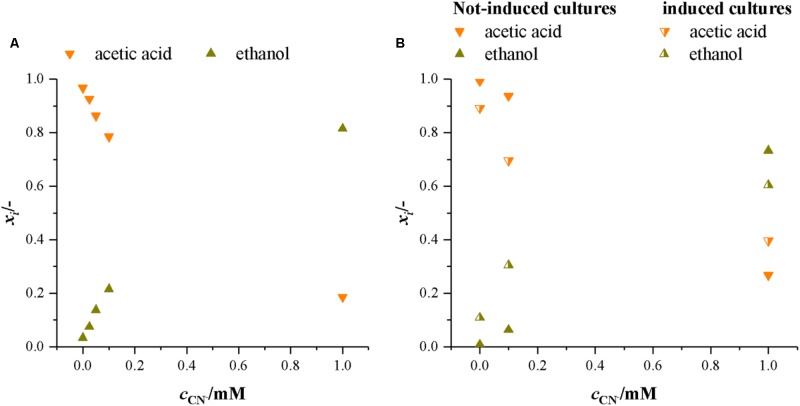
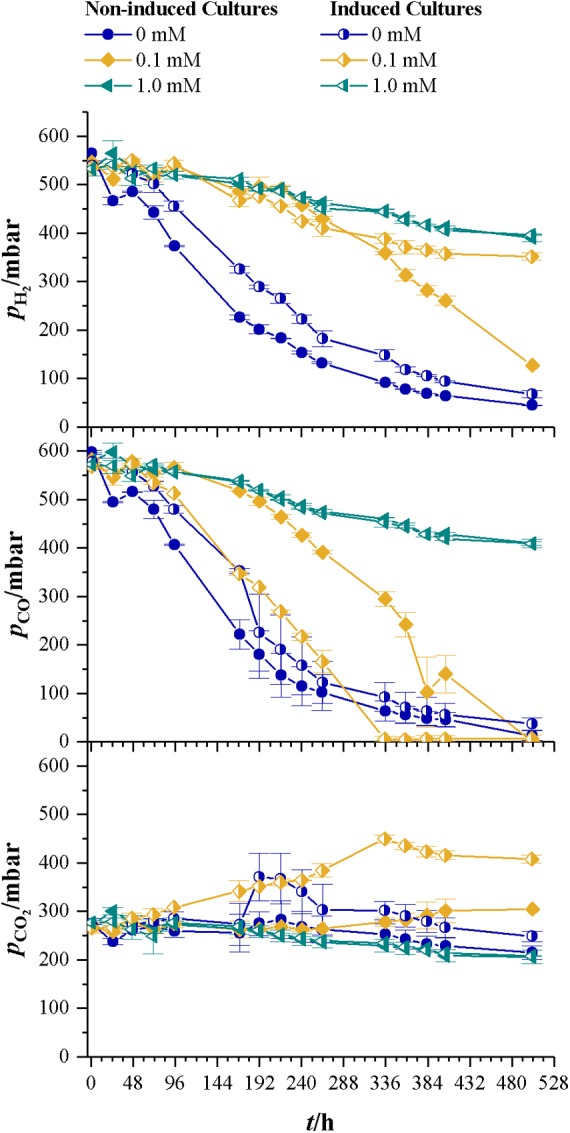
Cyanide is a minor constituent of crude syngas whose content depends on the feedstock and gasification procedure. It is a known poison to metal catalysts and inhibits iron-containing enzymes like carbon monoxide dehydrogenase of acetogenic organisms. Therefore, it is considered a component that has to be removed from the gas stream prior to use in chemical synthesis or syngas fermentation. We show that the growth rate and maximum biomass concentration of Clostridium ljungdahlii are unaffected by cyanide at concentrations of up to 1.0 mM with fructose as a carbon source and up to 0.1 mM with syngas as a carbon source. After the culture is adapted to cyanide it shows no growth inhibition. While the difference in growth is an increasing lag-phase with increasing cyanide concentrations, the product spectrum shifts from 97% acetic acid and 3% ethanol at 0 mM cyanide to 20% acetic acid and 80% ethanol at 1.0 mM cyanide for cultures growing on (fructose) and 80% acetic acid and 20% ethanol at 0.1 mM cyanide (syngas).

Keywords: Clostridium ljungdahlii; crude syngas; cyanide; ethanol formation; growth inhibition; syngas fermentation; syngas impurities.


Figures

FIGURE 1
FIGURE 1
Overview of cyanide experiments with C. ljungdahlii. Effects of cyanide are investigated in both fructose and syngas growing cultures with cyanide concentrations of 0, 0.025, 0.05, 0.1, and 1.0 mmol L-1. Experiments are conducted in triplicates.
FIGURE 2
FIGURE 2
Response of fructose growing C. ljungdahlii to increasing concentrations of cyanide. Average values for three independent bottles per concentration. Control cultures (black squares) do not contain any phosphate buffer or cyanide while cultures with 0 mM cyanide (blue dots) contain 1 mL 100 mM potassium phosphate buffer at pH 11. Other cyanide concentrations are 0.025 (red triangles), 0.05 (magenta upturned triangles), 0.1 (yellow diamonds), and 1.0 mM (petrol tilted triangles). (A) CDW; (B) mass concentration of fructose; (C) mass concentration of acetic acid; and (D) mass concentration of ethanol. Average values of three independent cultivations.
FIGURE 3
FIGURE 3
Non-induced C. ljungdahlii (full symbols) vs. the induced strain (half-filled symbols) at different cyanide concentrations with fructose as a carbon source. Cyanide concentrations are 0 (blue dots), 0.1 (yellow diamonds), and 1.0 mM (petrol tilted triangles). (A) CDW; (B) mass concentration of fructose; (C) mass concentration of acetic acid; and (D) mass concentration of ethanol. Average values of three independent cultivations. All experiments are conducted in triplicates.
FIGURE 4
FIGURE 4
Development of CDW and headspace pressure of cultivations of C. ljungdahlii in the presence of different cyanide concentrations with syngas as a carbon and energy source. Each value is an average of three cultivations. Control cultures (black squares) do not contain any phosphate buffer or cyanide while cultures with 0 mM cyanide (blue dots) contain 1 mL of 100 mM potassium phosphate buffer at pH 11. Other cyanide concentrations are 0.025 (red triangles), 0.05 (magenta upturned triangles), 0.1 (yellow diamonds), and 1.0 mM (petrol tilted triangles). (A) CDW and (B) mass concentration of fructose. Average values of three independent cultivations.
FIGURE 5
FIGURE 5
Non-induced C. ljungdahlii (full symbols) vs. the induced strain (half-filled symbols) at different cyanide concentrations with syngas as a carbon and energy source. Cyanide concentrations are 0 (blue dots), 0.1 (yellow diamonds), and 1.0 mM (petrol tilted triangles). (A) CDW; (B) mass concentration of fructose; (C) mass concentration of acetic acid; and (D) mass concentration of ethanol. Average values of three independent cultivations. Average data from triplicate experiments.
FIGURE 6
FIGURE 6
Molar ratio of products formed by C. ljungdahlii in the presence of increasing concentrations of cyanide with fructose as a carbon source. Average data from three different cultivations. (A) Experiments with non-induced cultures only. (B) Experiments with non-induced and induced cultures. Orange, upturned triangles, acetic acid and dark yellow triangles, ethanol.
FIGURE 7
FIGURE 7
Development of partial pressures of H2, CO, and CO2 for non-induced C. ljungdahlii (full symbols) vs. the induced strain (half-filled symbols) at different cyanide concentrations with syngas as carbon and energy source. Cyanide concentrations are 0 (blue dots), 0.1 (yellow diamonds), and 1.0 mM (petrol tilted triangles). Since no growth occurred in the bottles with 1.0 mM cyanide, those values represent the pressure drop due to collection of liquid and gaseous samples. Average values of three cultivations per cyanide concentration.

References

    1. Adams M. W. W., Mortenson L. E., Chen J.-S. (1981). Hydrogenase. Biochim. Biophys. Acta 594 105–176. 10.1016/0304-4173(80)90007-5 - DOI - PubMed
    1. Ahmed A., Lewis R. S. (2006). Fermentation of biomass-generated synthesis gas: effects of nitric oxide. Biotechnol. Bioeng. 97 1080–1086. 10.1002/bit.21305 - DOI - PubMed
    1. Anderson M. E., DeRose V. J., Hoffman B. M., Lindahl P. A. (1993). Identification of a cyanide binding site in CO dehydrogenase from Clostridium thermoaceticum using EPR and ENDOR spectroscopies. J. Am. Chem. Soc. 115 12204–12205. 10.1021/ja00078a085 - DOI
    1. Boerrighter H., den Uil H., Calis H.-P. (2013). “Green diesel from biomass via Fischer-Tropsch synthesis: new insights in gas cleaning and process design,” in Pyrolysis and Gasification of Biomass and Waste ed. Bridgwater A. V. (Newbury: CPL Press; ) 371–383.
    1. Broer K. M., Woolock P. J., Johnston P. A., Brown R. C. (2015). Steam/oxygen gasification system for the production of clean syngas. Fuel 140 282–292. 10.1016/j.fuel.2014.09.078 - DOI

LinkOut - more resources